

Statistical Significance of Clustering using Soft Thresholding
- PMID: 26755893
- PMCID: PMC4706235
- DOI: 10.1080/10618600.2014.948179
Statistical Significance of Clustering using Soft Thresholding
Abstract
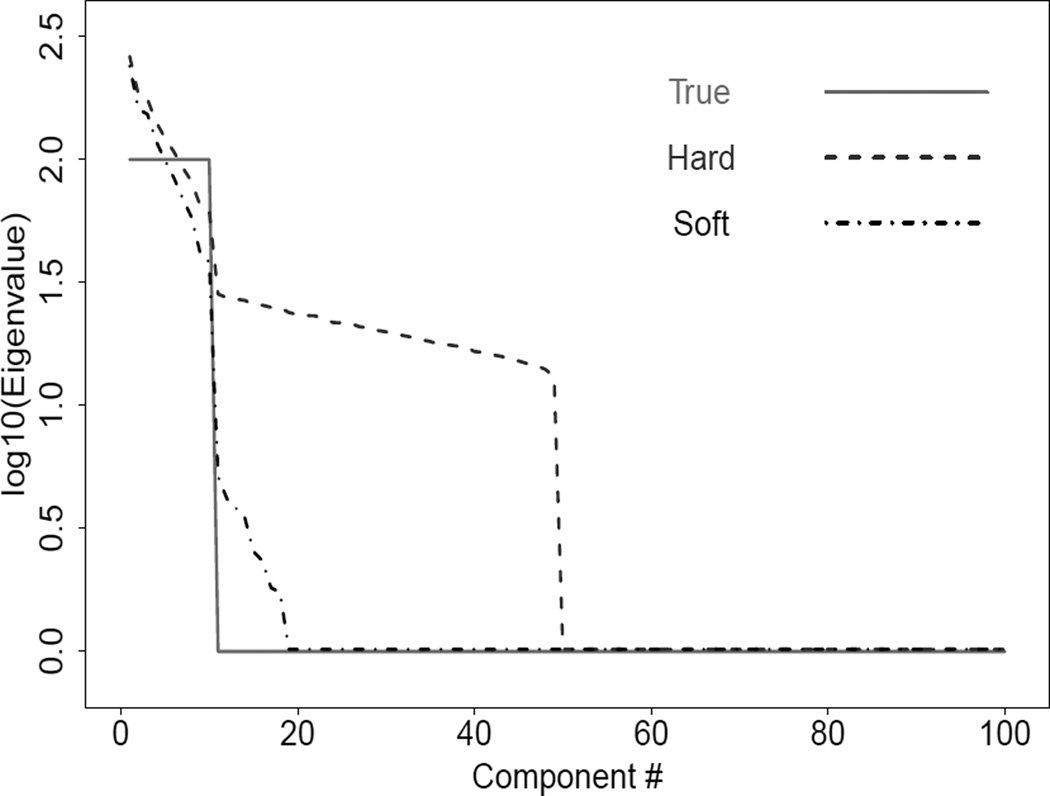
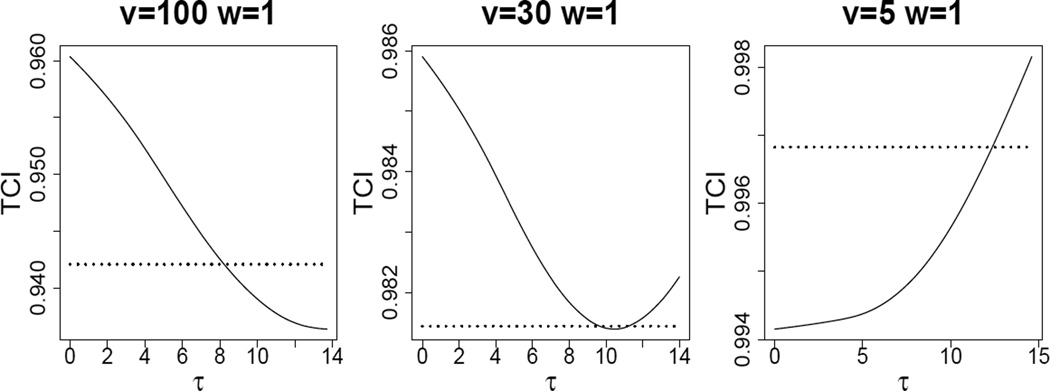
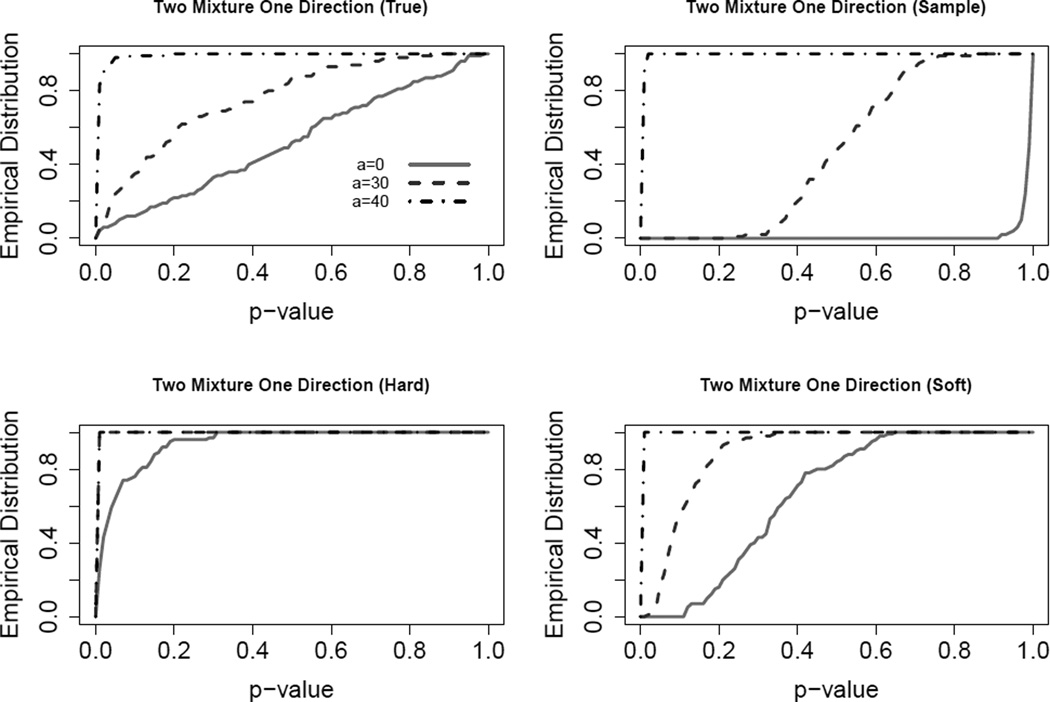
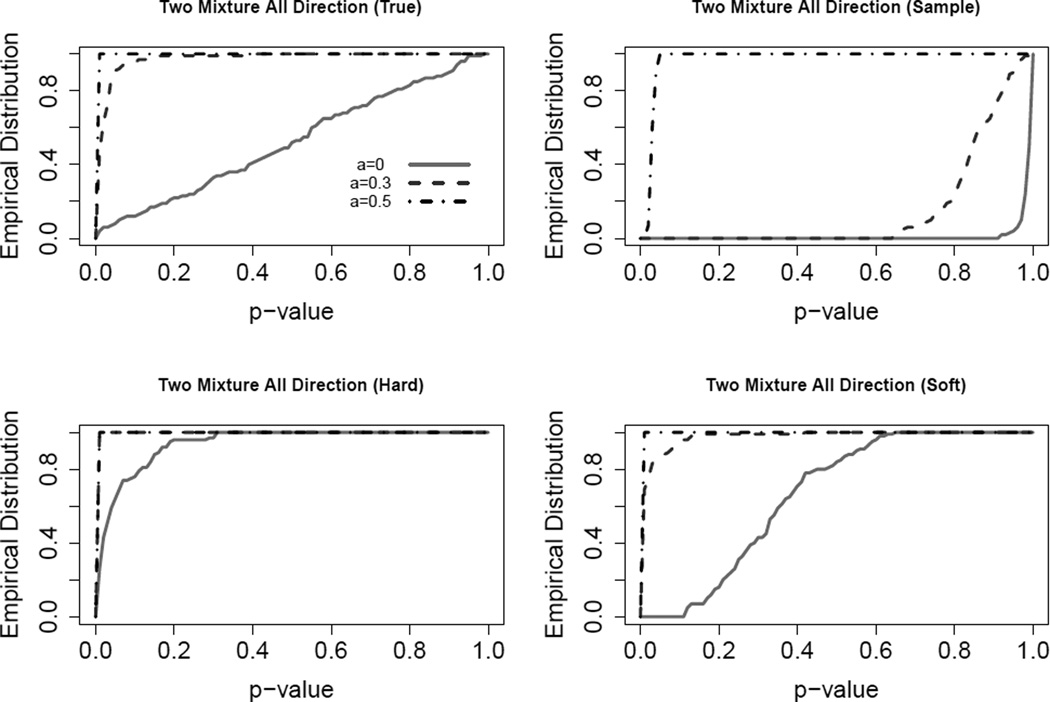
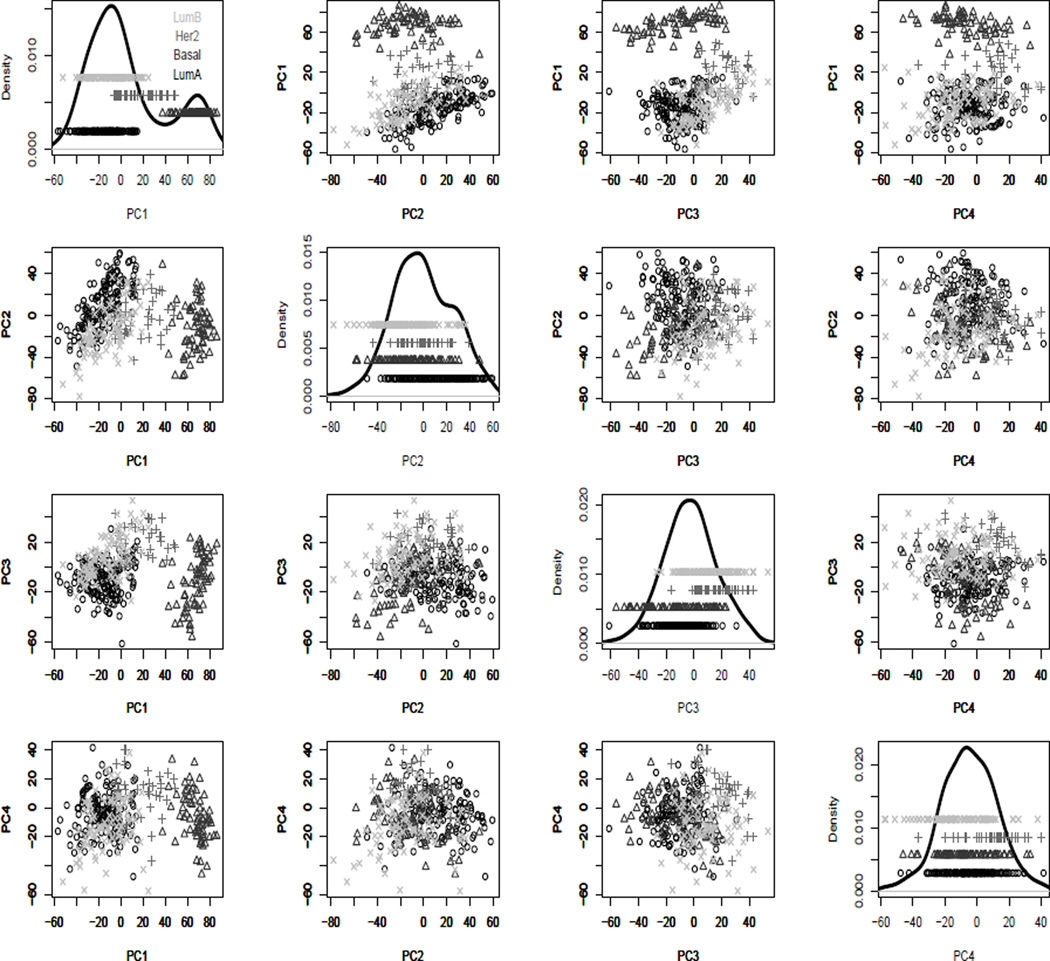
Clustering methods have led to a number of important discoveries in bioinformatics and beyond. A major challenge in their use is determining which clusters represent important underlying structure, as opposed to spurious sampling artifacts. This challenge is especially serious, and very few methods are available, when the data are very high in dimension. Statistical Significance of Clustering (SigClust) is a recently developed cluster evaluation tool for high dimensional low sample size data. An important component of the SigClust approach is the very definition of a single cluster as a subset of data sampled from a multivariate Gaussian distribution. The implementation of SigClust requires the estimation of the eigenvalues of the covariance matrix for the null multivariate Gaussian distribution. We show that the original eigenvalue estimation can lead to a test that suffers from severe inflation of type-I error, in the important case where there are a few very large eigenvalues. This paper addresses this critical challenge using a novel likelihood based soft thresholding approach to estimate these eigenvalues, which leads to a much improved SigClust. Major improvements in SigClust performance are shown by both mathematical analysis, based on the new notion of Theoretical Cluster Index, and extensive simulation studies. Applications to some cancer genomic data further demonstrate the usefulness of these improvements.
Keywords: Clustering; Covariance Estimation; High Dimension; Invariance Principles; Unsupervised Learning.
Figures
Similar articles
-
Statistical Significance of Clustering with Multidimensional Scaling.J Comput Graph Stat. 2024;33(1):219-230. doi: 10.1080/10618600.2023.2219708. Epub 2023 Jul 20. J Comput Graph Stat. 2024. PMID: 39483212 Free PMC article.
-
Statistical significance for hierarchical clustering.Biometrics. 2017 Sep;73(3):811-821. doi: 10.1111/biom.12647. Epub 2017 Jan 18. Biometrics. 2017. PMID: 28099990 Free PMC article.
-
Estimation of the number of spiked eigenvalues in a covariance matrix by bulk eigenvalue matching analysis.J Am Stat Assoc. 2023;118(541):374-392. doi: 10.1080/01621459.2021.1933497. Epub 2021 Jul 23. J Am Stat Assoc. 2023. PMID: 40012831 Free PMC article.
-
Semisupervised Clustering by Iterative Partition and Regression with Neuroscience Applications.Comput Intell Neurosci. 2016;2016:4037380. doi: 10.1155/2016/4037380. Epub 2016 Apr 26. Comput Intell Neurosci. 2016. PMID: 27212939 Free PMC article. Review.
-
Subgroup analyses in randomised controlled trials: quantifying the risks of false-positives and false-negatives.Health Technol Assess. 2001;5(33):1-56. doi: 10.3310/hta5330. Health Technol Assess. 2001. PMID: 11701102 Review.
Cited by
-
Dysregulated BMP2 in the Placenta May Contribute to Early-Onset Preeclampsia by Regulating Human Trophoblast Expression of Extracellular Matrix and Adhesion Molecules.Front Cell Dev Biol. 2021 Dec 14;9:768669. doi: 10.3389/fcell.2021.768669. eCollection 2021. Front Cell Dev Biol. 2021. PMID: 34970543 Free PMC article.
-
Multi-omics insights into the molecular signature and prognosis of hypopharyngeal squamous cell carcinoma.Commun Biol. 2025 Mar 5;8(1):370. doi: 10.1038/s42003-025-07700-0. Commun Biol. 2025. PMID: 40044946 Free PMC article.
-
Technical Optimization of SyntheticMR for the Head and Neck on a 3T MR-Simulator and 1.5T MR-Linac: A Prospective R-IDEAL Stage 2a Technology Innovation Report.medRxiv [Preprint]. 2025 Apr 10:2025.04.08.25325491. doi: 10.1101/2025.04.08.25325491. medRxiv. 2025. PMID: 40297418 Free PMC article. Preprint.
-
Powerful significance testing for unbalanced clusters.J Comput Graph Stat. 2025 Apr 16:10.1080/10618600.2025.2469756. doi: 10.1080/10618600.2025.2469756. Online ahead of print. J Comput Graph Stat. 2025. PMID: 40857487
-
Evolution of temperature preference in flies of the genus Drosophila.Nature. 2025 May;641(8062):447-455. doi: 10.1038/s41586-025-08682-z. Epub 2025 Mar 5. Nature. 2025. PMID: 40044866
References
-
- Baek J, McLachlan GJ. Mixtures of commont-factor analyzers for clustering high-dimensional microarray data. Bioinformatics. 2011;27:1269–1276. - PubMed
-
- Baik J, Silverstein JW. Eigenvalues of large sample covariance matrices of spiked population models. Journal of Multivariate Analysis. 2006;97:1382–1408.
-
- Bouveyron C, Brunet-Saumard C. Model-based clustering of high-dimensional data: A review. Computational Statistics and Data Analysis. 2014;71:52–78.
-
- Cai TT, Liu W, Luo X. A constrained L1 minimization approach to sparse precision matrix estimation. Journal of the American Statistical Association. 2011;106:594–607.
Grants and funding
LinkOut - more resources
Full Text Sources
Other Literature Sources