. 2016 Apr;25(4):826-39.
doi: 10.1002/pro.2879. Epub 2016 Feb 1.

Using hydrogen deuterium exchange mass spectrometry to engineer optimized constructs for crystallization of protein complexes: Case study of PI4KIIIβ with Rab11

Affiliations

Using hydrogen deuterium exchange mass spectrometry to engineer optimized constructs for crystallization of protein complexes: Case study of PI4KIIIβ with Rab11

Melissa L Fowler et al. Protein Sci. 2016 Apr.

Abstract

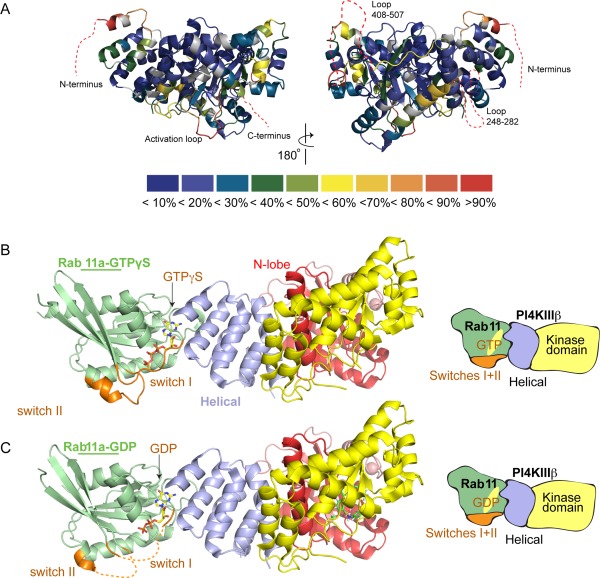
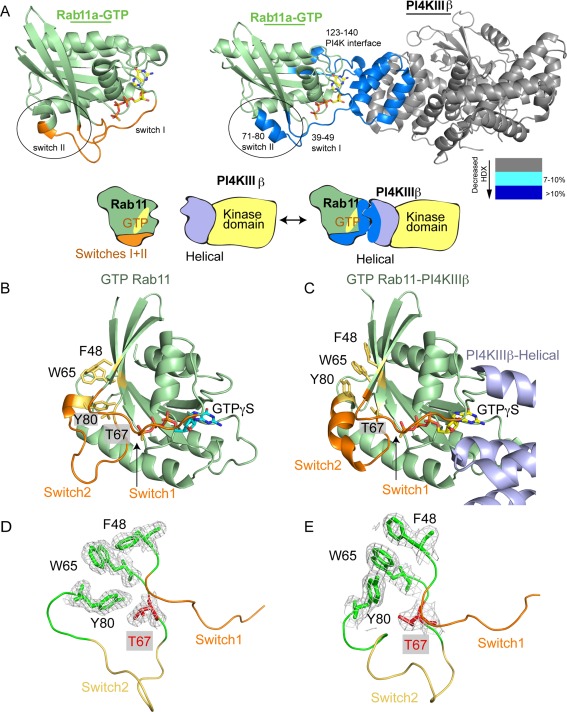
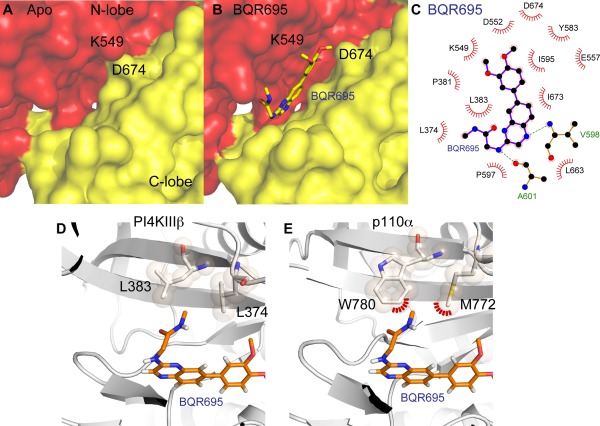
The ability of proteins to bind and interact with protein partners plays fundamental roles in many cellular contexts. X-ray crystallography has been a powerful approach to understand protein-protein interactions; however, a challenge in the crystallization of proteins and their complexes is the presence of intrinsically disordered regions. In this article, we describe an application of hydrogen deuterium exchange mass spectrometry (HDX-MS) to identify dynamic regions within type III phosphatidylinositol 4 kinase beta (PI4KIIIβ) in complex with the GTPase Rab11. This information was then used to design deletions that allowed for the production of diffraction quality crystals. Importantly, we also used HDX-MS to verify that the new construct was properly folded, consistent with it being catalytically and functionally active. Structures of PI4KIIIβ in an Apo state and bound to the potent inhibitor BQR695 in complex with both GTPγS and GDP loaded Rab11 were determined. This hybrid HDX-MS/crystallographic strategy revealed novel aspects of the PI4KIIIβ-Rab11 complex, as well as the molecular mechanism of potency of a PI4K specific inhibitor (BQR695). This approach is widely applicable to protein-protein complexes, and is an excellent strategy to optimize constructs for high-resolution structural approaches.

Keywords: HDX-MS; Rab11; X-ray crystallography; hydrogen deuterium exchange mass spectrometry; lipid signaling; phosphatidylinositol 4 kinase; phosphoinositide signaling; structural biology.


Figures

Figure 1
Figure 1
Optimized peptide map of PI4KIIIβ and Rab11. A: Peptides that were generated during online immobilized pepsin digestion of PI4KIIIβ are represented on the sequence. The sequence is colored according to the domain structure of PI4KIIIβ. B: Peptides that were generated during online immobilized pepsin digestion of Rab11 Q70L are represented on the sequence.
Figure 2
Figure 2
Identification of dynamic regions in PI4KIIIβ. Hydrogen deuterium exchange levels for the full length PI4KIIIβ enzyme after 3 seconds of deuterium exposure at zero degrees. Every point in the graph represents an individual peptide (See Fig. 1), with the central residue (i) graphed on the x‐axis versus HDX on the y‐axis. The domain organization is shown below, with areas showing high levels of deuterium incorporation shaded gray. Experiments were carried out in triplicate, and error bars are shown on the graphs (most are smaller than the size of the point, average standard deviation across entire dataset was 1.01%).
Figure 3
Figure 3
C. HDX curves for peptic peptides in both PI4KIIIβ and Rab11 in the presence and absence of their protein‐binding partner. A: Peptides in PI4KIIIβ with changes in HDX upon binding Rab11. A peptide spanning 319–337 is also shown as an example of a peptide that has no change in HDX in the presence of Rab11. Curves were carried out in triplicate, and error bars are shown on the graphs (most are smaller than the size of the point). B: Peptides in Rab11 with changes in HDX upon binding PI4KIIIβ. C: Changes in HDX mapped on the sequence of both PI4KIIIβ and Rab11 according to the legend.
Figure 4
Figure 4
Design of optimized crystallography constructs of PI4KIIIβ. A: Optimized X‐ray crystallography constructs designed using the summary of the information in Figures 2 and 3. Four truncations were made in PI4KIIIβ (1‐120, 249‐287, 408‐507, and 785‐801, referred to as xtal‐PI4KIIIβ), and Rab11 was full‐length. Representative crystals of GTPγS Rab11 with Apo xtal‐PI4KIIIβ, best crystals diffracted to 2.65 Å. B: HDX levels for the full length and truncated versions of PI4KIIIβ after 3 seconds of deuterium exposure at 0°. C: Pulldown assays with GST‐tagged Rab11 Q70L loaded with GTPγS for both the full‐length wild‐type PI4KIIIβ and xtal‐PI4KIIIβ constructs. The inputs and the bound proteins were analysed on SDS gels stained with Instant Blue. D: Lipid kinase assay of full‐length wild‐type PI4KIIIβ and xtal + cterm PI4KIIIβ constructs. Assays were carried out with 200 nM PI4KIIIβ in the presence of 0.5 mg/mL phosphatidylinositol vesicles with 10 μM ATP. Enzyme activity is normalized to the activity of the full length wild‐type enzyme. Substrate conversion of ATP was ∼15% for the wild type PI4KIIIβ.
Figure 5
Figure 5
HDX and structures of PI4KIIIβ bound to GTPγS and GDP loaded Rab11. A: The hydrogen exchange levels of PI4KIIIβ at 3 s of exchange at 21°C were mapped onto the structure of PI4KIIIβ according to the legend. Predicted intrinsically disordered loops are indicated in red. B: Structure of PI4KIIIβ bound to GTPγS loaded Rab11. Helical domain is shown in blue, with the kinase domain shown in red and yellow. Rab11 is colored in green, with the switch regions colored orange. C: Structure of PI4KIIIβ bound to GDP loaded Rab11. Proteins are coloured accorded to the scheme described in B.
Figure 6
Figure 6
HDX‐MS of Rab11 bound to PI4K, and conformational changes in switch regions of Rab11. A: The HDX‐MS information from Figure 3 mapped onto the structure of both PI4KIIIβ and Rab11. The structure of GTPγS loaded Rab11 alone (pdb: 1OIW) is shown to the left, with the HDX‐MS data plotted on the structure of PI4KIIIβ bound to GTPγS loaded Rab11 on the right. Decreases in exchange are indicated on the legend. Circled is the region of switch 2 showing a conformational change between the two structures. B: Structure of PI4KIIIβ bound to GTPγS loaded Rab11. Helical domain is shown in blue, with the kinase domain shown in red and yellow. Rab11 is colored in green, with the switch regions colored orange. The hydrophobic triad residues, as well as Thr67 are shown in yellow. C: Structure of GTPγS loaded Rab11 (from PDB: 10IW 31). Proteins and residues are coloured according to the scheme described in B. D,E: The 2F0‐Fc density for both PI4KIIIβ bound to GTPγS and GTPγS loaded Rab11 for the hydrophobic triad and Thr67 molecules is shown. Maps were contoured at 1.2 σ. The shift in conformation between these two states can also be visualized in Supporting Information movie 1.
Figure 7
Figure 7
Structure of the active site of PI4KIIIβ in the Apo state and bound to the inhibitor BQR695. A: The active site of PI4KIIIβ in its Apo state, with the two residues (K549, D674) that have a change in conformation when compared with inhibitor bound states labeled. B: The fit of BQR695 in the PI4KIIIβ active site pocket. The kinase domain is colored with the N‐lobe shown in red, and the C‐lobe shown in yellow. C: Residues mediating the interaction of PI4KIIIβ with BQR695 are shown, with putative hydrogen bonds indicated by dotted lines. Figure generated using ligplot.53 D,E: Comparision of the PI4KIIIβ and class I PI3K (p110α) active site. Shown are the PI4KIIIβ structure with BQR695, and a model of p110α (derived from PDB: 4JPS 54) with BQR695. Residues in similar position in PI4KIIIβ and p110α are highlighted (L373 and L384 in PI4KIIIβ) and (M772 and W780 in p110α) are shown as sticks. Potential clashes in the p110α are highlighted in red.

References

    1. Nogales E, Scheres SHW (2015) Cryo‐EM: A unique tool for the visualization of macromolecular complexity. Mol Cell 58:677–689. - PMC - PubMed
    1. Ward JJ, Sodhi JS, McGuffin LJ, Buxton BF, Jones DT (2004) Prediction and functional analysis of native disorder in proteins from the three kingdoms of life. J Mol Biol 337:635–645. - PubMed
    1. Linding R, Jensen LJ, Diella F, Bork P, Gibson TJ, Russell RB (2003) Protein disorder prediction: implications for structural proteomics. Struct Fold Des 11:1453–1459. - PubMed
    1. Tompa P (2012) Intrinsically disordered proteins: a 10‐year recap. Trends Biochem Sci 37:509–516. - PubMed
    1. Sugase K, Dyson HJ, Wright PE (2007) Mechanism of coupled folding and binding of an intrinsically disordered protein. Nature 447:1021–1025. - PubMed

Publication types

MeSH terms

Substances