. 2016 Jan 12:7:10230.
doi: 10.1038/ncomms10230.

Periprostatic adipocytes act as a driving force for prostate cancer progression in obesity

Affiliations

Periprostatic adipocytes act as a driving force for prostate cancer progression in obesity

Victor Laurent et al. Nat Commun. .

Abstract

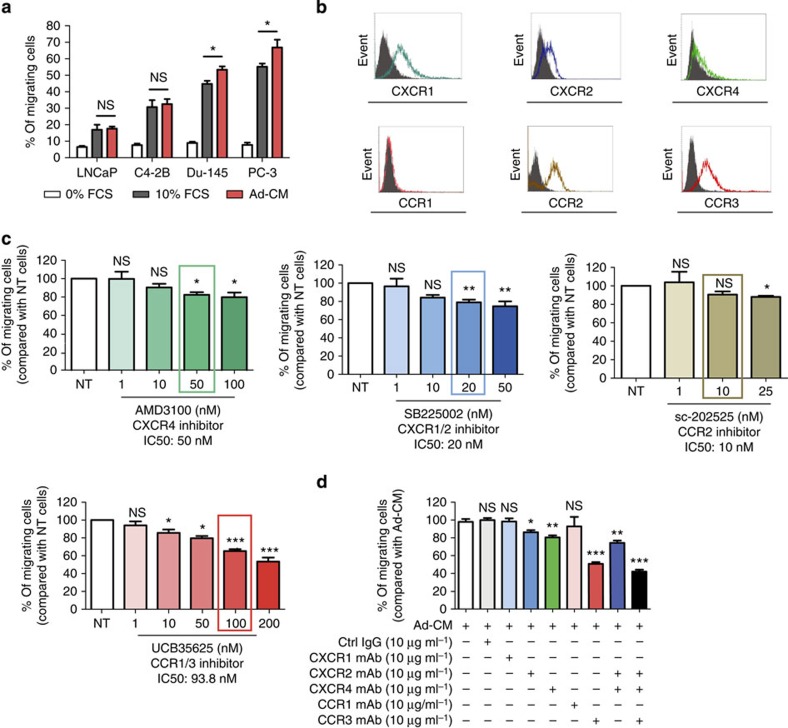
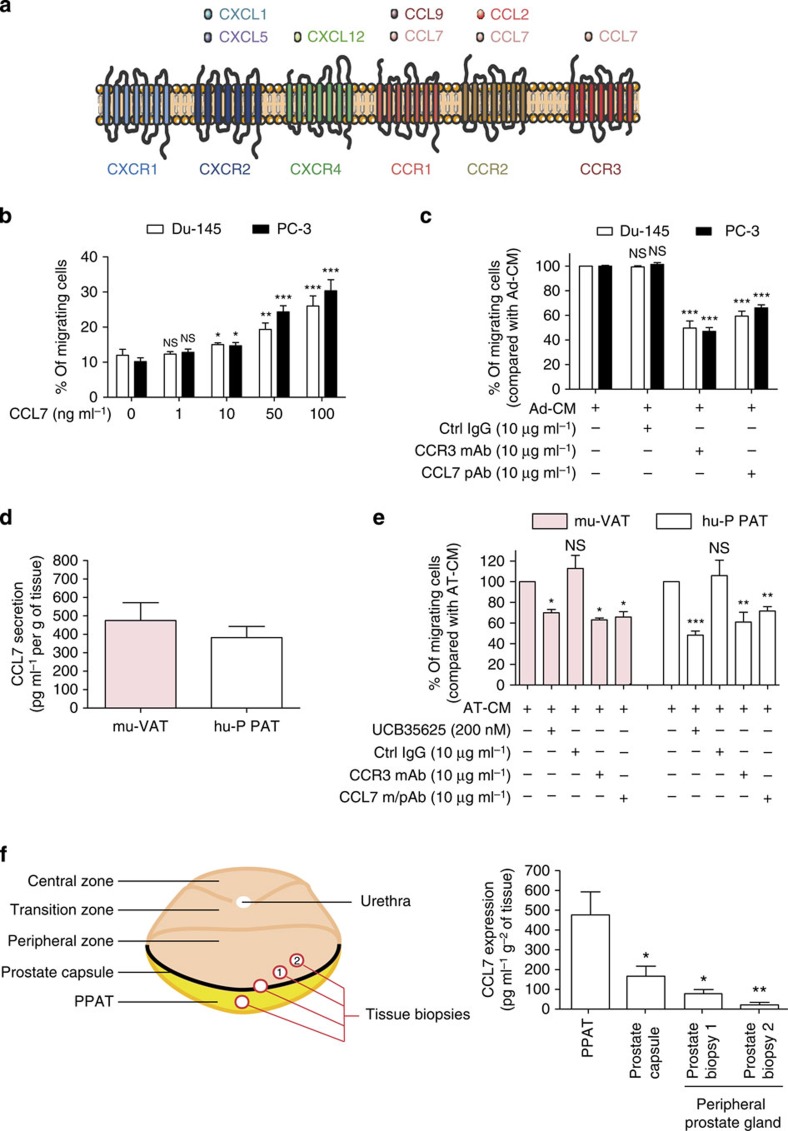
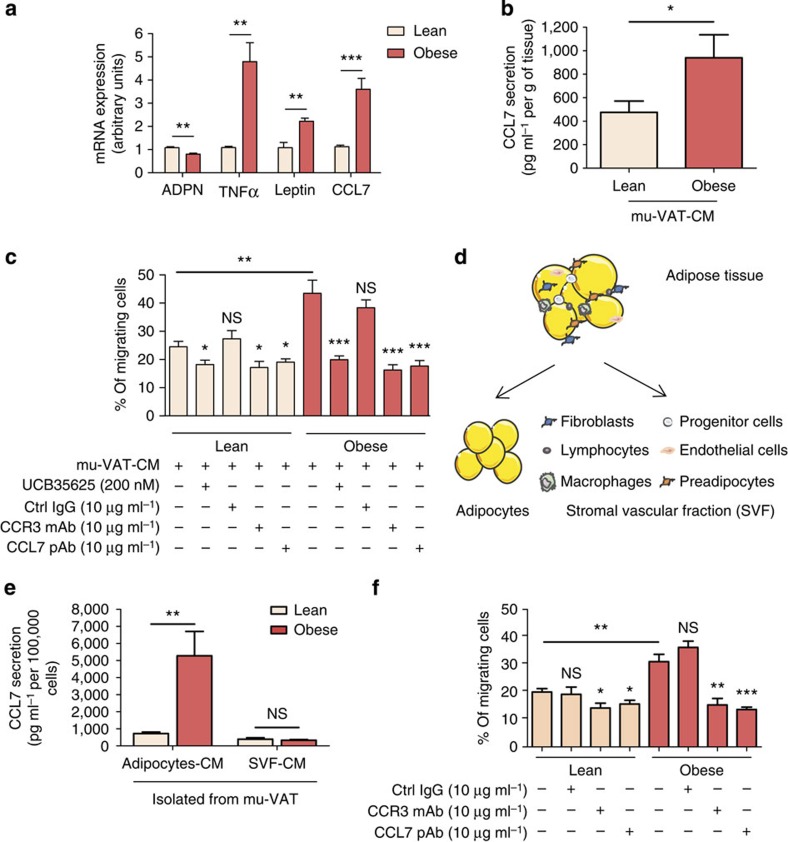
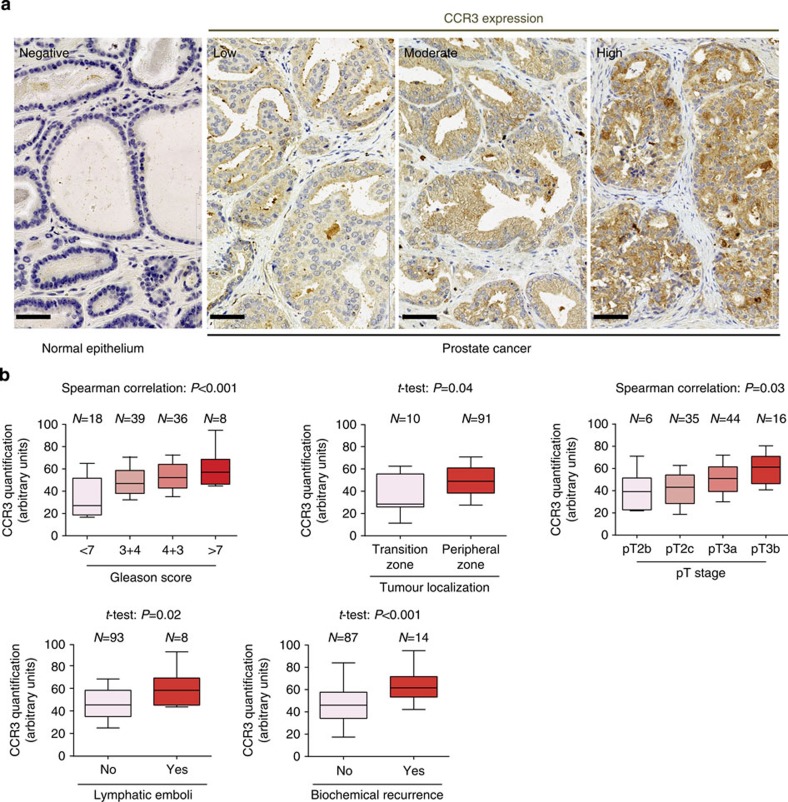
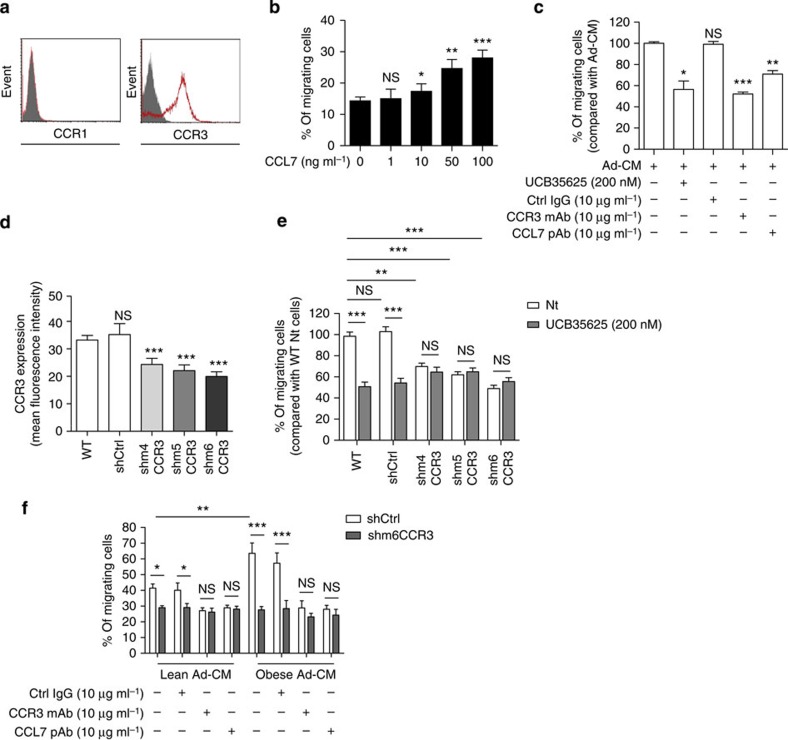
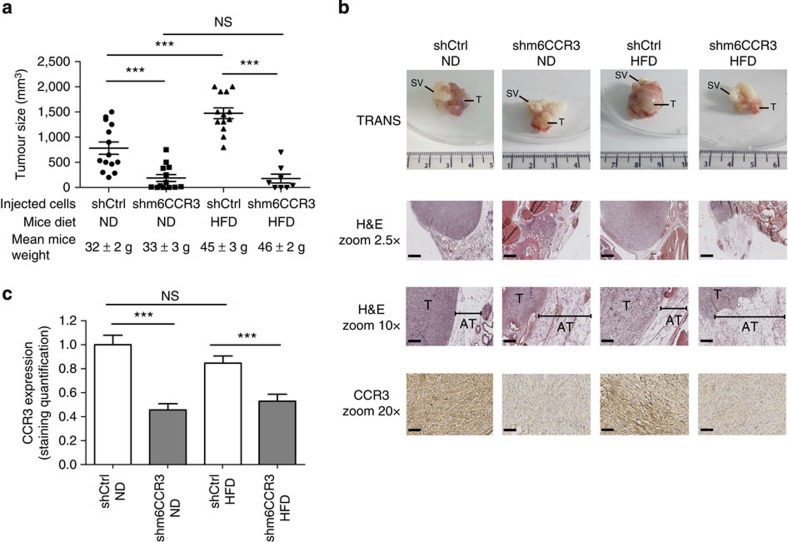
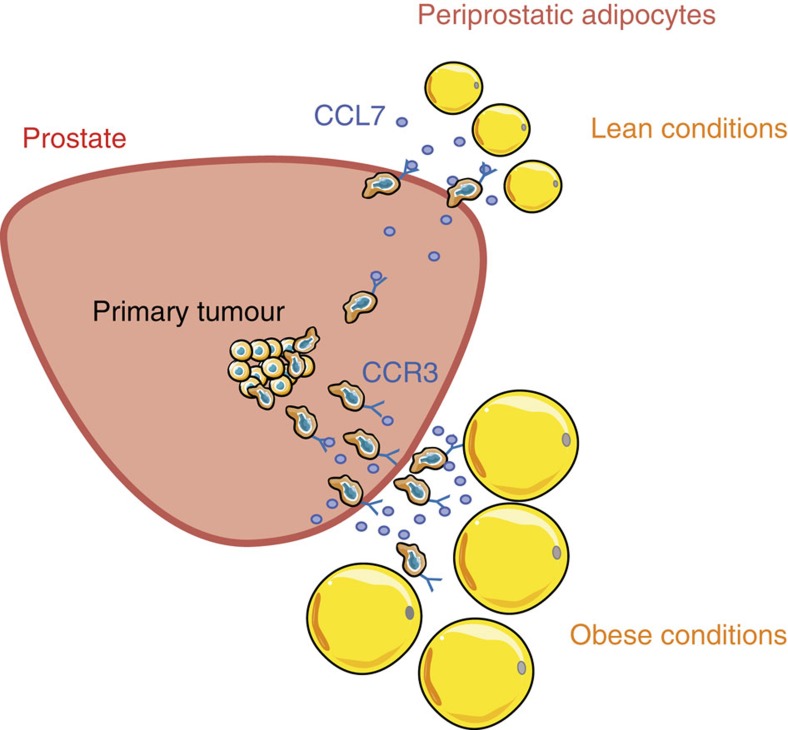
Obesity favours the occurrence of locally disseminated prostate cancer in the periprostatic adipose tissue (PPAT) surrounding the prostate gland. Here we show that adipocytes from PPAT support the directed migration of prostate cancer cells and that this event is strongly promoted by obesity. This process is dependent on the secretion of the chemokine CCL7 by adipocytes, which diffuses from PPAT to the peripheral zone of the prostate, stimulating the migration of CCR3 expressing tumour cells. In obesity, higher secretion of CCL7 by adipocytes facilitates extraprostatic extension. The observed increase in migration associated with obesity is totally abrogated when the CCR3/CCL7 axis is inhibited. In human prostate cancer tumours, expression of the CCR3 receptor is associated with the occurrence of aggressive disease with extended local dissemination and a higher risk of biochemical recurrence, highlighting the potential benefit of CCR3 antagonists in the treatment of prostate cancer.


Conflict of interest statement

Part of the authors (VL, AG, BM for Bernard Malavaud, PV and CM) are inventors of a patent application (FR1455491 - PCTIB2015054550) entitled “Inhibition de la chimiokine CCL7 ou de son récepteur CCR3 pour le traitement et le diagnostic du cancer de la prostate”. The remaining authors have no competing financial interests.

Figures

Figure 1
Figure 1. Adipocytes promote the migration of prostate cancer cells in a CCR3-dependent manner.
(a) In vitro migration of the indicated prostate cancer cell lines towards a medium containing either 0% (used as a negative control) or 10% FCS, or towards conditioned medium obtained from 3T3-F442A mature adipocytes (Ad-CM). Data are shown as mean±s.e.m. (n=5). (b) One representative experiment out of three showing the expression of chemokine receptors (CXCR1, CXCR2, CXCR4, CCR1, CCR2 and CCR3) detected by flow cytometry in the human prostate cancer cell line, PC-3. Solid histogram: control isotypes; open histogram: indicated antigens. (c) In vitro migration towards Ad-CM in the presence of increasing doses of the indicated receptor antagonists. Cells were pre-incubated with the receptor antagonists for 30 min at 37 °C before their addition to Transwell chambers. The receptor antagonists were also present during the migration assay (12 h). The molecules were used within a range of doses that inhibit chemotaxis; the line surrounding the histogram indicates the previously described IC50 of the inhibitors in chemotaxis experiments. Data are shown as mean±s.e.m (n=3). (d) Similar experiments were performed in the presence of blocking monoclonal antibodies (mAbs) directed against CXCR1, CXCR2, CXCR4, CCR1, CCR3 or control IgG at 10 μg ml−1 used alone or in combination. Bar plots represent the percentage of migrating cells relative to the migration of untreated cells (set to 100%). Data are shown as mean±s.e.m (n=3). The statistical significance of differences between means of migrating cells (in %) in treated versus untreated (NT) cells was evaluated with Student's t-tests. Statistical analysis: * statistically significant by Student's t-test P<0.05, **P<0.01, ***P<0.001, NS, not significant. n stands for the number of replicated independent experiments.
Figure 2
Figure 2. CCL7/CCR3 axis is involved in the directed migration of prostate cancer cells towards PPAT.
(a) Graphic representation of chemokines identified by proteomic analyses of Ad-CM and their corresponding receptors. (b) In vitro migration of Du-145 and PC-3 cells towards medium without serum in the presence or absence of CCL7 recombinant protein (1–100 ng ml−1). Data are shown as mean±s.e.m. (n=3). The statistical differences between the mean percentages of migrating cells in experiments performed in the presence versus in the absence of CCL7 were evaluated with Student's t-tests. (c) In vitro migration of Du-145 and PC-3 cells towards Ad-CM in the presence of m/pAbs directed against CCR3 or CCL7, or control IgG (10 μg ml−1). Bar plots represent the percentage of migrating cells relative to the migration of untreated cells (set to 100%). Data are shown as mean±s.e.m (n=3). The statistical significance of differences between means of migrating cells (in %) in treated versus untreated cells was evaluated with Student's t-tests. (d) CCL7 secretion by murine visceral adipose tissue (mu-VAT, three samples) or human periprostatic adipose tissue (hu-PPAT, five samples). Data are shown as mean±s.e.m. (e) In vitro migration of PC-3 cells towards mu-VAT and hu-PPAT conditioned medium (AT-CM) in the presence or absence of CCR3 antagonist (UCB35625, 200 nM), blocking m/pAbs directed against CCR3 or CCL7, or control IgG (10 μg ml−1). Bar plots represent the percentage of migrating cells relative to the migration of untreated cells (set to 100%). Data are shown as mean±s.e.m. (n=3). The statistical significance of differences between means of migrating cells (in %) in treated versus untreated cells was evaluated with Student's t-tests. (f) Graphic representation of the site of the staged biopsies performed in human prostatectomy specimens (n=3) is shown (left panel) and the expression of CCL7 in these biopsies is shown (right panel). The mean expression of CCL7 in staged prostate biopsies was compared with the mean expression in PPAT. Statistical analysis: * statistically significant by Student's t-test P<0.05, **P<0.01, ***P<0.001, NS, not significant. n stands for the number of replicated independent experiments. n stands for the number of replicated independent experiments.
Figure 3
Figure 3. CCL7 secretion by mature adipocytes is positively regulated in obesity and promotes an increased directed migration of prostate cancer cells.
(a) mRNA were extracted from murine visceral adipose tissue (mu-VAT) of age-matched C57BL/6 mice either lean or obese (after 12 weeks of high-fat diet). Expression of CCL7 mRNA was evaluated by RT-qPCR. A panel of genes whose expression has been shown to decrease (Adiponectin, ADPN) or increase (tumor necrosis factor-α (TNF-α), Leptin) in obesity was used as a control to validate the samples. Data are shown as mean±s.e.m. (n=5). (b) Secretion of CCL7 in mu-VAT-CM obtained from lean or obese C57BL/6 mice (three animals per group). Data are shown as mean±s.e.m. (n=3). (c) In vitro migration of PC-3 cells towards mu-VAT-CM obtained from lean or obese animals (three animals per group) treated or not with CCR3 inhibitor (UCB35625 200 nM), blocking m/pAbs directed against CCR3 or CCL7, or control isotype (all used at 10 μg ml−1). Data are shown as mean±s.e.m. (n=3). The statistical significance of differences between means of migrating cells (in %) in treated versus untreated cells was evaluated with Student's t-tests. (d) Graphic representation of the cellular components of adipose tissue. (e) CCL7 secretion by primary adipocytes or SVF cells isolated from mu-VAT of C57BL/6 lean or obese mice (six animals per group). Data are shown as mean±s.e.m. (n=3). (f) In vitro migration of PC-3 cells towards mu-VAT adipocyte-CM. Adipocytes were isolated from the mu-VAT of lean or obese C57BL/6 mice (six animals per group) in the presence or absence of blocking m/pAbs directed against CCR3 or CCL7 or control IgG (10 μg ml−1). Data are shown as mean±s.e.m. (n=3). The statistical significance of differences between means of migrating cells (in %) in treated versus untreated cells was evaluated with Student's t-tests. The differences between the percentages of migrating cells towards Ad-CM isolated from mu-VAT from obese versus lean mice are also shown. Statistical analysis: * statistically significant by Student's t-test P<0.05, **P<0.01, ***P<0.001, NS, not significant. n stands for the number of replicated independent experiments.
Figure 4
Figure 4. CCR3 is expressed in prostate cancer and its expression is correlated with poor prognosis and a high risk of local extension.
(a) Immunohistochemical staining for CCR3, as well as hematoxylin counter-staining, was performed in normal epithelium and human prostate cancer tissues. Two pathologists, who were blind to clinical data, independently scored CCR3 expression. Pictures show a representative experiment for each of the staining intensities of CCR3 expression found in human tumours (low, moderate and high expression) whereas normal epithelium remains negative in all tested samples (pictures, zoom 40 × ). Scale bars, 50 μm. (b) CCR3 expression was evaluated by immunohistochemistry on a TMA containing 101 tumours in duplicate. The boxes represent the median (black middle line) limited by the 25th (Q1) and 75th (Q3) percentiles. The whiskers are the upper and lower adjacent values, which are the most extreme values within Q3+1.5(Q3−Q1) and Q1−1.5(Q3−Q1), respectively. These box plots represent CCR3 values comparing tumours Gleason score, tumour localization, tumour stage, patients with and without lymphatic emboli or biochemical recurrence. For the correlation between CCR3 expression and variables with more than two ordered classes regarding disease severity (for example, Gleason score or tumour stage), we used Spearman's correlation tests assuming a monotonic relation between considered variables. We used Student's t-tests (notified by *) to correlate CCR3 expression to non-ordered categorical variables (for example, presence or not of emboli or biochemical recurrence). The biochemical recurrence, as defined by the European Association of Urology guidelines, corresponded to two PSA readings >0.2 ng ml−1.
Figure 5
Figure 5. Down-regulation of CCR3 expression in TRAMP-C1P3 cells.
(a) One representative experiment out of three showing CCR1 and CCR3 expression detected by flow cytometry in the murine prostate cancer cell line TRAMP-C1P3. Solid histogram: control isotypes; open histogram: CCR1 or CCR3. (b) In vitro migration of TRAMP-C1P3 towards medium without serum, supplemented or not with CCL7 recombinant protein (1–100 ng ml−1). Data are shown as mean±s.e.m. (n=3). The statistical differences between the mean percentages of migrating cells in experiments performed in the presence versus in the absence of CCL7 were evaluated with Student's t-tests. (c) In vitro migration of TRAMP-C1P3 cells towards Ad-CM as a chemoattractant treated or not with UCB35625 (200 nM), anti-CCR3, anti-CCL7 Abs, or control isotype (10 μg ml−1). Data are shown as mean±s.e.m. (n=3). Data are expressed as the percentage of migrating cells relative to the migration of untreated cells (set to 100%). The statistical significance of differences between means of migrating cells in treated versus untreated cells was evaluated with Student's t-tests. (d) Mean fluorescence intensity of CCR3 expression determined by flow cytometry in TRAMP-C1P3 cells (WT), transfected with control shRNA (shCtrl) or with one of three different shRNA sequences targeting the CCR3 receptor (shm4, m5 and m6CCR3). Data are shown as mean±s.e.m. (n=3). The statistical significance of differences between means of fluorescence in control or CCR3 invalidated cells versus WT cells was evaluated with Student's t-tests. (e) In vitro migration of TRAMP-C1P3 cells transfected with either shCtrl or three different shRNA sequences targeting the CCR3 receptor (shm4, m5 and m6CCR3) towards Ad-CM. As indicated, cells were treated with the CCR3 antagonist UCB35625. Data are shown as mean±s.e.m. (n=3). (f) In vitro migration of TRAMP-C1P3 cells transfected with either shCtrl or shm6CCR3 towards CM of mu-VAT adipocytes obtained from lean or obese mice. As indicated, cells were treated with Abs against CCR3 or CCL7, or control isotype (10 μg ml−1). Data are shown as mean±s.e.m. (n=3). Statistical analysis: * statistically significant by Student's t-test P<0.05, **P<0.01, ***P<0.001, NS, not significant. n stands for the number of replicated independent experiments.
Figure 6
Figure 6. CCR3 contributes to prostate cancer progression in vivo and this event is regulated by obesity.
(a) GFP-tagged shCtrl or m6CCR3 transfected TRAMP-C1P3 cells were injected into the prostate (dorsal lobe) of 18 week-old C57BL/6 mice fed a standard rodent diet (normal diet, ND) or a high-fat diet (HFD). Graphs depict the tumour volume measured 21 days after injection. The mean weight of the mice before the injection, as well as the mean tumour size±s.e.m. in each group, is shown on the legend (N⩾8 tumours per group). (b) Representative photograph of a tumour from each group taken with white light (Trans) imaging (upper line of the picture; T, tumour; SV, seminal vesicles). The three other lines represent tumour sections from each group after hematoxylin-eosin (H&E) coloration (top and middle, T, tumour; AT, adipose tissue) and CCR3 staining in tumours (lower line). The hypertrophy of adipocytes in obese mice is shown by their comparison with adipocytes from lean mice in mice grafted with the shm6CCR3 cell line (mean size in ND: 56.47±16.63 μm versus mean size in HFD: 133.53±23.82 μm, P<0.001, as determined using ImageJ software). Scale bars, respectively, for 2.5, 10 and 20 × : 1 mm, 250 and 125 μm. (c) Quantitative expression of CCR3 staining with ImageJ. Data are shown as mean±s.e.m. (three tumours in each group with five fields per tumour). Statistical analysis: *** statistically significant by Student's t-test P<0.001, NS, not significant.
Figure 7
Figure 7. Schematic representation of the proposed role of PPAT in the local dissemination of prostate cancer and its amplification in obesity.
Mature adipocytes secrete the chemokine CCL7, which diffuses through the capsule to the peripheral zone of the prostate. The interaction between CCL7 and the CCR3 receptor, expressed by invasive tumour cells, promote their migration outside of the prostate gland. Hypertrophic adipocytes secrete larger amounts of CCL7, which increases adipocyte-dependent directed migration facilitating extraprostatic extension in obesity.

Comment in

References

    1. Magi-Galluzzi C. et al.. International Society of Urological Pathology (ISUP) Consensus Conference on Handling and Staging of Radical Prostatectomy Specimens. Working group 3: extraprostatic extension, lymphovascular invasion and locally advanced disease. Mod. Pathol. 24, 26–38 (2011) . - PubMed
    1. Kapoor J. et al.. Extraprostatic extension into periprostatic fat is a more important determinant of prostate cancer recurrence than an invasive phenotype. J. Urol. 190, 2061–2066 (2013). - PubMed
    1. Ouchi N., Parker J. L., Lugus J. J. & Walsh K. Adipokines in inflammation and metabolic disease. Nat. Rev. Immunol. 11, 85–97 (2011). - PMC - PubMed
    1. Wang Y. Y. et al.. Adipose tissue and breast epithelial cells: a dangerous dynamic duo in breast cancer. Cancer Lett. 324, 142–151 (2012). - PubMed
    1. Allott E. H., Masko E. M. & Freedland S. J. Obesity and prostate cancer: weighing the evidence. Eur. Urol. 63, 800–809 (2013). - PMC - PubMed

Publication types

MeSH terms