

Collaborative Modeling of the Benefits and Harms Associated With Different U.S. Breast Cancer Screening Strategies
- PMID: 26756606
- PMCID: PMC5079106
- DOI: 10.7326/M15-1536
Collaborative Modeling of the Benefits and Harms Associated With Different U.S. Breast Cancer Screening Strategies
Abstract
Background: Controversy persists about optimal mammography screening strategies.
Objective: To evaluate screening outcomes, taking into account advances in mammography and treatment of breast cancer.
Design: Collaboration of 6 simulation models using national data on incidence, digital mammography performance, treatment effects, and other-cause mortality.
Setting: United States.
Patients: Average-risk U.S. female population and subgroups with varying risk, breast density, or comorbidity.
Intervention: Eight strategies differing by age at which screening starts (40, 45, or 50 years) and screening interval (annual, biennial, and hybrid [annual for women in their 40s and biennial thereafter]). All strategies assumed 100% adherence and stopped at age 74 years.
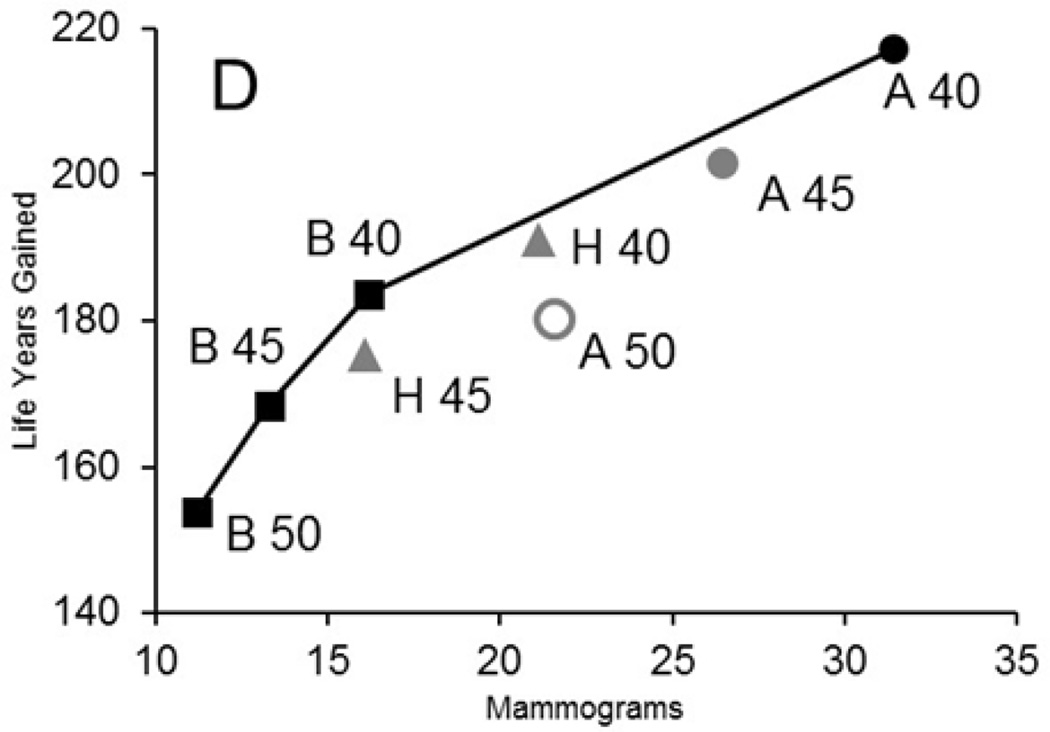
Measurements: Benefits (breast cancer-specific mortality reduction, breast cancer deaths averted, life-years, and quality-adjusted life-years); number of mammograms used; harms (false-positive results, benign biopsies, and overdiagnosis); and ratios of harms (or use) and benefits (efficiency) per 1000 screens.
Results: Biennial strategies were consistently the most efficient for average-risk women. Biennial screening from age 50 to 74 years avoided a median of 7 breast cancer deaths versus no screening; annual screening from age 40 to 74 years avoided an additional 3 deaths, but yielded 1988 more false-positive results and 11 more overdiagnoses per 1000 women screened. Annual screening from age 50 to 74 years was inefficient (similar benefits, but more harms than other strategies). For groups with a 2- to 4-fold increased risk, annual screening from age 40 years had similar harms and benefits as screening average-risk women biennially from 50 to 74 years. For groups with moderate or severe comorbidity, screening could stop at age 66 to 68 years.
Limitation: Other imaging technologies, polygenic risk, and nonadherence were not considered.
Conclusion: Biennial screening for breast cancer is efficient for average-risk populations. Decisions about starting ages and intervals will depend on population characteristics and the decision makers' weight given to the harms and benefits of screening.
Primary funding source: National Institutes of Health.
Conflict of interest statement
Potential Conflicts of Interest: None disclosed
Figures
References
-
- Biller-Andorno N, Juni P. Abolishing mammography screening programs? A view from the Swiss Medical Board. N Engl J Med. 2014;370(21):1965–1967. - PubMed
-
- Nystrom L, Andersson I, Bjurstam N, Frisell J, Nordenskjold B, Rutqvist LE. Long-term effects of mammography screening: updated overview of the Swedish randomised trials. Lancet. 2002;359(9310):909–919. - PubMed
-
- Tabar L, Vitak B, Chen HH, Duffy SW, Yen MF, Chiang CF, et al. The Swedish Two-County Trial twenty years later Updated mortality results and new insights from long-term follow-up. Radiol Clin North Am. 2000;38(4):625–651. - PubMed
Publication types
MeSH terms
Grants and funding
LinkOut - more resources
Full Text Sources
Other Literature Sources
Medical