. 2016 Feb 12;55(7):2454-8.
doi: 10.1002/anie.201510411. Epub 2016 Jan 12.

Single-Cell Mass Spectrometry for Discovery Proteomics: Quantifying Translational Cell Heterogeneity in the 16-Cell Frog (Xenopus) Embryo

Affiliations

Single-Cell Mass Spectrometry for Discovery Proteomics: Quantifying Translational Cell Heterogeneity in the 16-Cell Frog (Xenopus) Embryo

Camille Lombard-Banek et al. Angew Chem Int Ed Engl. .

Abstract

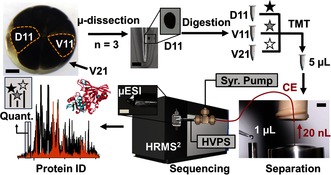
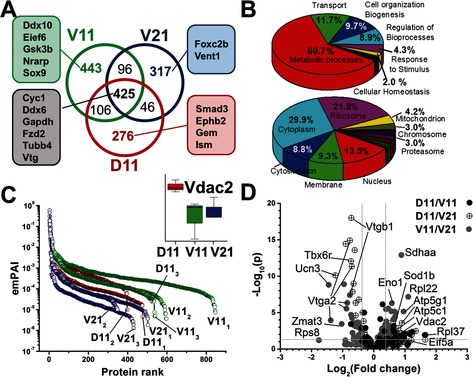
We advance mass spectrometry from a cell population-averaging tool to one capable of quantifying the expression of diverse proteins in single embryonic cells. Our instrument combines capillary electrophoresis (CE), electrospray ionization, and a tribrid ultrahigh-resolution mass spectrometer (HRMS) to enable untargeted (discovery) proteomics with ca. 25 amol lower limit of detection. CE-μESI-HRMS enabled the identification of 500-800 nonredundant protein groups by measuring 20 ng, or <0.2% of the total protein content in single blastomeres that were isolated from the 16-cell frog (Xenopus laevis) embryo, amounting to a total of 1709 protein groups identified between n=3 biological replicates. By quantifying ≈150 nonredundant protein groups between all blastomeres and replicate measurements, we found significant translational cell heterogeneity along multiple axes of the embryo at this very early stage of development when the transcriptional program of the embryo has yet to begin.

Keywords: Xenopus laevis; embryo; mass spectrometry; proteins; single-cell studies.


Figures

Figure 1
Figure 1
Microanalytical pipeline enabling multiplexing proteomic quantification of single embryonic cells in the 16‐cell Xenopus embryo using microdissection, micro‐scale bottom‐up proteomics, and a custom‐built single‐cell CE‐μESI platform for a high‐resolution tandem mass spectrometer (HRMS2). Key: HVPS, high voltage power supply; Syr. Pump, syringe pump. Scale bars: 150 μm (embryo and μESI, left‐middle panels), 250 μm (microcentrifuge vial), 1.5 mm (separation, right panel).
Figure 2
Figure 2
Advancing bottom‐up discovery proteomics to single cells using CE‐μESI‐HRMS. A) Quantification curves for model peptides with 25‐amol lower limit of detection and at least a 3‐log‐order linear dynamic range. B) Evaluation of technical and biological repeatability across a week of measurements. C) Proteomic coverage was enhanced using 20 ng digest by refining sample preparation‐separation (Steps 1–4), peptide sequencing (Steps 5–9), and data analysis (Steps 10–12). Experimental conditions are in Table S2. D) Comparing peptide identifications by CE‐μESI‐HRMS with nanoLC‐nanoESI‐HRMS, the closest neighbor of bottom‐up proteomic technology.
Figure 3
Figure 3
Single‐cell measurements uncovering translational asymmetry in the 16‐cell Xenopus embryo. A) Identification of 1709 different protein groups between D11, V11, and V21 cell types, suggesting proteomic cell differences (see peptide grouping in Figure S3 and proteins in Table S3). B) Gene ontology evaluation of biological processes (top) and sub‐cellular location of identified proteins (bottom). C) Protein abundances covered a 5–6 log‐order dynamic range. Differential expression shown for Vdac2 (Inset). D) Multiplexing quantification for 152 nonredundant protein groups between the D11/V11, D11/V21, and V11/V21 cell types. The volcano plot marks statistical and biological significance (p<0.05, ≥1.3‐fold change) and labels select proteins. Significant protein differences are shown in Figure S4 and listed in Table S5.

References

    1. None
    1. Wang N., Xu M. G., Wang P., Li L., Anal. Chem. 2010, 82, 2262–2271; - PubMed
    1. Altschuler S. J., Wu L. F., Cell 2010, 141, 559–563; - PMC - PubMed
    1. Rubakhin S. S., Romanova E. V., Nemes P., Sweedler J. V., Nat. Methods 2011, 8, S20–S29. - PMC - PubMed
    1. None

Publication types

MeSH terms