. 2016 Aug;44(8):e594-603.
doi: 10.1097/CCM.0000000000001585.

Nonhematopoietic Peroxisome Proliferator-Activated Receptor-α Protects Against Cardiac Injury and Enhances Survival in Experimental Polymicrobial Sepsis

Affiliations

Nonhematopoietic Peroxisome Proliferator-Activated Receptor-α Protects Against Cardiac Injury and Enhances Survival in Experimental Polymicrobial Sepsis

Stephen W Standage et al. Crit Care Med. 2016 Aug.

Abstract

Objectives: Peroxisome proliferator-activated receptor-α is significantly down-regulated in circulating leukocytes from children with sepsis. Peroxisome proliferator-activated receptor-α null (Ppara) mice have greater mortality than wild-type mice when subjected to sepsis by cecal ligation and puncture. We sought to characterize the role of peroxisome proliferator-activated receptor-α in sepsis and to identify the mechanism whereby peroxisome proliferator-activated receptor-α confers a survival advantage.

Design: Prospective randomized preclinical study.

Setting: Laboratory investigation.

Subjects: Male C57Bl/6J and Ppara mice (B6.129S4-Ppara/J), aged 12-16 weeks.

Interventions: Bone marrow chimeric mice were generated and subjected to cecal ligation and puncture. Survival was measured for 7 days. Separate groups of nontransplanted mice underwent cecal ligation and puncture and were euthanized 24 hours later for plasma and tissue analyses.

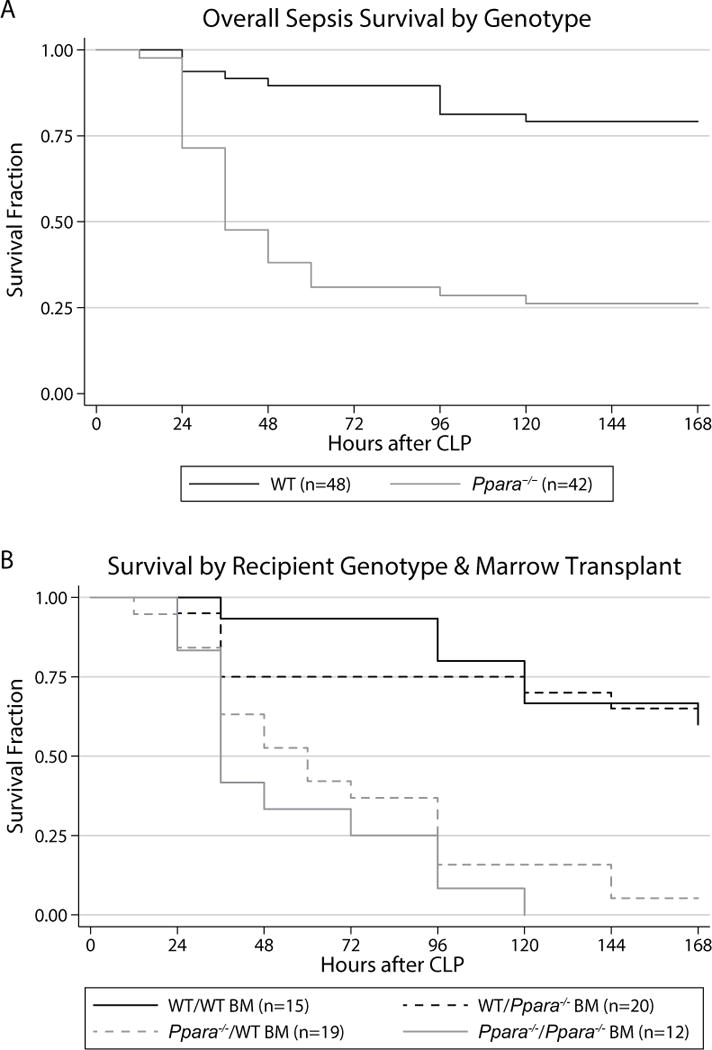
Measurements and main results: Ppara mice had dramatically reduced survival compared with wild-type mice irrespective of the peroxisome proliferator-activated receptor-α status of the bone marrow they received (3% vs 63%; p < 0.0001). No difference in survival was observed between Ppara mice that received wild-type versus Ppara marrow or in wild-type mice receiving wild-type versus Ppara marrow. In septic, nontransplanted mice at 24 hours, Ppara mice had elevated cardiac troponin levels compared with wild-type mice. Cardiac histologic injury scores were greater in Ppara versus wild-type mice. Expression of transcription factors and enzymes related to fatty acid oxidation in the heart were profoundly down-regulated in both wild-type and Ppara mice, but more so in the Ppara mice.

Conclusions: Peroxisome proliferator-activated receptor-α expression in nonhematopoietic tissues plays a critical role in determining clinical outcome in experimental polymicrobial sepsis and is more important to survival in sepsis than hematopoietic peroxisome proliferator-activated receptor-α expression. Cardiac injury due to inadequate energy production from fatty acid substrate is a probable mechanism of decreased survival in Ppara mice. These results suggest that altered peroxisome proliferator-activated receptor-α-mediated cellular metabolism may play an important role in sepsis-related end-organ injury and dysfunction, especially in the heart.


Conflict of interest statement

Conflicts of Interest: The remaining authors declared no conflicts of interest. The remaining authors have disclosed that they do not have any potential conflicts of interest.

Figures

Figure 1
Figure 1
Leukocyte PPARα expression in experimental polymicrobial sepsis. Leukocyte PPARα expression assessed by qRT-PCR is significantly depressed in septic WT mice. Expression is normalized to time 0 (overall p = 0.035 by Kruskal-Wallis; * p = 0.005 on pairwise comparison between times 0 and 72 by Wilcoxon rank-sum, medians 1.0 (IQR 0.026–9.39) and 0.013 (IQR 0.013–0.026) respectively; n = 10–20/group).
Figure 2
Figure 2
Sepsis survival in WT, Ppara/, and chimeric mice. A) Ppara/ mice have much lower survival in CLP induced sepsis than WT mice (27% vs. 72 % respectively, p < 0.0001). Most of the mortality difference occurs between the 24 and 48 hour time points. B) Sepsis survival is not affected by reconstitution with opposite genotype bone marrow in chimeric mice. Irrespective of the type of bone marrow received, Ppara/ recipients had lower survival than WT recipients (p < 0.0001). Ppara/ mice with WT marrow had 5% survival and Ppara/ mice with Ppara/ marrow had 0% survival (p = 0.27). WT mice with WT marrow enjoyed 65% survival while WT mice with Ppara/ marrow had 60% survival (p = 0.90).
Figure 3
Figure 3
Plasma biomarkers of organ injury. Twenty four hours after CLP, median cardiac troponin-I levels were significantly higher in Ppara/ mice compared to WT mice (0.95 ng/mL vs. 0.39 ng/mL respectively, p = 0.0004). BUN was similarly elevated (103 mg/dL in Ppara/ mice vs. 66 mg/dL in WT mice, p = 0.023) and creatinine levels (16.6 mg/dL elevation in Ppara/ mice vs. 7.3 mg/dL in WT mice, p = 0.012). Plasma ALT activity, though elevated in both WT and Ppara/ mice (1.9 mU/mL and 2.2 mU/mL respectively, p = 0.17), did not differ (* p < 0.05, n = 5–10/group).
Figure 4
Figure 4
Histologic severity scoring of heart and kidney tissue 24 hours after CLP. A) Severity scores of heart tissue sections were consistently higher in Ppara/ mice (rank sum 120.5 vs. 15.5, p = 0.0013). WT cardiomyocytes have normal appearance with cross striations and viable nuclei. Ppara/ tissue has multifocal areas where cardiomyocytes are markedly swollen with fragmentation and loss of sarcoplasmic cross striations and karyolytic or absent nuclei, indicative of degeneration and necrosis (arrowheads). Images taken from the left ventricle at 20×, scale = 100 μm. B) Similarly, Ppara/ mice have higher kidney injury scores (rank sum 88.5 vs. 31.5, p = 0.0365). WT renal tubules and glomeruli are within normal limits. Ppara/ mice demonstrate multifocal to regional areas of injury in which renal tubules have swollen, pale epithelial cells, some with pyknotic or karyorrhectic nuclei (degeneration and necrosis). Few tubules also have loss of epithelium and contain luminal sloughed cells and debris (arrows). Adjacent renal tubules appeared normal (asterisk). Images taken from the renal cortex at 20×, scale = 100 μm. (* p < 0.05, n = 5–11/group)
Figure 5
Figure 5
Cardiac gene expression in sepsis. A) Relative PPARα expression levels in WT tissues. PPARα expression decreases at 24 hours in all organs but the lungs (on one-way ANOVA heart p < 0.0001, lung p = 0.448, liver p = 0.018, and kidney p = 0.004; # p < 0.05 for pairwise comparisons with PPARα expression at time 0). PPARα expression is persistently suppressed only in the heart. B) Expression of genes involved in lipid metabolism and transport decrease during sepsis. Expression of these genes is generally much lower in Ppara/ mice than in WT mice. Acadm, Acadvl, and Cpt2 all demonstrated significant (p < 0.05) interaction effects between genotype and time point on analysis by two-way ANOVA. Expression levels of Ppard and Pparg do not change dramatically in sepsis and do not differ significantly between genotypes in most instances (# p < 0.05 for pairwise comparison with same genotype control at time 0, * p < 0.05 for pairwise comparison with WT at the same time point, n = 5–10/group, error bars indicate standard deviation).
Figure 6
Figure 6
Protein levels of FAO enzymes. Protein expression of both ACADM and ACADVL is lower in Ppara/ mice than WT mice at every time point. On the ACADVL immunoblot a nonspecific band (*) appeared at a higher molecular weight than the ACADVL band of interest. Vinculin is displayed as a protein loading control. This is a representative blot of 5 separate experiments (total n = 5 – 10/group).
Figure 7
Figure 7
Blood glucose levels after CLP. Glucose levels are similar between genotypes at baseline (208 vs 204 mg/dL, p = 0.7084). After CLP-induced sepsis, levels drop in both WT and in Ppara/ mice, but are lower in Ppara/ mice (78 vs. 53 mg/dL respectively, p = 0.0018) (* p < 0.05., n = 9–14/group, error bars indicate standard deviation).

Comment in

References

    1. Angus DC, van der Poll T. Severe Sepsis and Septic Shock. N Engl J Med. 2013;369:840–851. - PubMed
    1. Hartman ME, Linde-Zwirble WT, Angus DC, et al. Trends in the epidemiology of pediatric severe sepsis*. Pediatr Crit Care Med. 2013;14:686–693. - PubMed
    1. Lagu T, Rothberg MB, Shieh M-S, et al. Hospitalizations, costs, and outcomes of severe sepsis in the United States 2003 to 2007. Crit Care Med. 2012;40:754–761. - PubMed
    1. Ruth A, McCracken CE, Fortenberry JD, et al. Pediatric severe sepsis: current trends and outcomes from the pediatric health information systems database*. Pediatr Crit Care Med. 2014;15:828–838. - PubMed
    1. Angus DC. The search for effective therapy for sepsis: back to the drawing board? JAMA. 2011;306:2614–2615. - PubMed

Publication types

MeSH terms