. 2016 Jan 12:18:8.
doi: 10.1186/s13075-015-0909-6.

The CII-specific autoimmune T-cell response develops in the presence of FTY720 but is regulated by enhanced Treg cells that inhibit the development of autoimmune arthritis

Affiliations

The CII-specific autoimmune T-cell response develops in the presence of FTY720 but is regulated by enhanced Treg cells that inhibit the development of autoimmune arthritis

David C Miller et al. Arthritis Res Ther. .

Abstract

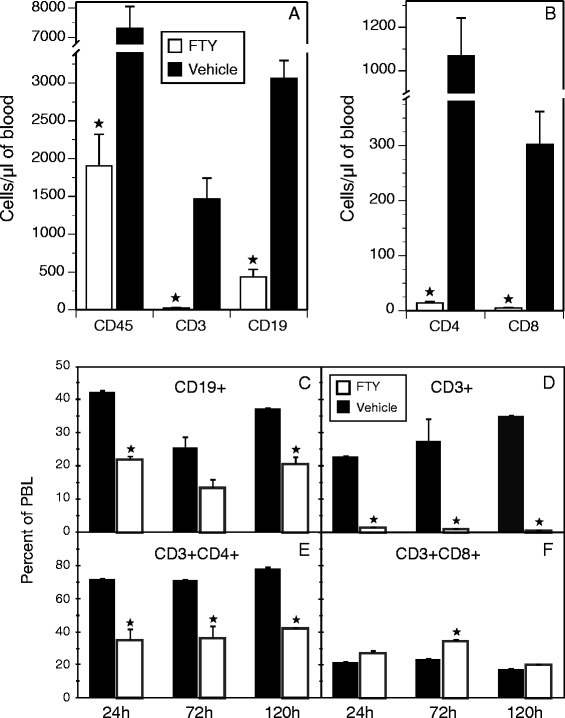
Background: Fingolimod (FTY720) is an immunomodulating drug that inhibits sphingosine-1-phosphate binding and blocks T-cell egress from lymph nodes. We analyzed the effect of FTY720 on the autoimmune T- and B-cell response in autoimmune arthritis and studied the mechanisms by which it alters the function of T cells.

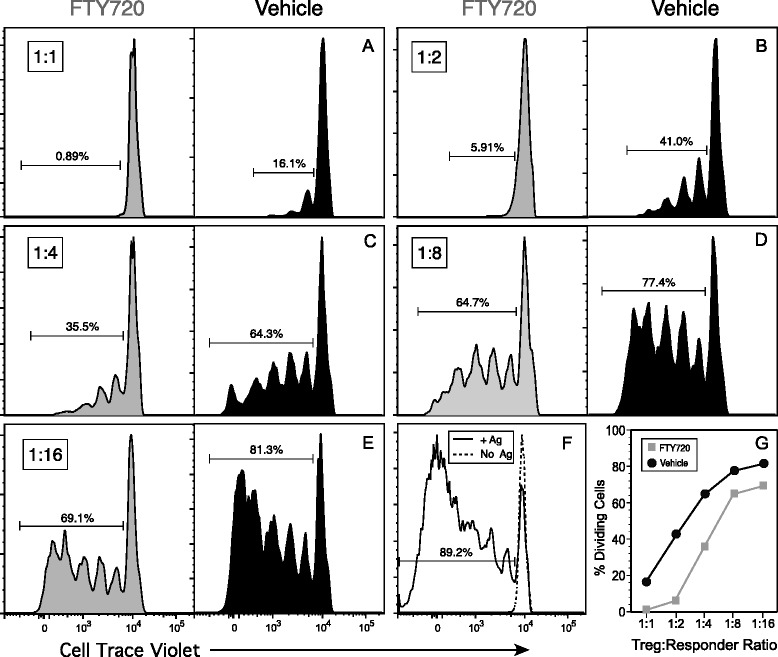
Methods: Human leukocyte antigen (HLA)-DR1 humanized mice were immunized with type II collagen (CII) and treated with FTY720 three times per week for 3 weeks. Arthritis was evaluated and autoimmune T- and B-cell responses were measured using proliferation assays, enzyme-linked immunosorbent assays, HLA-DR tetramers, and flow cytometry. The functional capacity of regulatory T (Treg) cells from FTY720-treated mice was measured using an in vitro suppression assay, and the role of Treg cells in inhibiting arthritis in FTY720-treated mice was evaluated using mice treated with anti-CD25 to deplete Treg cells.

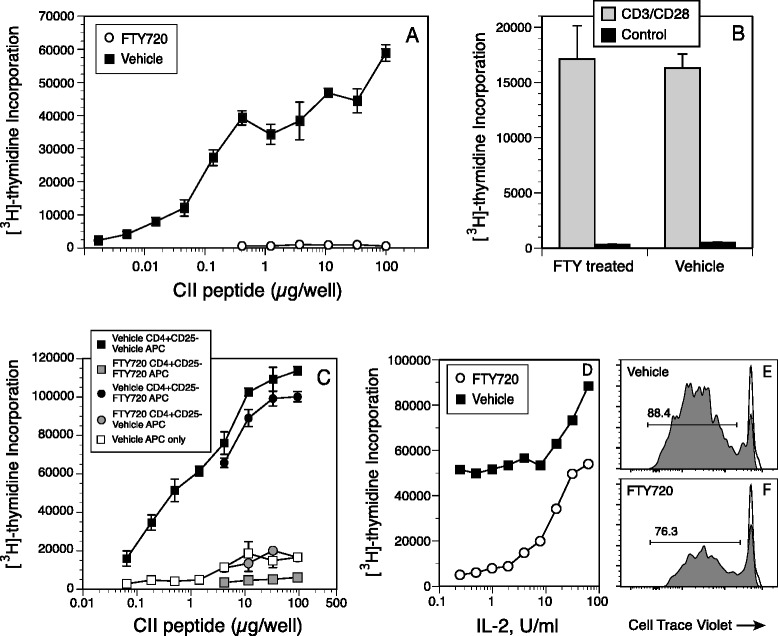
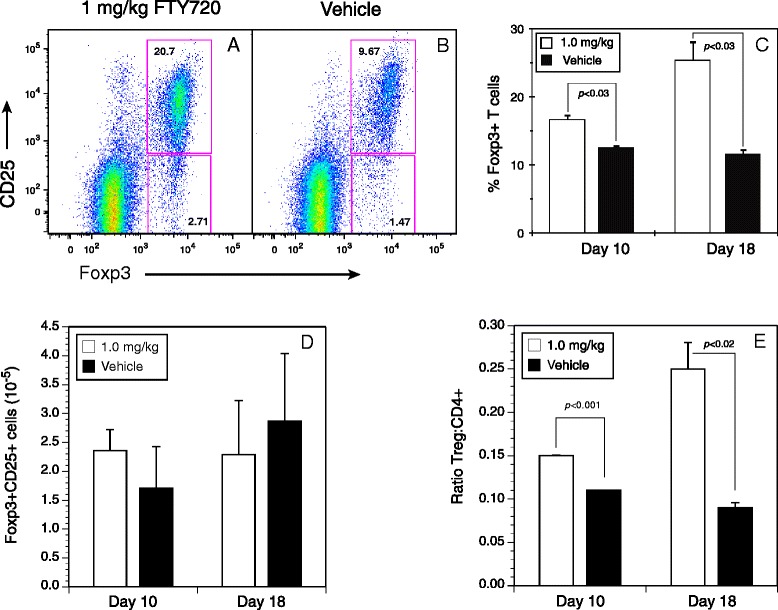
Results: Treatment with FTY720 delayed the onset of arthritis and significantly reduced disease incidence. FTY720 did not prevent the generation of a CII-specific autoimmune T-cell response in vivo. However, as the treatment continued, these T cells became unresponsive to restimulation with antigen in vitro, and this anergic state was reversed by addition of interleukin 2. Measurements of CD4(+)CD25(+)Foxp3(+) cells in the lymph nodes revealed that the ratio of Treg to helper T (Th) cells increased twofold in the FTY720-treated mice, and in vitro assays indicated that the regulatory function of these cells was enhanced. That FTY720 stimulation of Treg cells played a major role in arthritis inhibition was demonstrated by a loss of disease inhibition and restitution of the T-cell proliferative function after in vivo depletion of the Treg cells.

Conclusions: While FTY720 affects the recirculation of lymphocytes, its ability to inhibit the development of autoimmune arthritis involves several mechanisms, including the enhancement of Treg cell function by increasing the Treg/Th ratio and increased regulatory function on a per-cell basis. FTY720 did not inhibit the development of the autoimmune T-cell response, but disease inhibition appeared to be mediated by Treg cell-mediated suppression of the CII-specific T cells. These data suggest that specific targeting of Treg cells with FTY720 may be a novel therapy for autoimmunity.


Figures

Fig. 1
Fig. 1
Treatment of mice with FTY720 reduces incidence and severity of autoimmune arthritis. DR1 transgenic mice were immunized subcutaneously with 100 μg of type II collagen (CII) emulsified in complete Freund’s adjuvant, and they were given intraperitoneal injections of FTY720 or vehicle control three times per week for 3 weeks starting on the day of immunization (day 0), for a total of nine injections. a FTY720 at 1.0 mg/kg (open circles) and 0.2 mg/kg (gray circles) delayed the onset of disease (mean day 33 for control and days 40 and 42 for FTY720 groups; p < 0.03 for both groups) and reduced the disease incidence (p < 0.05 for days 30 through 40 for 1 mg/kg group, indicated by closed stars) in comparison to the vehicle control group (closed circles; n = 11 for each group). b Both doses of FTY720 reduced the number of arthritic limbs observed per arthritic mouse. Closed stars indicate p < 0.05. c Both doses of FTY720 reduced the mean arthritic score per arthritic mouse. Closed stars indicate p < 0.05. d FTY720 treatment reduced the production of CII-specific autoantibody. Antibody concentrations in sera obtained from the mice at days 30 and 50 after immunization were measured using a bead-based enzyme-linked immunosorbent assay, and antibody concentrations were calculated using a CII-specific antibody standard. Closed stars indicate p < 0.05; error bars indicate standard deviation
Fig. 2
Fig. 2
FTY720 (FTY) treatment alters the number and ratio of lymphocyte populations in the peripheral blood of type II collagen–immunized mice. Peripheral blood lymphocytes (PBLs) were recovered from mice treated with FTY720 at 24 h, 72 h, and 120 h after a single 1 mg/kg treatment, and the cells were stained with antibodies specific for CD19, CD3, CD4, and CD8. All data were gated on the basis of live cells (4′,6-diamidino-2-phenylindole–negative) and forward versus side scatter to identify the lymphoid population. The CD4+ and CD8+ populations were generated as subpopulations of CD3+ cells. a and b The number of cells per microliter of blood was determined by adding CountBright beads to the samples before analyses, as described in the Methods section. Closed stars in (a) indicate statistically significant changes (p < 0.01). cf Change in the subpopulation distribution of B cells and T cells in the peripheral blood. Antibody staining and analysis of the flow cytometry data were done as indicated in each panel, with statistically significant differences of p < 0.05 denoted by closed stars. Open bars indicate 1.0 mg/kg FTY720 treatment, and closed bars represent vehicle control. Error bars depict standard deviations
Fig. 3
Fig. 3
FTY720 treatment alters the total cell number and ratio of lymphocyte populations in the draining lymph nodes (LNs) of type II collagen–immunized mice. Cells were recovered from draining LNs after immunization and nine treatments with FTY720 as described in the Fig. 1 legend. The number of cells in the LNs of FTY720-treated mice was significantly lower than the number found in the LNs of controls (a). The ratios of B-cell and T-cell subpopulations in the LNs (b and c) were statistically different between FTY720-treated and control mice, although the differences were significantly less than the differences observed in the peripheral blood. Antibody staining, measurement of cell numbers, and data analysis were performed as described in the Fig. 2 legend. Closed stars indicate statistically significant differences (p < 0.05). Open bars indicate 1.0 mg/kg FTY720 treatment, and closed bars represent vehicle control. Error bars indicate standard deviation
Fig. 4
Fig. 4
Ex vivo analysis of the effect of FTY720 on the type II collagen (CII)-specific T-cell response. Mice were immunized with CII and complete Freund’s adjuvant and treated with FTY720 (1.0 mg/kg or 0.2 mg/kg) or vehicle, or they were not immunized and not treated (naive). Lymph node cells recovered from the mice treated with FTY720 or vehicle (ac) or from naive mice (d) were stained with a DR1-CII tetramer and antibodies specific for CD19, CD3, CD4, CD8, CD25, and CD62L, and the cells were analyzed by flow cytometry. The mean percentage of CD4+/tetramer-positive, CII-specific T cells in the lymph nodes is shown in (e), and the number of CII-specific T cells present in the lymph nodes as determined by tetramer staining and cell counts is shown in (f). The expression of CD25 and CD62L by the tetramer-positive cells in the FTY720 and control groups as determined by flow cytometry is shown in (g) and (h). Data were generated by sequential gating on 4′,6-diamidino-2-phenylindole–negative cells, forward versus side scatter, CD19 and CD8 cells, and CD3+CD4+ cells. The tetramer-positive cells in (ae) are shown as the percentage of CD3+CD4+ T cells, and this percentage value was used to calculate the total number of CII-specific T cells shown in (f). Open bars indicate mice treated with 1.0 mg/kg FTY720, gray bars represent mice treated with 0.2 mg/kg, and closed bars indicate the vehicle control group. Error bars indicate standard deviation, and p values indicate statistically significant differences between treatment groups and vehicle groups
Fig. 5
Fig. 5
Proliferative response of type II collagen (CII)-specific T cells recovered from mice treated with FTY720 (FTY). Total lymphocytes or CD4+CD25 T cells were recovered from draining lymph nodes of CII-immunized mice treated with 1 mg/kg of FTY720 or vehicle and cultured in the presence of the CII257–274 peptide for 4 days. [3H]thymidine was added to the cultures on day 3, and cells were harvested on the following day. Controls were unstimulated cells. Error bars indicate standard deviation. a In vitro proliferative response of lymph node cells from DR1 transgenic mice immunized with CII and treated with 1.0 mg/kg FTY720 or vehicle three times per week for 3 weeks. b Lymph node cells from mice treated with 1.0 mg/kg FTY720 or vehicle were stimulated in vitro with anti-CD3/anti-CD28 antibodies (Ab). c Proliferative response of CD4+CD25 lymph node cells from CII-immunized mice treated with 1.0 mg/kg FTY720 or vehicle. CD4+CD25 T cells were purified using magnetic bead separation and mixed with antigen-presenting cells depleted of CD4+ cells recovered from the spleens of FTY720- or vehicle-treated mice. d Addition of interleukin (IL)-2 to cultures of T cells from mice treated with FTY720 restored the CII-stimulated proliferative response. e and f DR1-CII tetramer analyses of the proliferative response shown in (d). Lymph node cells from FTY720- or vehicle-treated mice immunized with CII were labeled with CellTrace Violet, placed in culture, and stimulated with the CII peptide. After 3 days, cells were recovered and stained with DR1-CII tetramer; antibodies to CD3, CD4, and CD8; and 4′,6-diamidino-2-phenylindole (DAPI). Data shown are the percentages of CD4+ DR1-CII tetramer-positive cells in cellular division as indicated by the loss of CellTrace Violet fluorescence. Data were sequentially gated on DAPI, CD3+, and CD8 cells. Gray histograms are the CD4+ DR1-CII tetramer-positive cells, and open histograms are derived from CellTrace Violet–labeled cells that were not stimulated to divide
Fig. 6
Fig. 6
The ratio of regulatory T (Treg) cells to helper T cells is increased in lymph nodes of FTY720-treated mice. Lymph node cells from DR1 transgenic mice immunized with type II collagen and treated with FTY720 or vehicle three times per week (total of eight doses) were recovered on day 17 and stained with antibodies specific for CD4, CD8, CD19, CD3, CD25, and Foxp3, and they were analyzed by flow cytometry. a and b Representative scatterplots (1 mg/kg FTY720 and vehicle control, respectively) of data from at least three repeat experiments, summarized in (c). Open bars indicate 1.0 mg/kg FTY720, and closed bars represent 1.0 mg/kg vehicle control. The number of Treg cells per lymph node shown in (d) was determined using CountBright beads as described in the Methods section. The differences observed were not statistically significant. The ratio of Treg cells to CD4+ cells shown in (e) was calculated by dividing the number of both cell populations measured using the CountBright beads. Flow cytometry data shown were derived from sequential gating on live cells (4′,6-diamidino-2-phenylindole–negative), forward versus side scatter, CD8 and CD19, CD3+, and CD4+ cells. Error bars indicate standard deviation
Fig. 7
Fig. 7
Functional analysis of the regulatory T (Treg) cells recovered from mice treated with FTY720. DR1 transgenic mice were immunized with type II collagen (CII) and treated three times per week (total of eight doses) with 1.0 mg/kg of FTY720 or vehicle. On day 17, CD4+CD25+ Treg cells were recovered from the spleens of these mice using magnetic bead selection, and they were tested for their ability to inhibit a CII-specific T-cell proliferative response. ae Responder T cells from naive mice were labeled with CellTrace Violet and cocultured with the Treg cells at ratios ranging from 1:1 to 1:16 (Treg/responder) in the presence of 10 μg of CII257–274 peptide. After 3 days of culture, cells were collected and stained with antibodies specific for CD3, CD4, CD8, and CD19 and analyzed by flow cytometry. Data shown are based on sequential gating of live cells (4′,6-diamidino-2-phenylindole–negative), forward versus side scatter, CD8 and CD19, CD3+, and CD4+ cells. Histograms indicate generation of T-cell division by dilution of the CellTrace Violet label, and gates indicate percentage of responder T cells that were in division. f T-cell proliferation with peptide added and no Treg cells added (positive control, solid line), and T cells with no Treg cells and no peptide (negative control, dotted line). g Summary of percentage of cells dividing at each of the responder/Treg ratios. Data are representative of three independent experiments
Fig. 8
Fig. 8
Depletion of CD25+ regulatory T (Treg) cells reduces the inhibitory effect of FTY720 on the development of autoimmune arthritis and restores the type II collagen (CII)-specific T-cell response. Mice were immunized with CII on day 0 and split into four groups for treatment: (1) FTY720 + anti-CD25 antibody (Ab), (2) vehicle + anti-CD25 antibody, (3) FTY720 + control antibody (MOPC 167), and (4) vehicle + control antibody. Two days before immunization with CII, mice were treated with 250 μg of antibody (anti-CD25 or control), and antibody treatments were continued for 3 weeks with one treatment per week. a Representative data show that anti-CD25 treatment in the Treg cell population significantly depleted the CD25+Foxp3+ population in the peripheral blood and lymph nodes, and also significantly reduced the number of Foxp3+ cells in the lymph nodes. Starting at the time of immunization, mice were treated with FTY720, and treatment was continued three times per week for a total of nine doses. b Mice were scored three times per week for arthritis starting on day 18 after immunization. Data shown were derived from two separate experiments and normalized to the first day of disease onset for each experiment. The asterisks indicate statistically significant differences in arthritis incidence between the FTY720 + anti-CD25 group and the FTY720 + control Ab group in the study (p < 0.04 by χ2 test). c CII-specific proliferative response of T cells from the mice presented in (b). On day 17 after immunization, cells from draining lymph nodes were placed in culture and restimulated with the CII257–274 peptide. Proliferation was measured by [3H]thymidine incorporation, and data are representative of two experiments. Error bars indicate standard deviation

Similar articles

Cited by

References

    1. Noack M, Miossec P. Th17 and regulatory T cell balance in autoimmune and inflammatory diseases. Autoimmun Rev. 2014;13:668–677. doi: 10.1016/j.autrev.2013.12.004. - DOI - PubMed
    1. Oda JM, Hirata BK, Guembarovski RL, Watanabe MA. Genetic polymorphism in FOXP3 gene: imbalance in regulatory T-cell role and development of human diseases. J Genet. 2013;92:163–171. doi: 10.1007/s12041-013-0213-7. - DOI - PubMed
    1. Fontenot JD, Gavin MA, Rudensky AY. Foxp3 programs the development and function of CD4+CD25+ regulatory T cells. Nat Immunol. 2003;4:330–336. doi: 10.1038/ni904. - DOI - PubMed
    1. Torgerson TR, Ochs HD. Immune dysregulation, polyendocrinopathy, enteropathy, X-linked syndrome: a model of immune dysregulation. Curr Opin Allergy Clin Immunol. 2002;2:481–487. doi: 10.1097/00130832-200212000-00002. - DOI - PubMed
    1. Bennett CL, Christie J, Ramsdell F, Brunkow ME, Ferguson PJ, Whitesell L, et al. The immune dysregulation, polyendocrinopathy, enteropathy, X-linked syndrome (IPEX) is caused by mutations of FOXP3. Nat Genet. 2001;27:20–21. doi: 10.1038/83713. - DOI - PubMed

Publication types

MeSH terms