. 2016 Aug;124(8):1214-26.
doi: 10.1289/ehp.1510352. Epub 2016 Jan 13.

On the Utility of ToxCast™ and ToxPi as Methods for Identifying New Obesogens

Affiliations

On the Utility of ToxCast™ and ToxPi as Methods for Identifying New Obesogens

Amanda Shaine Janesick et al. Environ Health Perspect. 2016 Aug.

Abstract

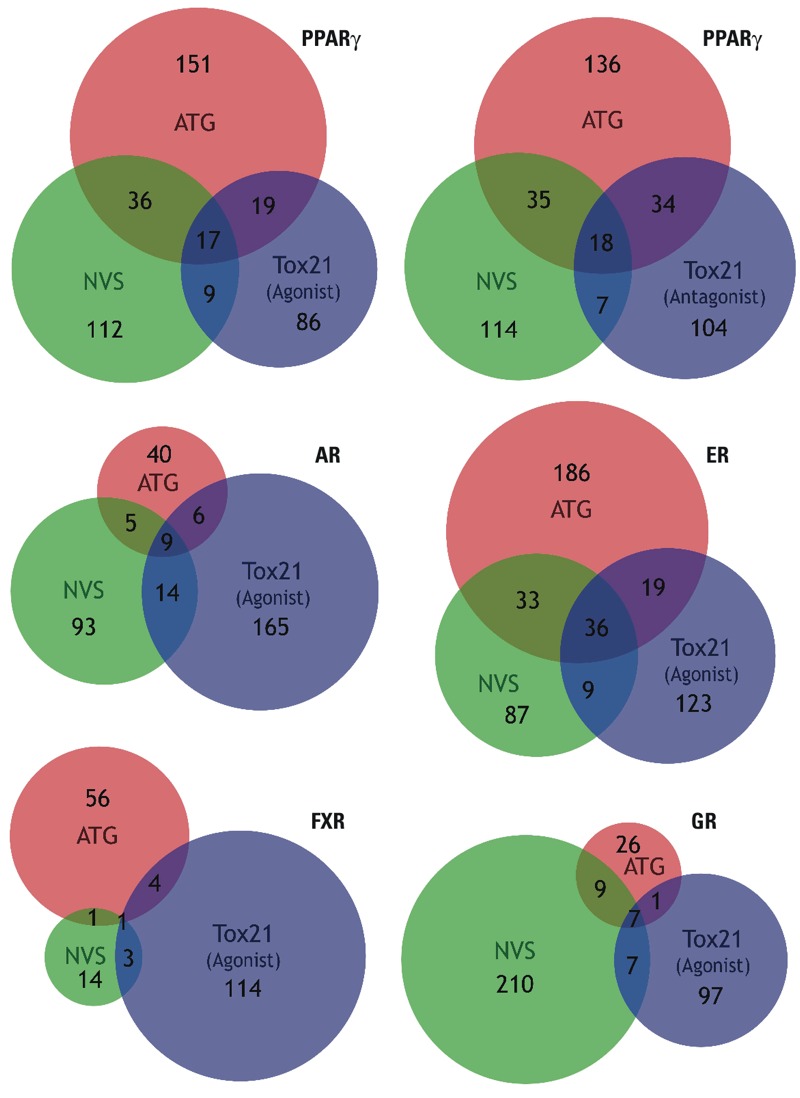
Background: In ToxCast™ Phase I, the U.S. EPA commissioned screening of 320 pesticides, herbicides, fungicides, and other chemicals in a series of high-throughput assays. The agency also developed a toxicological prioritization tool, ToxPi, to facilitate using ToxCast™ assays to predict biological function.

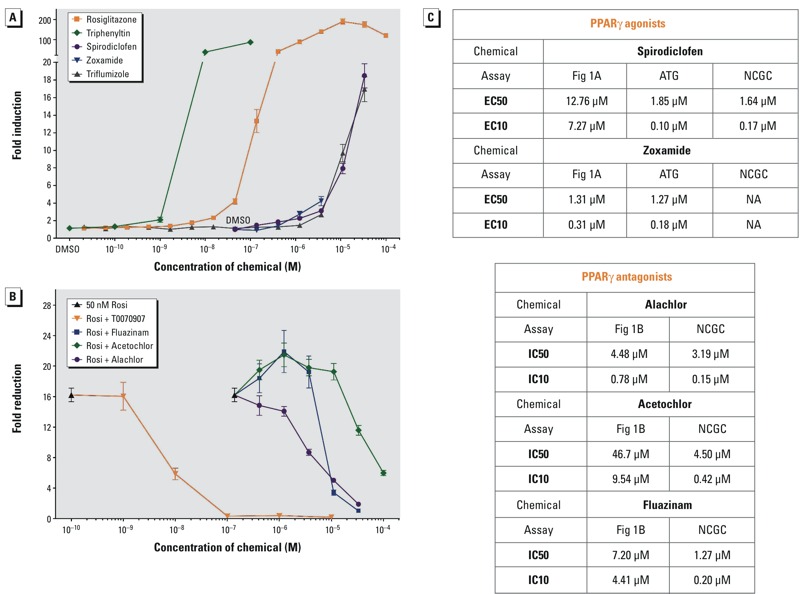
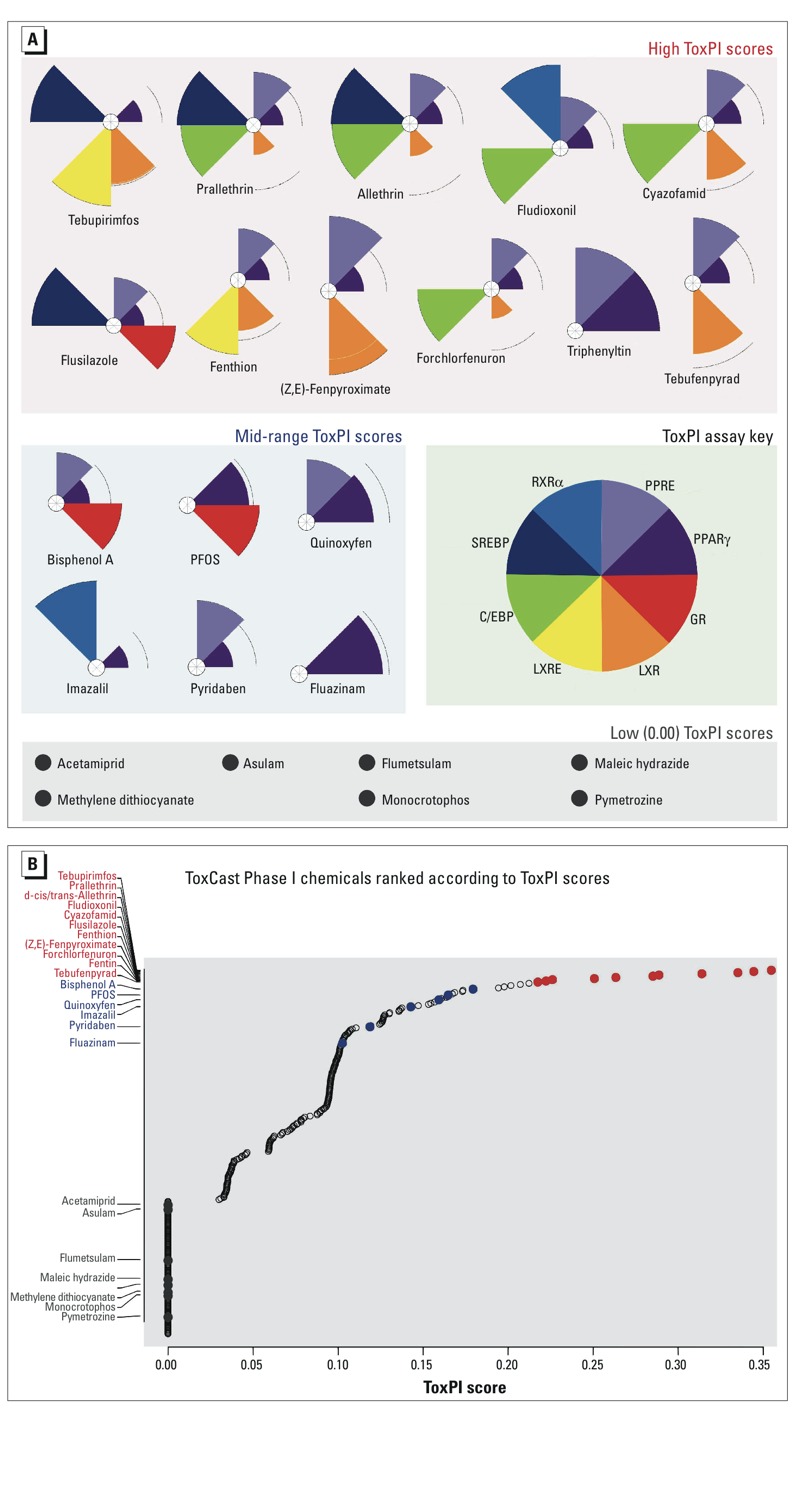
Objectives: We asked whether top-scoring PPARγ activators identified in ToxCast™ Phase I were genuine PPARγ activators and inducers of adipogenesis. Next, we identified ToxCast™ assays that should predict adipogenesis, developed an adipogenesis ToxPi, and asked how well the ToxPi predicted adipogenic activity.

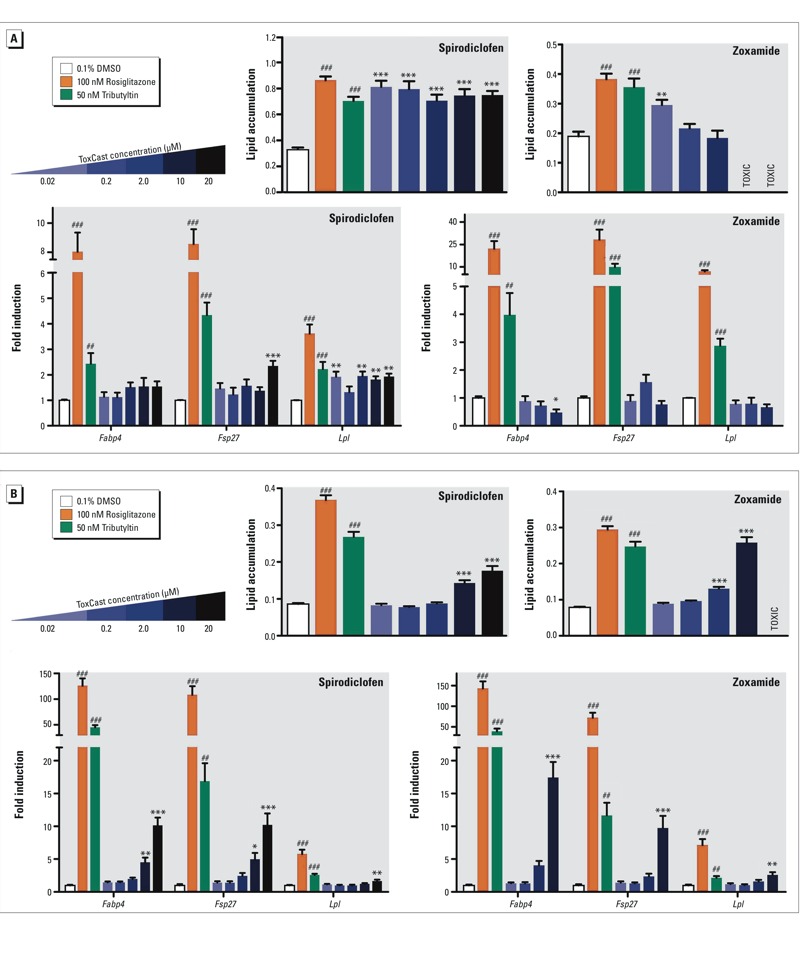
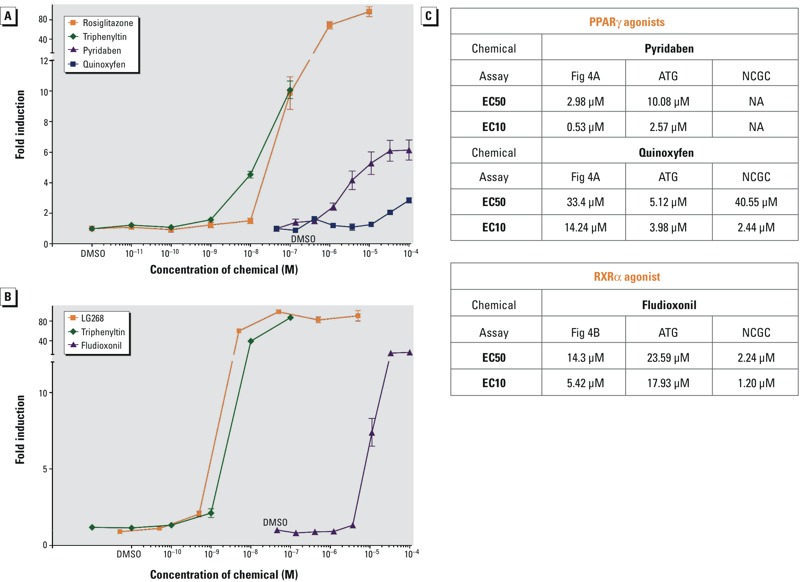
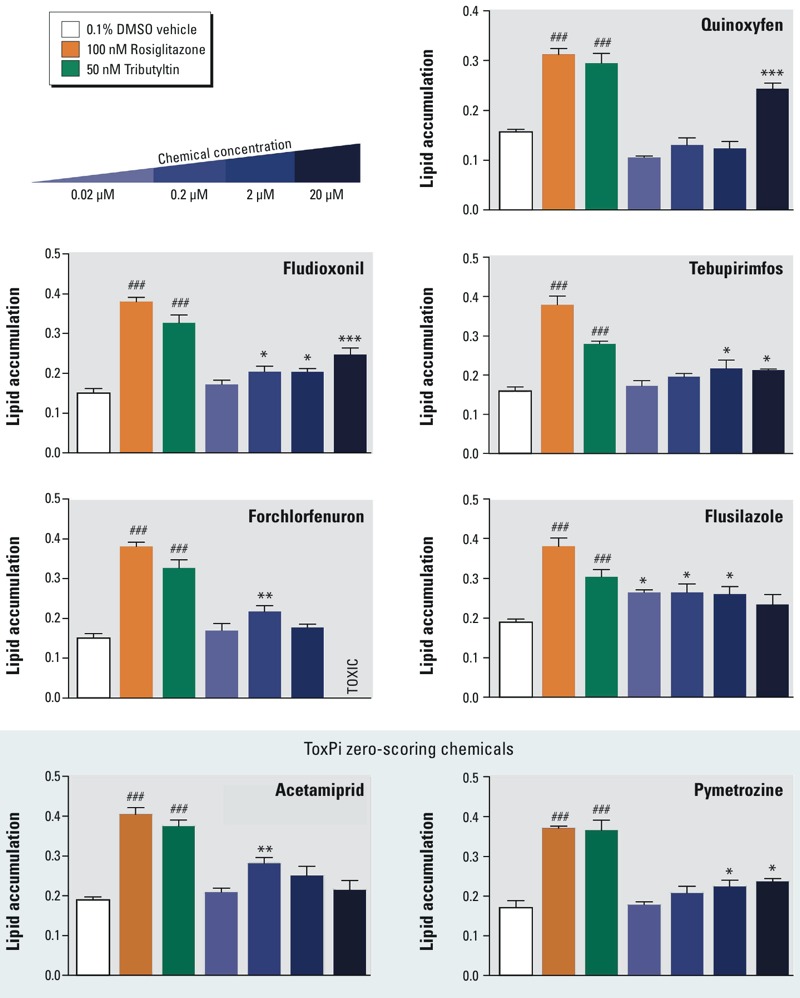
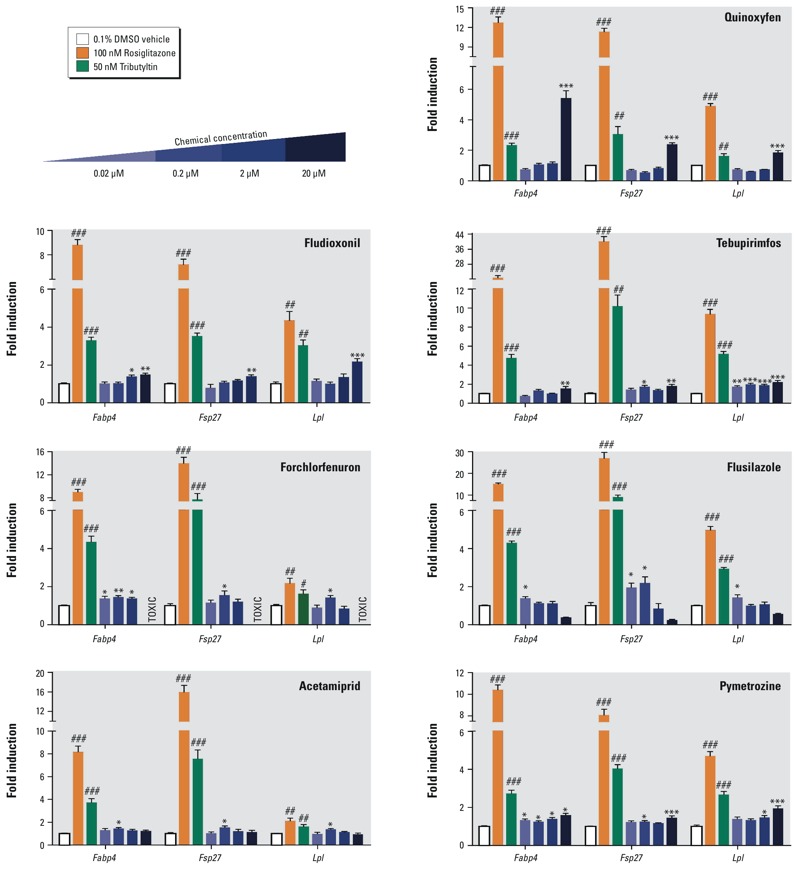
Methods: We used transient transfection to test the ability of ToxCast™ chemicals to modulate PPARγ and RXRα, and differentiation assays employing 3T3-L1 preadipocytes and mouse bone marrow-derived mesenchymal stem cells (mBMSCs) to evaluate the adipogenic capacity of ToxCast™ chemicals.

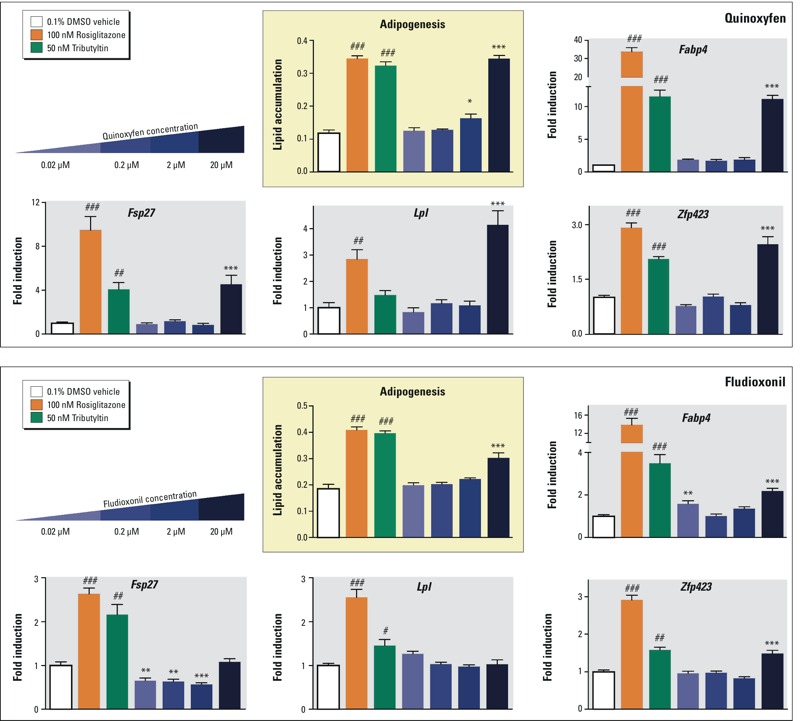
Results: Only 5/21 of the top scoring ToxCast™ PPARγ activators were activators in our assays, 3 were PPARγ antagonists, the remainder were inactive. The bona fide PPARγ activators we identified induced adipogenesis in 3T3-L1 cells and mBMSCs. Only 7 of the 17 chemicals predicted to be active by the ToxPi promoted adipogenesis, 1 inhibited adipogenesis, and 2 of the 7 predicted negatives were also adipogenic. Of these 9 adipogenic chemicals, 3 activated PPARγ, and 1 activated RXRα.

Conclusions: ToxCast™ PPARγ and RXRα assays do not correlate well with laboratory measurements of PPARγ and RXRα activity. The adipogenesis ToxPi performed poorly, perhaps due to the performance of ToxCast™ assays. We observed a modest predictive value of ToxCast™ for PPARγ and RXRα activation and adipogenesis and it is likely that many obesogenic chemicals remain to be identified.

Citation: Janesick AS, Dimastrogiovanni G, Vanek L, Boulos C, Chamorro-García R, Tang W, Blumberg B. 2016. On the utility of ToxCast™ and ToxPi as methods for identifying new obesogens. Environ Health Perspect 124:1214-1226; http://dx.doi.org/10.1289/ehp.1510352.


Conflict of interest statement

The other authors declare they have no actual or potential competing financial interests.

Figures

Figure 1
Figure 1
ToxCast Chemical Activity on PPARγ. The ability of a graded dose series of ToxCast chemicals to (A) activate or (B) antagonize GAL4-mPPARγ was tested in transiently transfected COS7 cells. (A, B) Data points are averages of triplicate transfections (three biological replicates). Cytotoxicity, as measured by decreased β-galactosidase activity was observed at 100 μM for spirodiclofen, triflumizole, alachlor, and fluazinam, ≥ 10 μM for zoxamide, and ≥ 1 μM for tri­phenyltin. Data are depicted as (A) fold induction or (B) reduction over vehicle (0.05% DMSO) controls ± SEM. (A) ToxCast chemicals were tested in 3-fold serial dilutions from 100 μM through 0.137 μM, with the final data point being 0.05% DMSO. Rosiglitazone serves as a positive control activator. (B) ToxCast chemicals were tested in 3-fold serial dilutions from 100 μM, in competition with 50 nM rosiglitazone (Rosi). T0070907 (2-chloro-5-nitro-N-4-pyridinylbenzamide) serves as a positive control PPARγ antagonist. (C) EC50, EC10, IC50, and IC10 values calculated from A and B are reported and compared to commercial assays (see Figure S1). Note: ATG, Attagene GAL-PPARγ activation assay; NCGC, GeneBLAzer® agonist (EC values) or antagonist (IC values) assays. Triphenyltin was previously published (Kanayama et al. 2005).
Figure 2
Figure 2
ToxCast chemicals zoxamide and spirodiclofen induce adipogenesis in 3T3-L1 cells and mouse bone marrow-derived mesenchymal stem cells (mBMSCs). Adipogenesis was induced in cells according to Figure S2. Lipid accumulation was quantified in differentiated (A) 3T3-L1 preadipocytes or (B) mBMSCs by measuring Nile red fluorescence normalized by cell number (Hoechst). Rosiglitazone and tributyltin serve as positive control adipogenic chemicals. Gene expression was determined by the 2 ΔΔ CT method using 36b4 as the reference gene. Data are reported as fold induction over 0.1% DMSO vehicle controls ± SEM using standard propagation of error. Primer sequences can be found in Table S4. One-way ANOVA was conducted for zoxamide and spirodiclofen treatment groups and DMSO vehicle, followed by Dunnett’s post hoc test: *p ≤ 0.05, **p ≤ 0.01, ***p ≤ 0.001 compared to vehicle. Unpaired t-test was conducted for the positive controls rosiglitazone, tributyltin versus vehicle: # p ≤ 0.05, ## p ≤ 0.01, ### p ≤ 0.001.
Figure 3
Figure 3
Selection of ToxPi Chemicals for Adipogenesis Assays. (A) Adipogenesis ToxPi where slice size (magnitude) represents the activity of a ToxCast chemical in a particular assay or collection of assays (see the assays that comprise each slice in Table S1 and the AC50 values associated with these assays in Table S3). PPRE, Attagene cis-PPRE reporter gene assay; PPARγ, Attagene and NCGC trans-PPARγ reporter gene assay and NovaScreen® hPPARγ direct binding assay; GR, Attagene cis-GRE, trans-GR, and NCGC trans-GR reporter gene assay, and NovaScreen® hGR direct binding assay; LXR, Attagene trans-LXRα, trans-LXRβ and NCGC trans-LXRβ reporter gene assay; LXRE, Attagene cis-LXRE reporter gene assay; C/EBP, Attagene cis-C/EBP reporter gene assay; SREBP, Attagene cis-SREBP reporter gene assay; RXRα, Attagene and NCGC trans-RXRα reporter gene assay. Highest scoring ToxPi chemicals are predicted to be obesogenic. (B) Plot of the ToxPi scores for all Phase I ToxCast chemicals. Red data points are selected high-scoring chemicals. Blue data points are selected medium-scoring chemicals. Grey data points are selected zero-scoring chemicals. Black open circles are chemicals not tested in our adipogenesis assays. PFOS, perfluorooctanesulfonic acid.
Figure 4
Figure 4
ToxPi Chemical Activity on PPARγ and RXRα. The ability of a graded dose series of ToxPi chemicals to activate (A) GAL4-mPPARγ or (B) GAL4-hRXRα was tested in transiently transfected COS7 cells. (AB) Data points are averages of triplicate transfections (three biological replicates). Cytotoxicity, as measured by decreased β-galactosidase activity was observed at 1 μM for triphenyltin. ToxPi chemicals were tested in 3-fold serial dilutions from 100 μM through 0.137 μM, with the final data point being 0.05% DMSO. Data are depicted as fold induction over vehicle (0.05% DMSO) controls ± SEM. (A) Rosiglitazone serves as a positive control activator for GAL4-mPPARγ. (B) LG100268 (2-[1-(3,5,5,8,8-Pentamethyl-5,6,7,8-tetrahydro-2-naphthyl)cyclopropyl]pyridine-5-carboxylic acid) serves as a positive control activator for GAL4-hRXRα. (C) EC50 and EC10 values calculated from A and B are reported and compared to other assays (see Figure S1). ATG, Attagene GAL-PPARγ or GAL-RXRα activation assay; NCGC, GeneBLAzer® GAL-PPARγ or GAL-RXRα activation assays. Triphenyltin was previously published (Kanayama et al. 2005).
Figure 5
Figure 5
ToxPi chemicals induce adipogenesis in 3T3-L1 preadipocytes. Adipogenesis was induced in 3T3-L1 cells according to Figure S2. 3T3-L1 cells were exposed to adipogenic cocktail for 2 days, then exposed to the test chemicals for 5 days. Differentiated cells were fixed and stained with Nile red and Hoechst 33342. Lipid accumulation was quantified in cells by measuring Nile red fluorescence normalized by cell number (Hoechst). Rosiglitazone and tributyltin serve as positive control adipogenic chemicals. One-way ANOVA was conducted for ToxPi chemical treatment groups and DMSO vehicle, followed by Dunnett’s post hoc test: *p ≤ 0.05, **p ≤ 0.01, ***p ≤ 0.001 compared to vehicle. Unpaired t-test was conducted for the positive controls rosiglitazone, tributyltin versus vehicle: ### p ≤ 0.001.
Figure 6
Figure 6
ToxPi chemicals induce adipogenic gene expression in 3T3-L1 preadipocytes. Adipogenesis was induced in 3T3-L1 cells according to Figure S2. 3T3-L1 cells were exposed to adipogenic cocktail for 2 days, then exposed to the test chemicals for 5 days. 3T3-L1 cells were homogenized in TriPure, total RNA was isolated, reverse transcribed, and QPCR was performed. Gene expression was determined by the 2 ΔΔ CT method using 36b4 as the reference gene. Data are reported as fold induction over 0.1% DMSO vehicle controls ± S.E.M using standard propagation of error. Primer sequences can be found in Table S4. One-way ANOVA was conducted for ToxPi treatment groups and DMSO vehicle, followed by Dunnett’s post hoc test: *p ≤ 0.05, **p ≤ 0.01, ***p ≤ 0.001 compared to vehicle. Unpaired t-test was conducted for the positive controls ROSI, TBT versus vehicle: # p ≤ 0.05, ## p ≤ 0.01, ### p ≤ 0.001.
Figure 7
Figure 7
ToxPi chemicals quinoxyfen and fludioxonil induce adipogenesis in mBMSCs. Adipogenesis was induced in mouse bone marrow derived mesenchymal stem cells (mBMSCs) according to Figure S2. mBMSCs were exposed to adipogenic cocktail plus test chemicals or positive controls for 14 days. Differentiated cells were fixed and stained with Nile red and Hoechst 33342. Lipid accumulation was quantified in differentiated cells by measuring Nile red fluorescence normalized by cell number (Hoechst). Rosiglitazone (ROSI) and tributyltin (TBT) serve as positive control adipogenic chemicals. mBMSCs were homogenized in TriPure, total RNA was isolated, reverse transcribed, and QPCR was performed. Gene expression was determined by the 2 ΔΔ CT method using 36b4 as the reference gene. Data are reported as fold induction over 0.1% DMSO vehicle controls ± S.E.M using standard propagation of error. Primer sequences can be found in Table S4. One-way ANOVA was conducted for ToxPi chemical treatment groups and DMSO vehicle, followed by Dunnett’s post hoc test: *p ≤ 0.05, **p ≤ 0.01, ***p ≤ 0.001 compared to vehicle. Unpaired t-test was conducted for the positive controls rosiglitazone, tributyltin versus vehicle: # p ≤ 0.05, ## p ≤ 0.01, ### p ≤ 0.001.
Figure 8
Figure 8
Venn diagrams comparing three main nuclear receptor commercial assays employed in ToxCast™. Phase II, release 2014 (Filer et al. 2014) assay datasets (gain AC50 values) were obtained for five nuclear receptors: PPARγ, androgen receptor (AR), estrogen receptor (ER), farnesoid X receptor (FXR), and glucocorticoid receptor (GR). Three assays for each receptor were evaluated: Attagene (ATG) agonist assay (red), NovaScreen® (NVS) direct binding assay (green), and NCGC/Tox21 GeneBLAzer® agonist assay (blue). An additional diagram (top right) was created for PPARγ using NCGC/Tox21 antagonism assay. Chemicals scoring AC50 ≤ 10 μM for each assay were incorporated in the Venn diagrams, which were created by BioVenn (Hulsen et al. 2008).

Comment in

Similar articles

Cited by

References

    1. Bevington PR, Robinson DK. Boston, MA: McGraw-Hill Education; 2003. Data Reduction and Error Analysis for the Physical Sciences.
    1. Browne P, Judson RS, Casey WM, Kleinstreuer NC, Thomas RS. Screening chemicals for estrogen receptor bioactivity using a computational model. Environ Sci Technol. 2015;49(14):8804–8814. - PubMed
    1. Calkin AC, Tontonoz P. Transcriptional integration of metabolism by the nuclear sterol-activated receptors LXR and FXR. Nat Rev Mol Cell Biol. 2012;13(4):213–224. - PMC - PubMed
    1. Chamorro-García R, Blumberg B. Transgenerational effects of obesogens and the obesity epidemic. Curr Opin Pharmacol. 2014;19:153–158. - PMC - PubMed
    1. Chamorro-García R, Kirchner S, Li X, Janesick A, Casey SC, Chow C, et al. 2012. Bisphenol A diglycidyl ether induces adipogenic differentiation of multipotent stromal stem cells through a peroxisome proliferator–activated receptor gamma-independent mechanism. Environ Health Perspect 120 984 989, doi:10.1289/ehp.1205063 - DOI - PMC - PubMed

Publication types

Substances