. 2016 Jan 13:6:18728.
doi: 10.1038/srep18728.

Quantitative analysis of intrinsic and extrinsic factors in the aggregation mechanism of Alzheimer-associated Aβ-peptide

Affiliations

Quantitative analysis of intrinsic and extrinsic factors in the aggregation mechanism of Alzheimer-associated Aβ-peptide

Georg Meisl et al. Sci Rep. .

Abstract

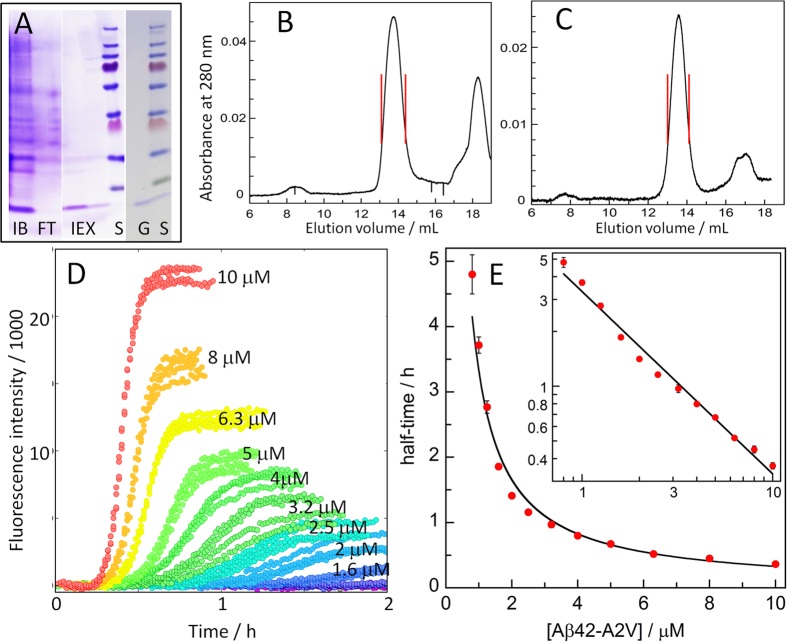
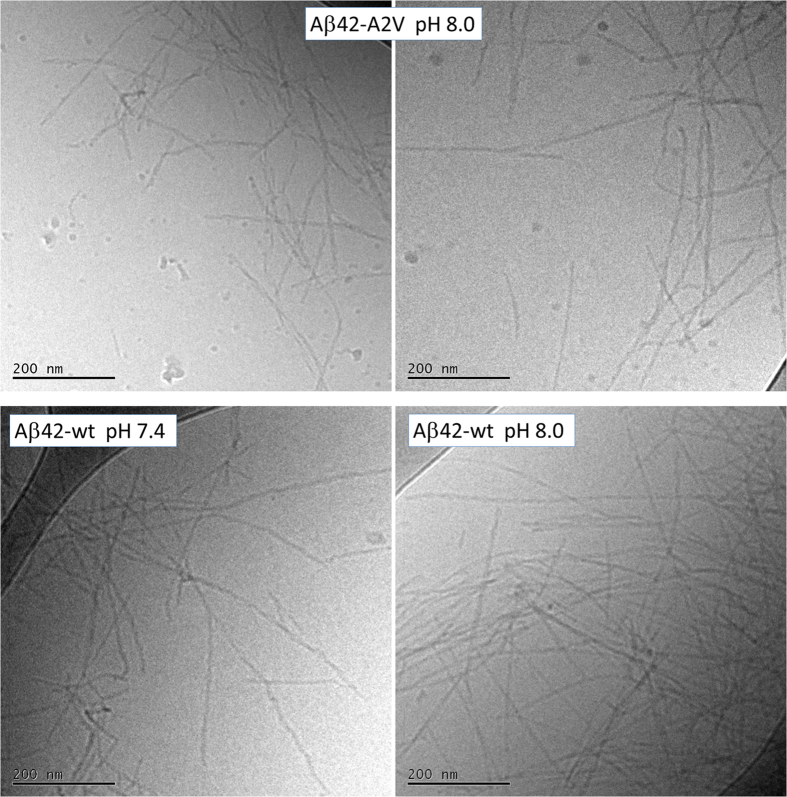
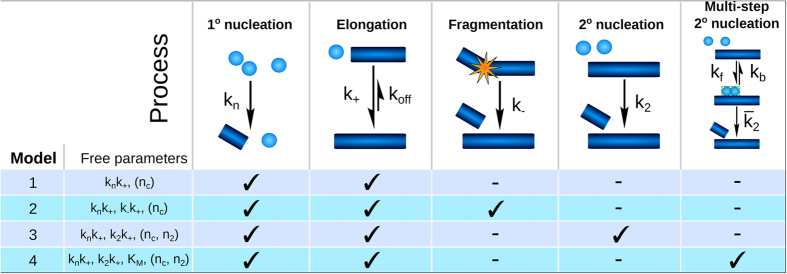
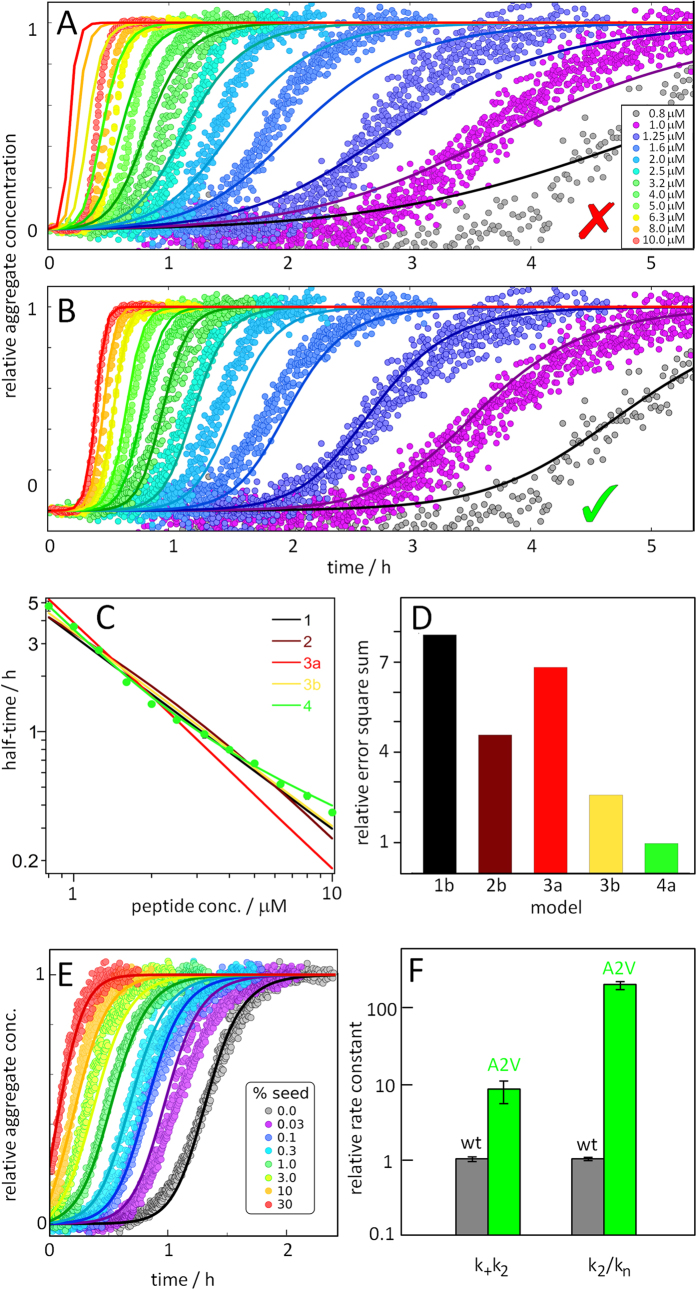
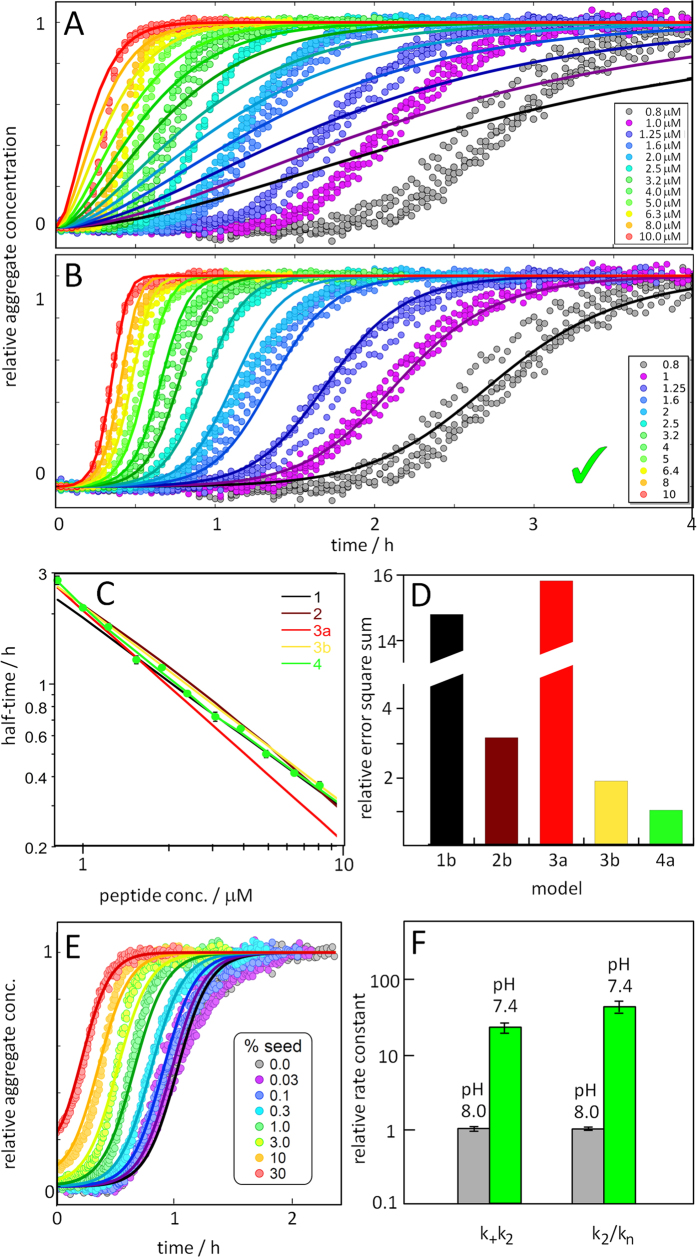
Disease related mutations and environmental factors are key determinants of the aggregation mechanism of the amyloid-β peptide implicated in Alzheimer's disease. Here we present an approach to investigate these factors through acquisition of highly reproducible data and global kinetic analysis to determine the mechanistic influence of intrinsic and extrinsic factors on the Aβ aggregation network. This allows us to translate the shift in macroscopic aggregation behaviour into effects on the individual underlying microscopic steps. We apply this work-flow to the disease-associated Aβ42-A2V variant, and to a variation in pH as examples of an intrinsic and an extrinsic perturbation. In both cases, our data reveal a shift towards a mechanism in which a larger fraction of the reactive flux goes via a pathway that generates potentially toxic oligomeric species in a fibril-catalyzed reaction. This is in agreement with the finding that Aβ42-A2V leads to early-onset Alzheimer's disease and enhances neurotoxicity.


Figures

Figure 1
Figure 1. Aβ42-A2V purification, monomer isolation and aggregation kinetics experiments.
(A) SDS PAGE (10–20% Tris-Tricine gel) of urea-dissolved inclusion bodies (IB), flow-through of IEX resin (FT), eluted fractions from ion exchange (IEX), pooled sample after gel filtration (G), and Mw standards (S) with the lowest marker at 10 kDa (the right-most standard lane contains a spill-over of Aβ seen below the 10 kDa marker). (B) Gel filtration on a Superdex75 1 × 30 cm column of a lyophilized aliquot from the pool (G) in panel A after dissolution in 6 M GuHCl. The collected fraction was between the red marks. (C) Monomer isolation by gel filtration on a Superdex75 1 × 30 cm column of the lyophylized monomer fraction from panel B after dissolution in 6 M GuHCl. The collected fraction between the red marks was used in the aggregation kinetics experiments. (D) Examples of aggregation kinetic data, four technical replicates of ThT fluorescence as a function of time, with initial monomer concentration between 0.8 and 10 μM as indicated next to the respective curves from 1.6 μM and up. (E) Half time of the aggregation process as a function of initial monomer concentration. The solid line is the best fit of a power function (A*mγ), the exponent γ of the best fit is −1.00. The inset shows the same data on a logarithmic scale to illustrate the curvature and deviation from a straight line.
Figure 2
Figure 2. Cryo-TEM images of Aβ42-A2V fibrils formed at pH 8.0 (top two fields) and Aβ42-wt fibrils (bottom two fields formed at pH 7.4, left, and pH 8.0, right).
The fibrils were collected after reaching the final plateau in the ThT fluorescence curve. The scale bar is 200 nm.
Figure 3
Figure 3. Mechanisms of aggregation.
Schemes of the microscopic steps that make up the reaction network in the four different models (model 1, 2, 3 and 4) tested in the kinetic analyses. The free fitting parameters for each model are given as well, the reaction orders are given in brackets, as they are either fitted (in models 1b, 2b, 3b and 4b) or fixed to their value found in the case of wt Aβ42 at pH8 (in models 1a, 2a, 3a and 4a). Further details given in Fig S3.
Figure 4
Figure 4. Kinetic analysis of Aβ42-A2V.
(A,B) Normalized time courses (ThT fluorescence data points) for aggregation reactions starting from 0.8 (grey) to 10 μM (red) Aβ42-A2V monomer in 20 mM NaP, 0.2 mM EDTA, 0.02% NaN3, pH 8.0. Each colour shows four technical replicates at each concentration. The solid lines represents the best fits of model 3a (A) and model 4a (B) and plots for all models are shown in Figure S1. (A) The best fit with a model consistent with the Aβ42 wt data: primary nucleation, secondary nucleation and elongation with fixed reaction orders nc = n2 = 2 (as for wt) (model 3a) and (B) the best fit with a model including primary nucleation and multi-step secondary nucleation (model 4a). (C) The half time as a function of peptide concentration from the best fit of each model is compared to the experimental data. (D) Error square sum, a measure of the goodness of the fit, of each model relative to model 4a. The models, with the number of fitting parameters given in brackets, are: Model1b Primary nucleation and elongation (2). Model2b Primary nucleation, fragmentation and elongation (3). Model3a Primary nucleation, secondary nucleation and elongation (2). Model3b Primary nucleation, secondary nucleation and elongation (4). Model4a Primary nucleation, multi-step secondary nucleation and elongation (3). Although involving one less free parameter than model 3b, model 4a yields a lower error. See Figure 3 for the processes and parameters for each model. (E) Normalized aggregation kinetics data for samples that initially contain 2.3 μM monomer supplemented with 0.03, 0.1, 0.3, 1, 3, 10 or 30% seeds (in monomer equivalents) confirm the strong role of surface-catalyzed secondary nucleation. The solid lines are fits of model 4a, using the parameter values found above and one free parameter, the elongation rate constant k+. (F) Comparison of k2k+and k2/kn for Aβ42-A2V relative to Aβ42-wt. In particular note the large increase in the relative importance of secondary over primary nucleation.
Figure 5
Figure 5. Kinetic analysis of Aβ42 wt at pH 7.4.
(A) Normalized time courses (ThT fluorescence) for aggregation reactions starting from 0.8 (grey) to 10 μM (red) Aβ42 monomer in 20 mM NaP, 0.2 mM EDTA, 0.02% NaN3, pH 7.4. Each colour shows four technical replicates at each concentration. The solid lines represents the best fits of model 3a (A) and model 4a (B) and plots for all models are shown in Figure S2. (A) The best fit with a model consistent with the Aβ42 wt data at pH 8.0: primary nucleation, secondary nucleation and elongation with fixed reaction orders of nc = n2 = 2 (model 3a). (B) The best fit with a model including primary nucleation and multi-step secondary nucleation (model 4a). (C) The half time as a function of peptide concentration from the best fit of each model is compared to the experimental data. (D) Error square sum, a measure of the goodness of the fit, of each model relative to model 4a. The models, with the number of fitting parameters given in brackets, are: Model1b) Primary nucleation and elongation (2). Model2b Primary nucleation, fragmentation and elongation (3). Model3a Primary nucleation, secondary nucleation and elongation (2). Model3b Primary nucleation, secondary nucleation and elongation (4). Model4a Primary nucleation, multi-step secondary nucleation and elongation (3). Although involving one less free parameter than model 3b, model 4a yields a lower error. See Fig. 3 for the processes and parameters for each model. (E) Normalized aggregation kinetics data for samples that initially contain 2.2 μM monomer supplemented with 0.03, 0.1, 0.3, 1, 3, 10 or 30% seeds (in monomer equivalents) confirm the strong role of surface-catalyzed secondary nucleation. The solid lines are fits of model 4a, using the parameter values found above and one free parameter, the elongation rate constant k+. (F) Comparison of k2k+ and k2/kn for Aβ42-wt at pH 7.4 relative to pH 8.0.

References

    1. Glenner G. G. & Wong C. W. Alzheimer’s disease: initial report of the purification and characterization of a novel cerebrovascular amyloid protein. Biochem. Biophys. Res. Commun. 120, 885–890 (1984). - PubMed
    1. Hardy J. & Allsop D. Amyloid deposition as the central event in the aetiology of Alzheimer’s disease. Trends Pharmacol Sci. 12, 383–388 (1991). - PubMed
    1. Knowles T. P., Vendruscolo M. & Dobson C. M. The amyloid state and its association with protein misfolding diseases. Nat. Rev. Mol. Cell. Biol. 15, 384–396 (2014). - PubMed
    1. Walsh D. M. et al. Naturally secreted oligomers of amyloid beta protein potently inhibit hippocampal long-term potentiation in vivo. Nature 416, 535–539 (2002). - PubMed
    1. Jan A. et al. Abeta42 neurotoxicity is mediated by ongoing nucleated polymerization process rather than by discrete Abeta42 species. J. Biol. Chem. 286, 8585–8596 (2011). - PMC - PubMed

Publication types