. 2016 May;33(5):1245-56.
doi: 10.1093/molbev/msw008. Epub 2016 Jan 11.

Evaluating Phylostratigraphic Evidence for Widespread De Novo Gene Birth in Genome Evolution

Affiliations

Evaluating Phylostratigraphic Evidence for Widespread De Novo Gene Birth in Genome Evolution

Bryan A Moyers et al. Mol Biol Evol. 2016 May.

Abstract

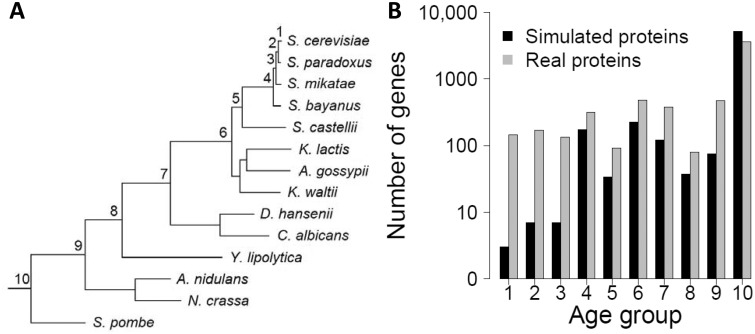
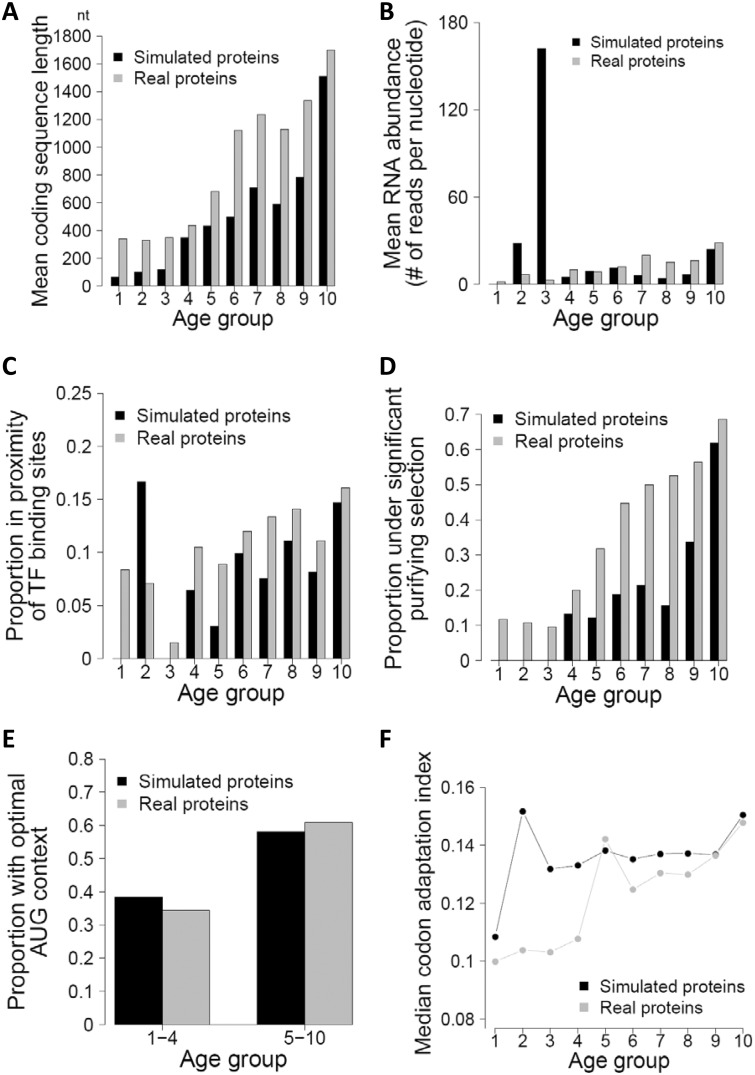
The source of genetic novelty is an area of wide interest and intense investigation. Although gene duplication is conventionally thought to dominate the production of new genes, this view was recently challenged by a proposal of widespread de novo gene origination in eukaryotic evolution. Specifically, distributions of various gene properties such as coding sequence length, expression level, codon usage, and probability of being subject to purifying selection among groups of genes with different estimated ages were reported to support a model in which new protein-coding proto-genes arise from noncoding DNA and gradually integrate into cellular networks. Here we show that the genomic patterns asserted to support widespread de novo gene origination are largely attributable to biases in gene age estimation by phylostratigraphy, because such patterns are also observed in phylostratigraphic analysis of simulated genes bearing identical ages. Furthermore, there is no evidence of purifying selection on very young de novo genes previously claimed to show such signals. Together, these findings are consistent with the prevailing view that de novo gene birth is a relatively minor contributor to new genes in genome evolution. They also illustrate the danger of using phylostratigraphy in the study of new gene origination without considering its inherent bias.

Keywords: BLAST; gene age; new genes; phylostratigraphy; proto-gene; yeast..


Figures

F<sc>ig</sc>. 1.
Fig. 1.
Computer simulation for examining phylostratigraphic errors. (A) Tree used in the simulation of protein sequence evolution. The tree, including relative branch lengths, follows Wapinski et al. (2007). Node label refers to the age group corresponding to that node. (B) Numbers of genes estimated to belong to each age bin for real and simulated protein data. Numbers of genes in bins 1–10 for simulated protein data are 2, 6, 6, 171, 33, 222, 119, 36, 74, and 5,209, respectively. Numbers of genes in bins 1–10 for real data, as provided by Carvunis et al., are 143, 169, 133, 314, 90, 476, 381, 78, 469, and 3,625, respectively. Carvunis et al. arbitrarily assigned 107,425 smORFs to bin 0, which is not shown here.
F<sc>ig</sc>. 2.
Fig. 2.
Age distributions of six gene properties in real and simulated proteins. (A) Average coding sequence length of genes in each age bin. Interestingly, although the same lengths are used for the real and simulated proteins, mean length is lower for simulated than real proteins in each bin. This is an example of Simpson’s paradox in statistics and is not due to mistakes in our analysis. (B) Mean expression level of genes in each age bin. (C) Proportion of genes having a TF-binding site within 200 bp of the translation start site for each age bin. (D) Proportion of genes under purifying selection for each age bin. (E) Proportion of genes with optimal AUG context for each age bin. (F) Median CAI for each age bin.
F<sc>ig</sc>. 3.
Fig. 3.
Age distributions of four additional gene properties in real and simulated proteins. (A) Mean hydropathicity value for each age bin. (B) Mean proportion of transmembrane regions for each age bin. (C) Mean proportion of disordered regions for each age bin. (D) Amino acid frequency ratios between age groups.

References

    1. Abrusán G. 2013. Integration of new genes into cellular networks, and their structural maturation. Genetics 195:1407–1417. - PMC - PubMed
    1. Akashi H, Gojobori T. 2002. Metabolic efficiency and amino acid composition in the proteomes of Escherichia coli and Bacillus subtilis. Proc Natl Acad Sci U S A. 99:3695–3700. - PMC - PubMed
    1. Begun DJ, Lindfors HA, Kern AD, Jones CD. 2007. Evidence for de novo evolution of testis-expressed genes in the Drosophila yakuba/Drosophila erecta clade. Genetics 176:1131–1137. - PMC - PubMed
    1. Brown CA, Murray AW, Verstrepen KJ. 2010. Rapid expansion and functional divergence of subtelomeric gene families in yeasts. Curr Biol. 20:895–903. - PMC - PubMed
    1. Cai J, Zhao R, Jiang H, Wang W. 2008. De novo origination of a new protein-coding gene in Saccharomyces cerevisiae. Genetics 179:487–496. - PMC - PubMed