

Somatosensory Temporal Discrimination Threshold Involves Inhibitory Mechanisms in the Primary Somatosensory Area
- PMID: 26758826
- PMCID: PMC6602023
- DOI: 10.1523/JNEUROSCI.2008-15.2016
Somatosensory Temporal Discrimination Threshold Involves Inhibitory Mechanisms in the Primary Somatosensory Area
Abstract
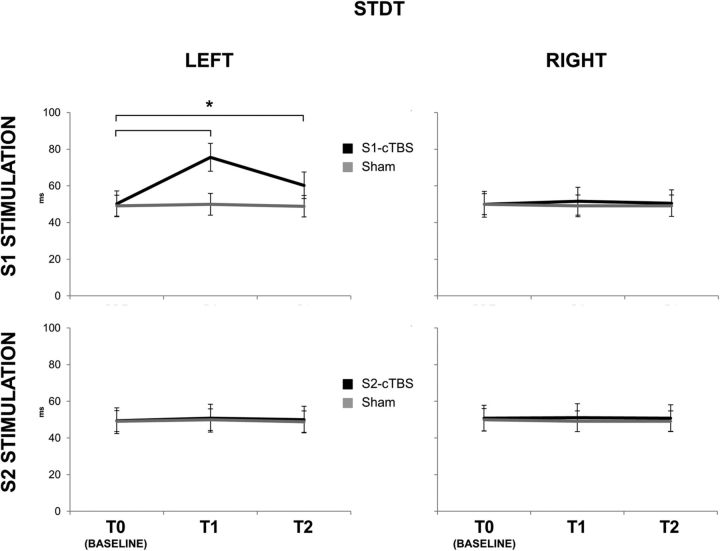
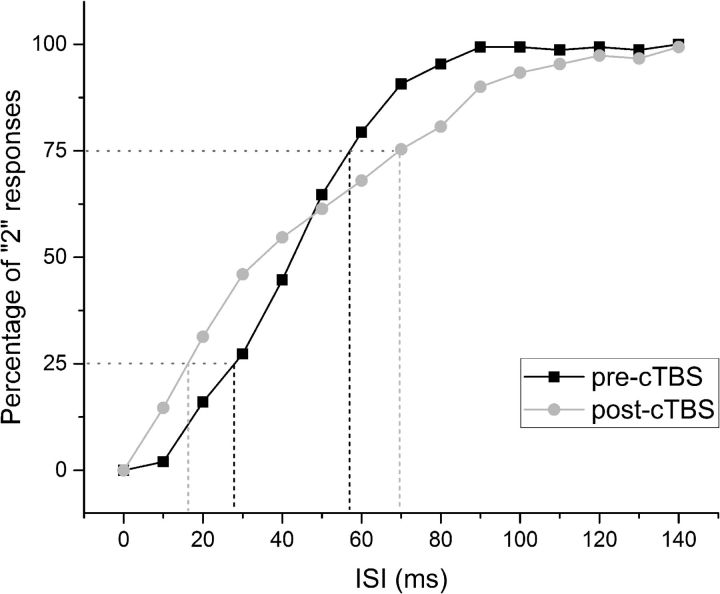
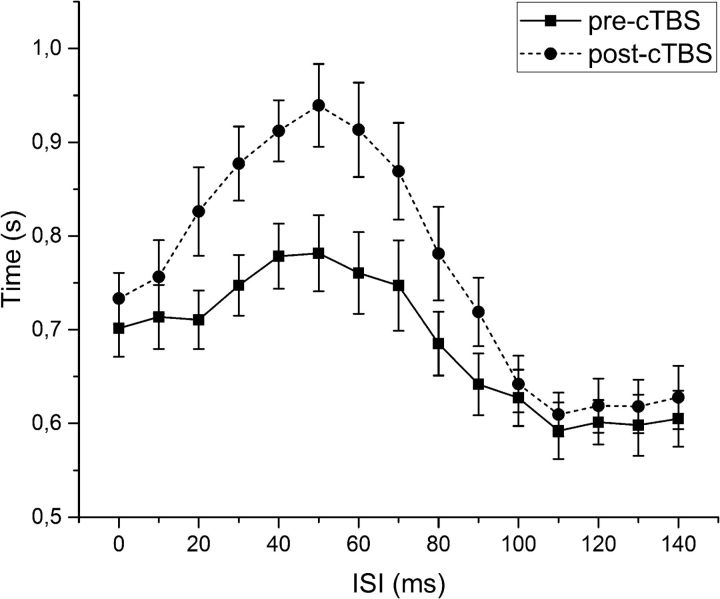
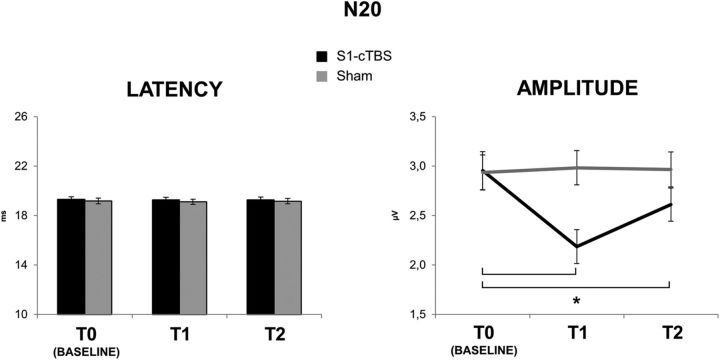
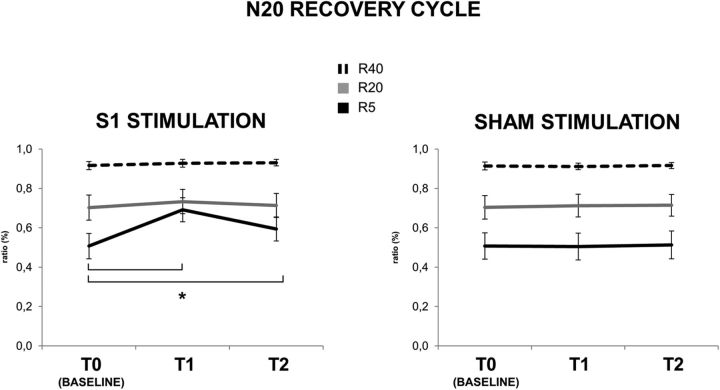
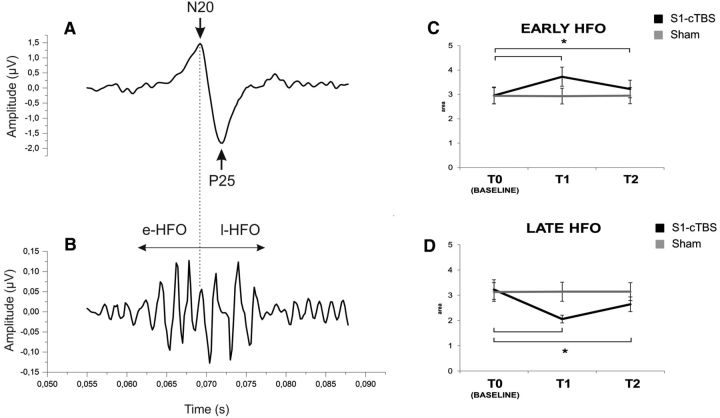
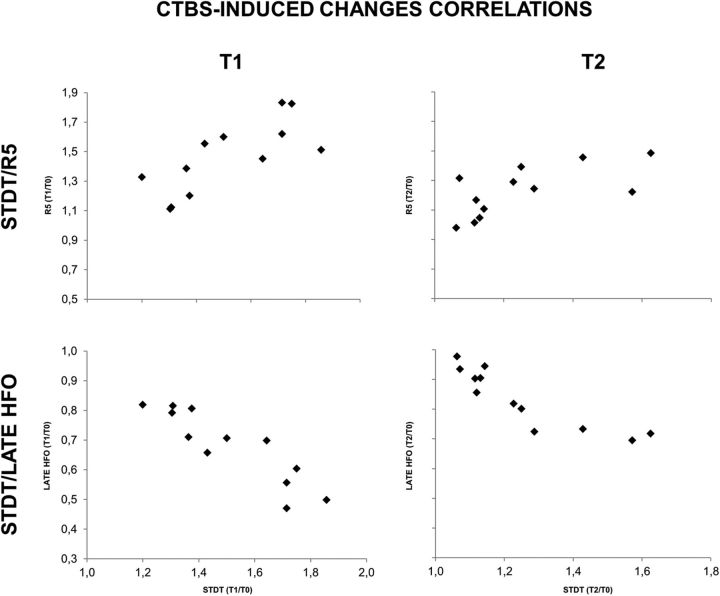
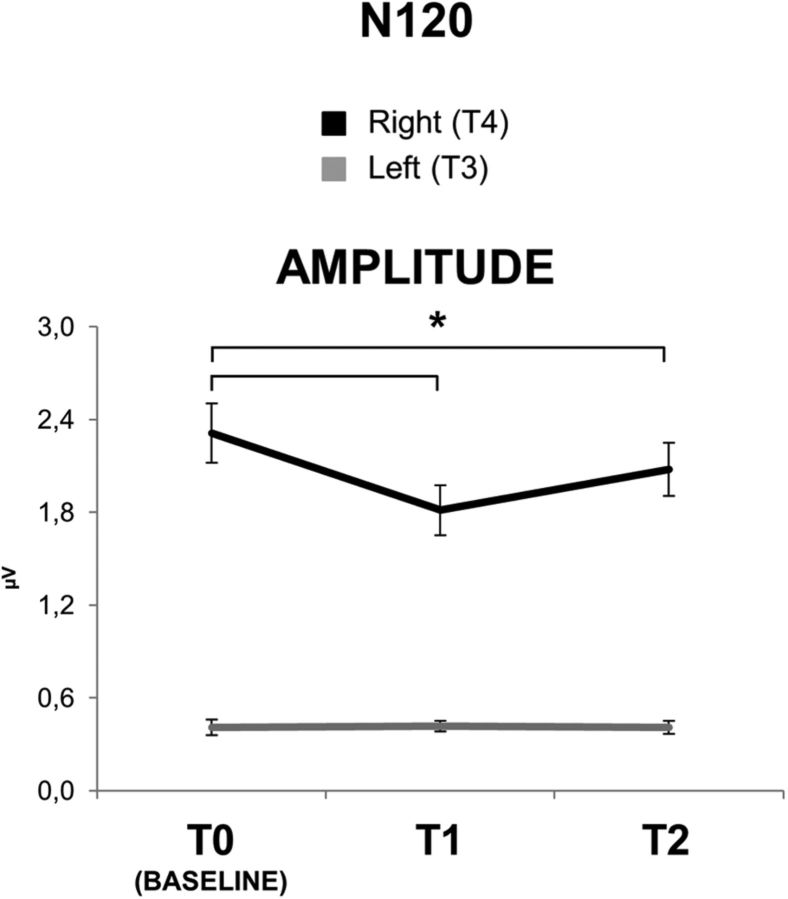
Somatosensory temporal discrimination threshold (STDT) is defined as the shortest time interval necessary for a pair of tactile stimuli to be perceived as separate. Although STDT is altered in several neurological disorders, its neural bases are not entirely clear. We used continuous theta burst stimulation (cTBS) to condition the excitability of the primary somatosensory cortex in healthy humans to examine its possible contribution to STDT. Excitability was assessed using the recovery cycle of the N20 component of somatosensory evoked potentials (SEP) and the area of high-frequency oscillations (HFO). cTBS increased STDT and reduced inhibition in the N20 recovery cycle at an interstimulus interval of 5 ms. It also reduced the amplitude of late HFO. All three effects were correlated. There was no effect of cTBS over the secondary somatosensory cortex on STDT, although it reduced the N120 component of the SEP. STDT is assessed conventionally with a simple ascending method. To increase insight into the effect of cTBS, we measured temporal discrimination with a psychophysical method. cTBS reduced the slope of the discrimination curve, consistent with a reduction of the quality of sensory information caused by an increase in noise. We hypothesize that cTBS reduces the effectiveness of inhibitory interactions normally used to sharpen temporal processing of sensory inputs. This reduction in discriminability of sensory input is equivalent to adding neural noise to the signal.
Significance statement: Precise timing of sensory information is crucial for nearly every aspect of human perception and behavior. One way to assess the ability to analyze temporal information in the somatosensory domain is to measure the somatosensory temporal discrimination threshold (STDT), defined as the shortest time interval necessary for a pair of tactile stimuli to be perceived as separate. In this study, we found that STDT depends on inhibitory mechanisms within the primary somatosensory area (S1). This finding helps interpret the sensory processing deficits in neurological diseases, such as focal dystonia and Parkinson's disease, and possibly prompts future studies using neurostimulation techniques over S1 for therapeutic purposes in dystonic patients.
Keywords: high-frequency oscillations; somatosensory evoked potentials; somatosensory temporal discrimination threshold; transcranial magnetic stimulation.
Copyright © 2016 the authors 0270-6474/16/360325-11$15.00/0.
Figures
Similar articles
-
The third-stimulus temporal discrimination threshold: focusing on the temporal processing of sensory input within primary somatosensory cortex.J Neurophysiol. 2017 Oct 1;118(4):2311-2317. doi: 10.1152/jn.00947.2016. Epub 2017 Jul 26. J Neurophysiol. 2017. PMID: 28747470 Free PMC article.
-
Theta-burst stimulation-induced plasticity over primary somatosensory cortex changes somatosensory temporal discrimination in healthy humans.PLoS One. 2012;7(3):e32979. doi: 10.1371/journal.pone.0032979. Epub 2012 Mar 7. PLoS One. 2012. PMID: 22412964 Free PMC article.
-
Investigating the effects of transcranial alternating current stimulation on primary somatosensory cortex.Sci Rep. 2020 Oct 13;10(1):17129. doi: 10.1038/s41598-020-74072-2. Sci Rep. 2020. PMID: 33051523 Free PMC article.
-
Abnormal somatosensory temporal discrimination in Parkinson's disease: Pathophysiological correlates and role in motor control deficits.Clin Neurophysiol. 2018 Feb;129(2):442-447. doi: 10.1016/j.clinph.2017.11.022. Epub 2017 Dec 13. Clin Neurophysiol. 2018. PMID: 29304419 Review.
-
The neural basis of somatosensory temporal discrimination threshold as a paradigm for time processing in the sub-second range: An updated review.Neurosci Biobehav Rev. 2024 Jan;156:105486. doi: 10.1016/j.neubiorev.2023.105486. Epub 2023 Nov 30. Neurosci Biobehav Rev. 2024. PMID: 38040074 Review.
Cited by
-
Amelioration of Focal Hand Dystonia via Low-Frequency Repetitive Somatosensory Stimulation.Mov Disord. 2024 Dec;39(12):2220-2229. doi: 10.1002/mds.30011. Epub 2024 Sep 10. Mov Disord. 2024. PMID: 39254362 Free PMC article.
-
New Horizons in Early Dementia Diagnosis: Can Cerebellar Stimulation Untangle the Knot?J Clin Med. 2019 Sep 16;8(9):1470. doi: 10.3390/jcm8091470. J Clin Med. 2019. PMID: 31527392 Free PMC article.
-
Variability and Predictors of Response to Continuous Theta Burst Stimulation: A TMS-EEG Study.Front Neurosci. 2018 Jun 12;12:400. doi: 10.3389/fnins.2018.00400. eCollection 2018. Front Neurosci. 2018. PMID: 29946234 Free PMC article.
-
Causal computations of supplementary motor area on spatial impulsivity.Sci Rep. 2024 Jul 24;14(1):17040. doi: 10.1038/s41598-024-67673-8. Sci Rep. 2024. PMID: 39048603 Free PMC article.
-
Resting-state fMRI functional connectivity of the left temporal parietal junction is associated with visual temporal order threshold.Sci Rep. 2022 Sep 24;12(1):15933. doi: 10.1038/s41598-022-20309-1. Sci Rep. 2022. PMID: 36153359 Free PMC article.
References
-
- Boakye M, Huckins SC, Szeverenyi NM, Taskey BI, Hodge CJ., Jr Functional magnetic resonance imaging of somatosensory cortex activity produced by electrical stimulation of the median nerve or tactile stimulation of the index finger. J Neurosurg. 2000;93:774–783. doi: 10.3171/jns.2000.93.5.0774. - DOI - PubMed
MeSH terms
LinkOut - more resources
Full Text Sources
Other Literature Sources
Miscellaneous