

Dynamic Changes in Striatal mGluR1 But Not mGluR5 during Pathological Progression of Parkinson's Disease in Human Alpha-Synuclein A53T Transgenic Rats: A Multi-PET Imaging Study
- PMID: 26758830
- PMCID: PMC6602033
- DOI: 10.1523/JNEUROSCI.2289-15.2016
Dynamic Changes in Striatal mGluR1 But Not mGluR5 during Pathological Progression of Parkinson's Disease in Human Alpha-Synuclein A53T Transgenic Rats: A Multi-PET Imaging Study
Abstract
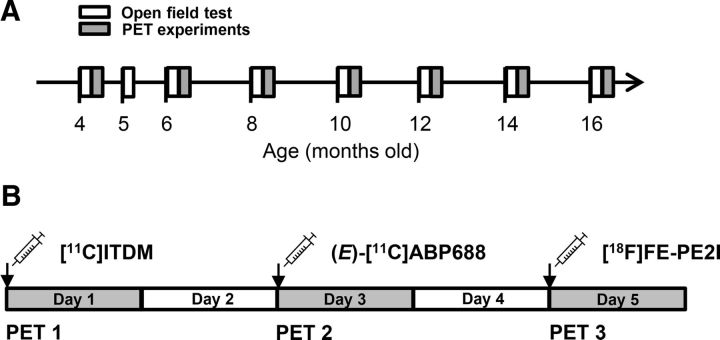
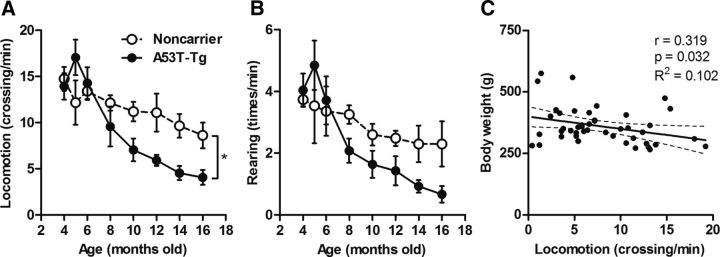
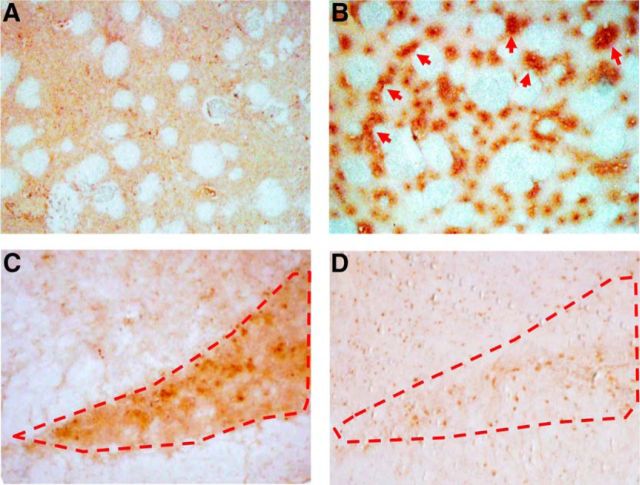
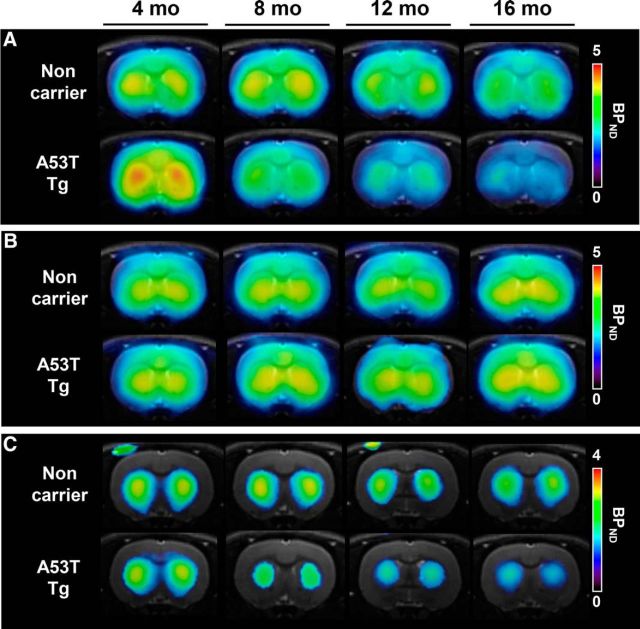
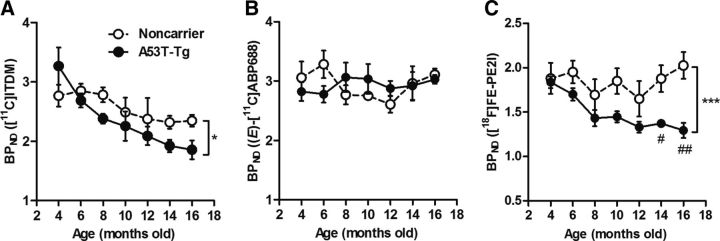
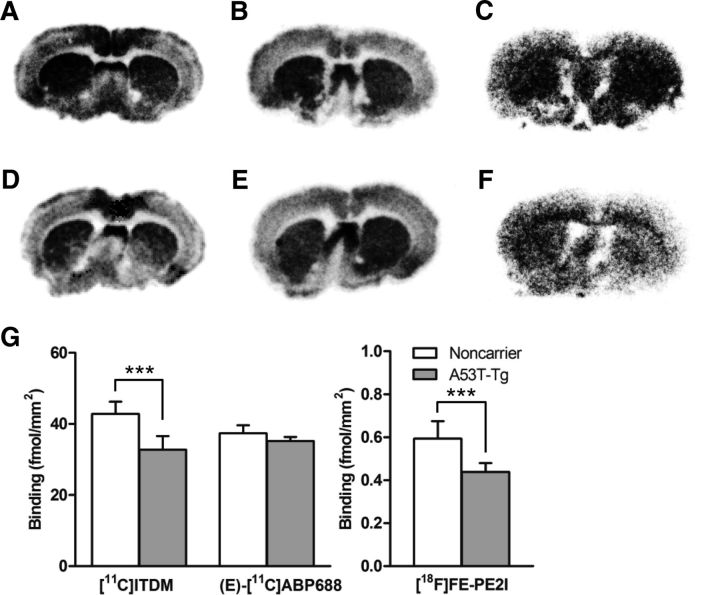
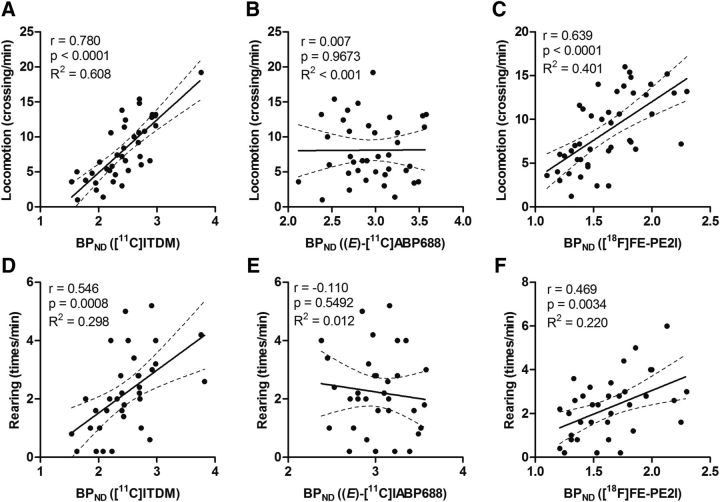
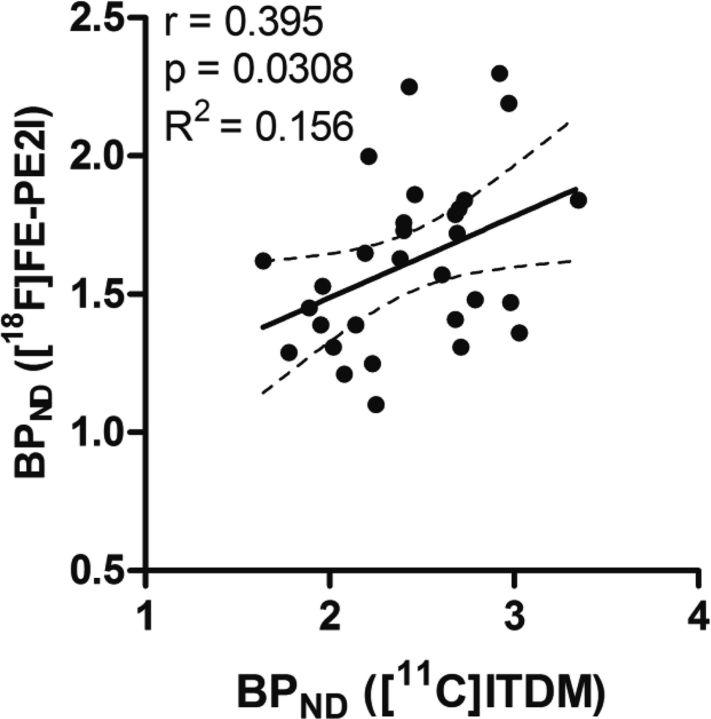
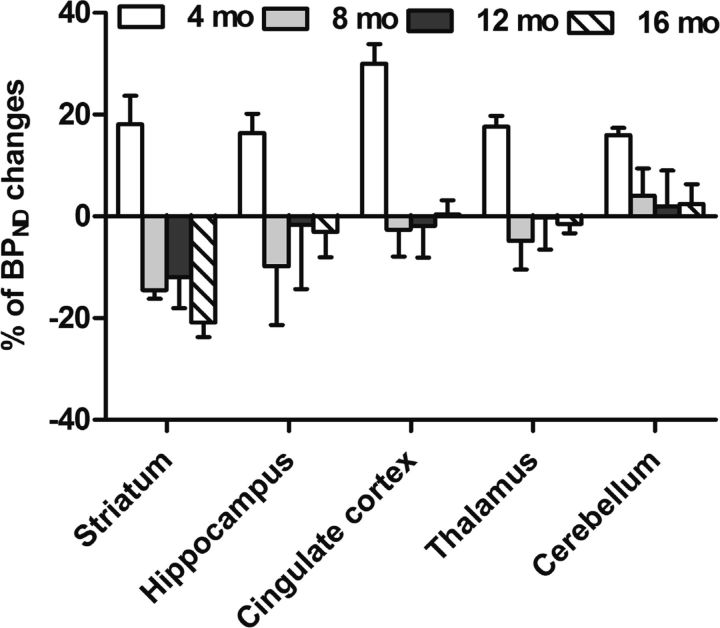
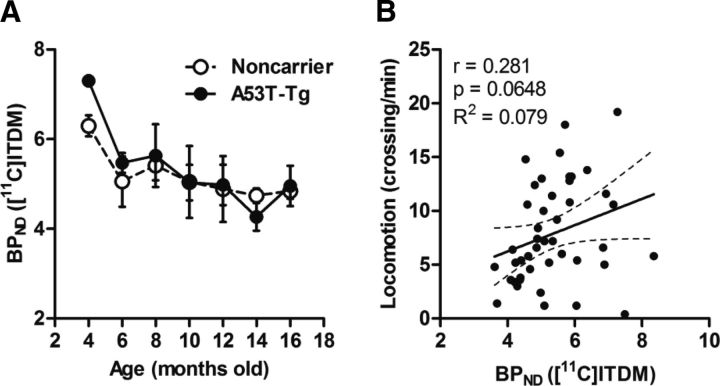
Parkinson's disease (PD) is a prevalent degenerative disorder affecting the CNS that is primarily characterized by resting tremor and movement deficits. Group I metabotropic glutamate receptor subtypes 1 and 5 (mGluR1 and mGluR5, respectively) are important targets for investigation in several CNS disorders. In the present study, we investigated the in vivo roles of mGluR1 and mGluR5 in chronic PD pathology by performing longitudinal positron emission tomography (PET) imaging in A53T transgenic (A53T-Tg) rats expressing an abnormal human α-synuclein (ASN) gene. A53T-Tg rats showed a dramatic decline in general motor activities with age, along with abnormal ASN aggregation and striatal neuron degeneration. In longitudinal PET imaging, striatal nondisplaceable binding potential (BPND) values for [(11)C]ITDM (N-[4-[6-(isopropylamino) pyrimidin-4-yl]-1,3-thiazol-2-yl]-N-methyl-4-[(11)C]methylbenzamide), a selective PET ligand for mGluR1, temporarily increased before PD symptom onset and dramatically decreased afterward with age. However, striatal BPND values for (E)-[(11)C]ABP688 [3-(6-methylpyridin-2-ylethynyl)-cyclohex-2-enone-(E)-O-[(11)C]methyloxime], a specific PET ligand for mGluR5, remained constant during experimental terms. The dynamic changes in striatal mGluR1 BPND values also showed a high correlation in pathological decreases in general motor activities. Furthermore, declines in mGluR1 BPND values were correlated with decreases in BPND values for [(18)F]FE-PE2I [(E)-N-(3-iodoprop-2E-enyl)-2β-carbo-[(18)F]fluoroethoxy-3β-(4-methylphenyl) nortropane], a specific PET ligand for the dopamine transporter, a biomarker for dopaminergic neurons. In conclusion, our results have demonstrated for the first time that dynamic changes occur in mGluR1, but not mGluR5, that accompany pathological progression in a PD animal model.
Significance statement: Synaptic signaling by glutamate, the principal excitatory neurotransmitter in the brain, is modulated by group I metabotropic glutamate receptors, including the mGluR1 and mGluR5 subtypes. In the brain, mGluR1 and mGluR5 have distinct functional roles and regional distributions. Their roles in brain pathology, however, are not well characterized. Using longitudinal PET imaging in a chronic rat model of PD, we demonstrated that expression of mGluR1, but not mGluR5, dynamically changed in the striatum accompanying pathological PD progression. These findings imply that monitoring mGluR1 in vivo may provide beneficial information to further understand central nervous system disorders.
Keywords: PET; Parkinson's disease; dopamine transporter; mGluR1; mGluR5; nondisplaceable binding potential.
Copyright © 2016 the authors 0270-6474/16/360376-10$15.00/0.
Figures

Similar articles
-
Longitudinal Characterization of mGluR5 Using 11C-ABP688 PET Imaging in the Q175 Mouse Model of Huntington Disease.J Nucl Med. 2018 Nov;59(11):1722-1727. doi: 10.2967/jnumed.118.210658. Epub 2018 May 24. J Nucl Med. 2018. PMID: 29794227
-
N-(4-(6-(Isopropylamino)pyrimidin-4-yl)-1,3-thiazol-2-yl)-N-methyl-4-[11C]methylbenzamide.2013 Feb 19 [updated 2013 May 2]. In: Molecular Imaging and Contrast Agent Database (MICAD) [Internet]. Bethesda (MD): National Center for Biotechnology Information (US); 2004–2013. 2013 Feb 19 [updated 2013 May 2]. In: Molecular Imaging and Contrast Agent Database (MICAD) [Internet]. Bethesda (MD): National Center for Biotechnology Information (US); 2004–2013. PMID: 23638494 Free Books & Documents. Review.
-
N-(4-(6-(Isopropylamino)pyrimidin-4-yl)-1,3-thiazol-2-yl)-4-[11C]methoxy-N-methylbenzamide.2013 Feb 14 [updated 2013 May 2]. In: Molecular Imaging and Contrast Agent Database (MICAD) [Internet]. Bethesda (MD): National Center for Biotechnology Information (US); 2004–2013. 2013 Feb 14 [updated 2013 May 2]. In: Molecular Imaging and Contrast Agent Database (MICAD) [Internet]. Bethesda (MD): National Center for Biotechnology Information (US); 2004–2013. PMID: 23638488 Free Books & Documents. Review.
-
123I-FP-CIT SPECT [(123) I-2β-carbomethoxy-3β-(4-iodophenyl)-N-(3-fluoropropyl) nortropane single photon emission computed tomography] Imaging in a p.A53T α-synuclein Parkinson's disease cohort versus Parkinson's disease.Mov Disord. 2018 Nov;33(11):1734-1739. doi: 10.1002/mds.27451. Epub 2018 Oct 4. Mov Disord. 2018. PMID: 30288781
-
Chronic mild stress accelerates the progression of Parkinson's disease in A53T α-synuclein transgenic mice.Exp Neurol. 2016 Nov;285(Pt A):61-71. doi: 10.1016/j.expneurol.2016.09.004. Epub 2016 Sep 13. Exp Neurol. 2016. PMID: 27637804
Cited by
-
Genes Implicated in Familial Parkinson's Disease Provide a Dual Picture of Nigral Dopaminergic Neurodegeneration with Mitochondria Taking Center Stage.Int J Mol Sci. 2021 Apr 28;22(9):4643. doi: 10.3390/ijms22094643. Int J Mol Sci. 2021. PMID: 33924963 Free PMC article. Review.
-
Small-animal PET study for noninvasive quantification of transmembrane AMPA receptor regulatory protein γ-8 (TARP γ-8) in the brain.J Cereb Blood Flow Metab. 2023 Jun;43(6):893-904. doi: 10.1177/0271678X231152025. Epub 2023 Jan 18. J Cereb Blood Flow Metab. 2023. PMID: 36655318 Free PMC article.
-
Upregulation of Striatal Metabotropic Glutamate Receptor Subtype 1 (mGluR1) in Rats with Excessive Glutamate Release Induced by N-Acetylcysteine.Neurotox Res. 2022 Feb;40(1):26-35. doi: 10.1007/s12640-021-00449-4. Epub 2022 Jan 4. Neurotox Res. 2022. PMID: 34981453
-
Roles of Glutamate Receptors in Parkinson's Disease.Int J Mol Sci. 2019 Sep 6;20(18):4391. doi: 10.3390/ijms20184391. Int J Mol Sci. 2019. PMID: 31500132 Free PMC article. Review.
-
Revisiting PFA-mediated tissue fixation chemistry: FixEL enables trapping of small molecules in the brain to visualize their distribution changes.Chem. 2023 Feb;9(2):523-540. doi: 10.1016/j.chempr.2022.11.005. Chem. 2023. PMID: 38094901 Free PMC article.
References
-
- Abe T, Sugihara H, Nawa H, Shigemoto R, Mizuno N, Nakanishi S. Molecular characterization of a novel metabotropic glutamate receptor mGluR5 coupled to inositol phosphate/Ca2+ signal transduction. J Biol Chem. 1992;267:13361–13368. - PubMed
Publication types
MeSH terms
Substances
LinkOut - more resources
Full Text Sources
Other Literature Sources
Medical
Miscellaneous