

Cortical Plasticity Induction by Pairing Subthalamic Nucleus Deep-Brain Stimulation and Primary Motor Cortical Transcranial Magnetic Stimulation in Parkinson's Disease
- PMID: 26758832
- PMCID: PMC6602027
- DOI: 10.1523/JNEUROSCI.2499-15.2016
Cortical Plasticity Induction by Pairing Subthalamic Nucleus Deep-Brain Stimulation and Primary Motor Cortical Transcranial Magnetic Stimulation in Parkinson's Disease
Abstract
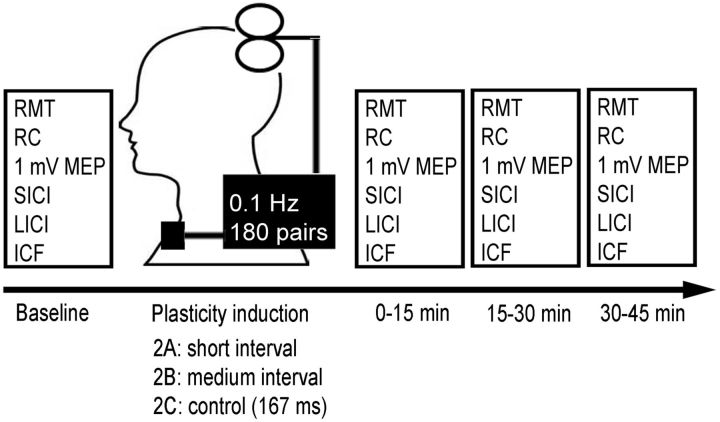
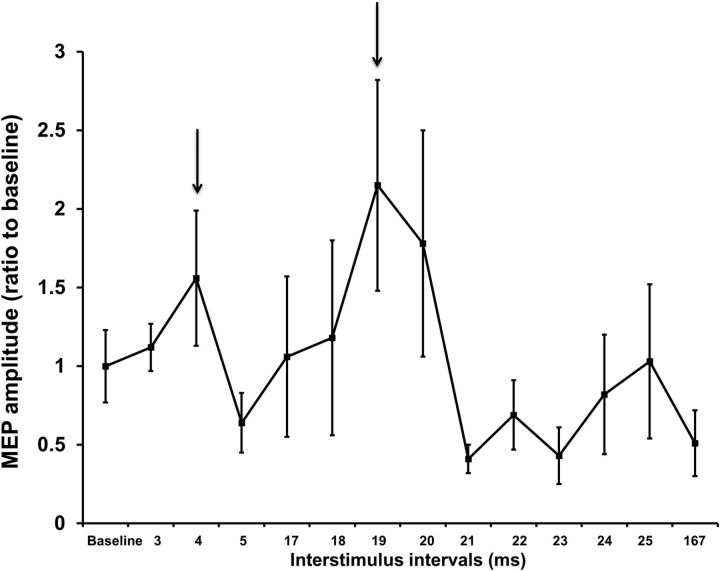
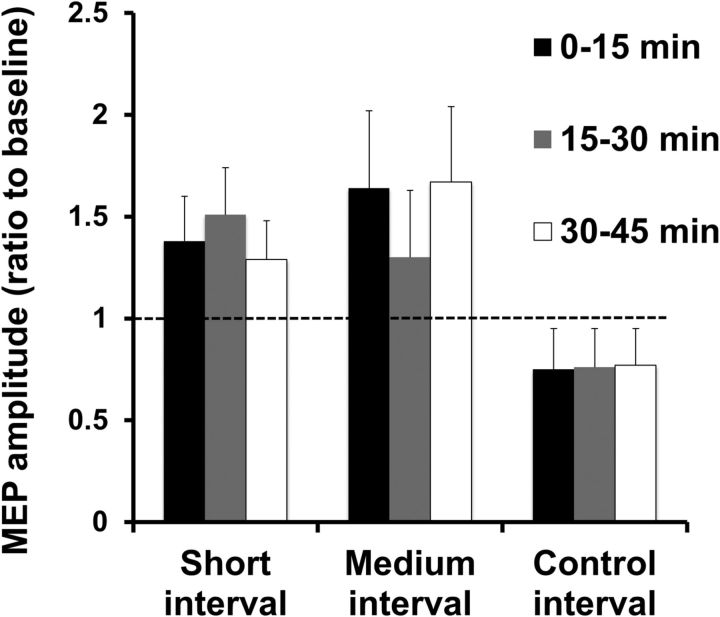
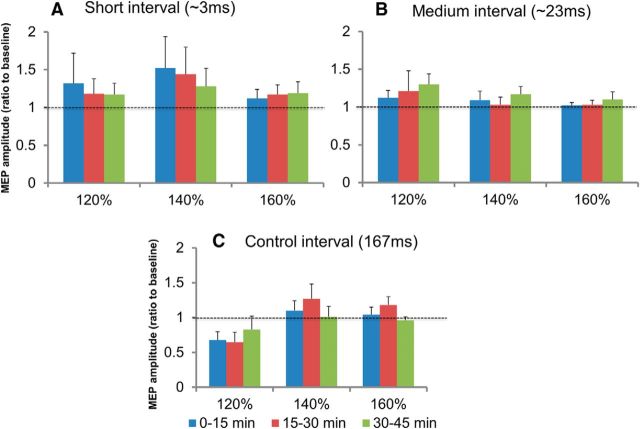
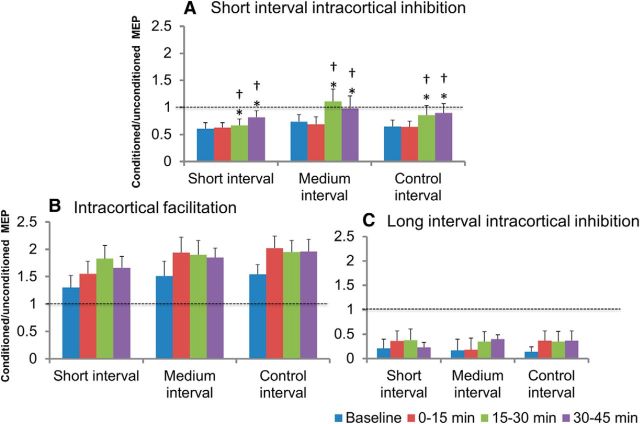
Noninvasive brain stimulation studies have shown abnormal motor cortical plasticity in Parkinson's disease (PD). These studies used peripheral nerve stimulation paired with transcranial magnetic stimulation (TMS) to primary motor cortex (M1) at specific intervals to induce plasticity. Induction of cortical plasticity through stimulation of the basal ganglia (BG)-M1 connections has not been studied. In the present study, we used a novel technique of plasticity induction by repeated pairing of deep-brain stimulation (DBS) of the BG with M1 stimulation using TMS. We hypothesize that repeated pairing of subthalamic nucleus (STN)-DBS and M1-TMS at specific time intervals will lead to plasticity in the M1. Ten PD human patients with STN-DBS were studied in the on-medication state with DBS set to 3 Hz. The interstimulus intervals (ISIs) between STN-DBS and TMS that produced cortical facilitation were determined individually for each patient. Three plasticity induction conditions with repeated pairings (180 times) at specific ISIs (∼ 3 and ∼ 23 ms) that produced cortical facilitation and a control ISI of 167 ms were tested in random order. Repeated pairing of STN-DBS and M1-TMS at short (∼ 3 ms) and medium (∼ 23 ms) latencies increased M1 excitability that lasted for at least 45 min, whereas the control condition (fixed ISI of 167 ms) had no effect. There were no specific changes in motor thresholds, intracortical circuits, or recruitment curves. Our results indicate that paired-associative cortical plasticity can be induced by repeated STN and M1 stimulation at specific intervals. These results show that STN-DBS can modulate cortical plasticity.
Significance statement: We introduced a new experimental paradigm to test the hypothesis that pairing subthalamic nucleus deep-brain stimulation (STN-DBS) with motor cortical transcranial magnetic stimulation (M1-TMS) at specific times can induce cortical plasticity in patients with Parkinson's disease (PD). We found that repeated pairing of STN-DBS with TMS at short (∼ 3 ms) and medium (∼ 23 ms) intervals increased cortical excitability that lasted for up to 45 min, whereas the control condition (fixed latency of 167 ms) had no effects on cortical excitability. This is the first demonstration of associative plasticity in the STN-M1 circuits in PD patients using this novel technique. The potential therapeutic effects of combining DBS and noninvasive cortical stimulation should be investigated further.
Keywords: deep-brain stimulation; hyperdirect pathway; intracortical circuits; motor cortical plasticity; subthalamic nucleus; transcranial magnetic stimulation.
Copyright © 2016 the authors 0270-6474/16/360397-09$15.00/0.
Figures
Similar articles
-
The nature and time course of cortical activation following subthalamic stimulation in Parkinson's disease.Cereb Cortex. 2010 Aug;20(8):1926-36. doi: 10.1093/cercor/bhp269. Epub 2009 Dec 17. Cereb Cortex. 2010. PMID: 20019146
-
Subthalamic stimulation and levodopa modulate cortical reactivity in Parkinson's patients.Parkinsonism Relat Disord. 2017 Jan;34:31-37. doi: 10.1016/j.parkreldis.2016.10.009. Epub 2016 Oct 17. Parkinsonism Relat Disord. 2017. PMID: 27771287
-
Model-based deconstruction of cortical evoked potentials generated by subthalamic nucleus deep brain stimulation.J Neurophysiol. 2018 Aug 1;120(2):662-680. doi: 10.1152/jn.00862.2017. Epub 2018 Apr 25. J Neurophysiol. 2018. PMID: 29694280 Free PMC article.
-
Effects of deep brain stimulation on the primary motor cortex: Insights from transcranial magnetic stimulation studies.Clin Neurophysiol. 2019 Apr;130(4):558-567. doi: 10.1016/j.clinph.2018.10.020. Epub 2018 Nov 30. Clin Neurophysiol. 2019. PMID: 30527386 Free PMC article. Review.
-
Exploring the connections between basal ganglia and cortex revealed by transcranial magnetic stimulation, evoked potential and deep brain stimulation in dystonia.Eur J Paediatr Neurol. 2022 Jan;36:69-77. doi: 10.1016/j.ejpn.2021.12.004. Epub 2021 Dec 10. Eur J Paediatr Neurol. 2022. PMID: 34922163 Review.
Cited by
-
People With Parkinson's Disease and Freezing of Gait Show Abnormal Low Frequency Activity of Antagonistic Leg Muscles.Front Hum Neurosci. 2022 Jan 26;15:733067. doi: 10.3389/fnhum.2021.733067. eCollection 2021. Front Hum Neurosci. 2022. PMID: 35153698 Free PMC article.
-
Brain stimulation patterns emulating endogenous thalamocortical input to parvalbumin-expressing interneurons reduce nociception in mice.Brain Stimul. 2018 Sep-Oct;11(5):1151-1160. doi: 10.1016/j.brs.2018.05.007. Epub 2018 May 18. Brain Stimul. 2018. PMID: 29784588 Free PMC article.
-
Multi-scale and cross-dimensional TMS mapping: A proof of principle in patients with Parkinson's disease and deep brain stimulation.Front Neurosci. 2023 May 4;17:1004763. doi: 10.3389/fnins.2023.1004763. eCollection 2023. Front Neurosci. 2023. PMID: 37214390 Free PMC article.
-
The promotion-like effect of the M1-STN hyperdirect pathway induced by ccPAS enhanced balance performances: From the perspective of brain connectivity.CNS Neurosci Ther. 2024 Apr;30(4):e14710. doi: 10.1111/cns.14710. CNS Neurosci Ther. 2024. PMID: 38615363 Free PMC article. Clinical Trial.
-
A Case-Controlled Pilot Study on Rhythmic Auditory Stimulation-Assisted Gait Training and Conventional Physiotherapy in Patients With Parkinson's Disease Submitted to Deep Brain Stimulation.Front Neurol. 2020 Aug 4;11:794. doi: 10.3389/fneur.2020.00794. eCollection 2020. Front Neurol. 2020. PMID: 32849240 Free PMC article.
References
-
- Amassian VE, Stewart M, Quirk GJ, Rosenthal JL. Physiological basis of motor effects of a transient stimulus to cerebral cortex. Neurosurgery. 1987;20:74–93. - PubMed
Publication types
MeSH terms
Grants and funding
LinkOut - more resources
Full Text Sources
Other Literature Sources
Medical