. 2016 Jan 13;36(2):489-505.
doi: 10.1523/JNEUROSCI.3678-15.2016.

Transitions between Multiband Oscillatory Patterns Characterize Memory-Guided Perceptual Decisions in Prefrontal Circuits

Affiliations

Transitions between Multiband Oscillatory Patterns Characterize Memory-Guided Perceptual Decisions in Prefrontal Circuits

Klaus Wimmer et al. J Neurosci. .

Abstract

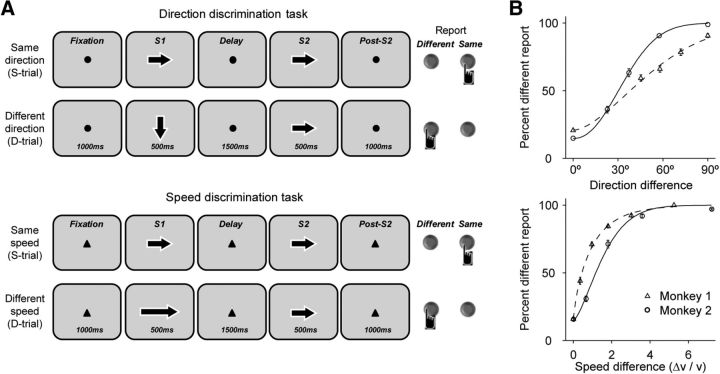
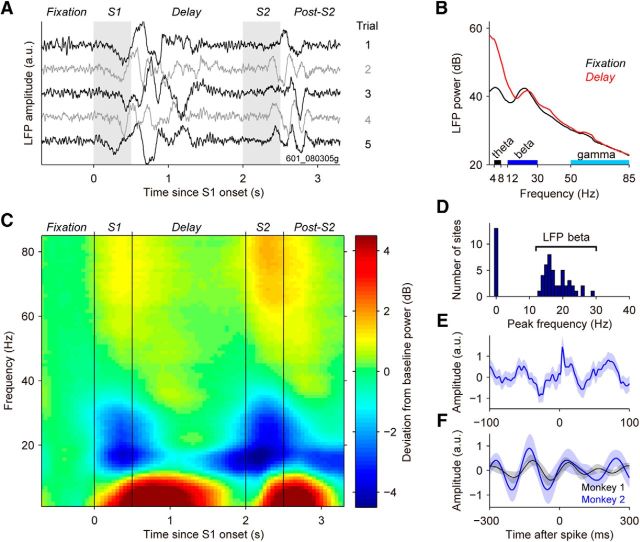
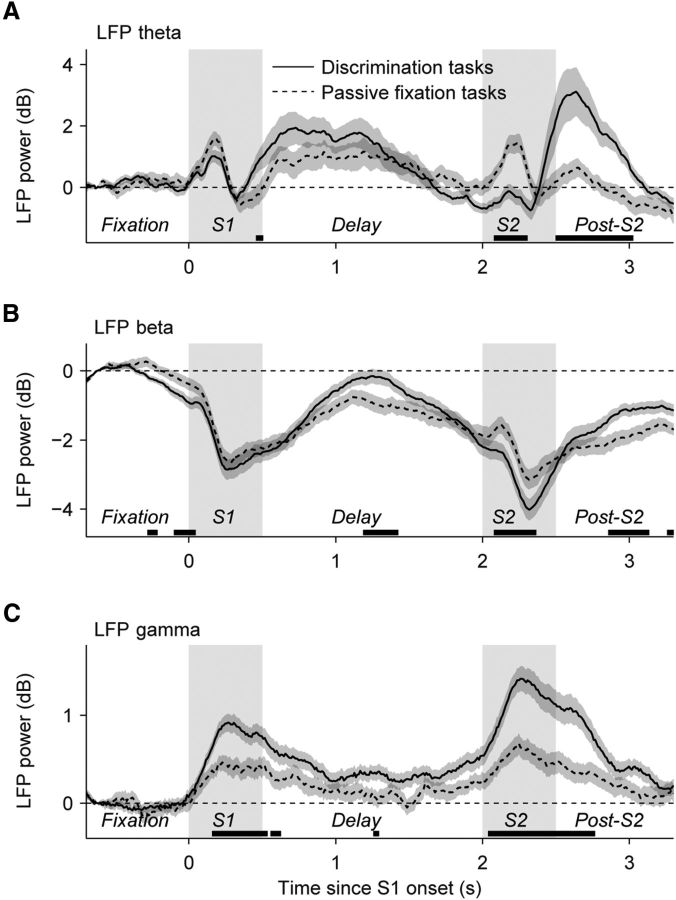
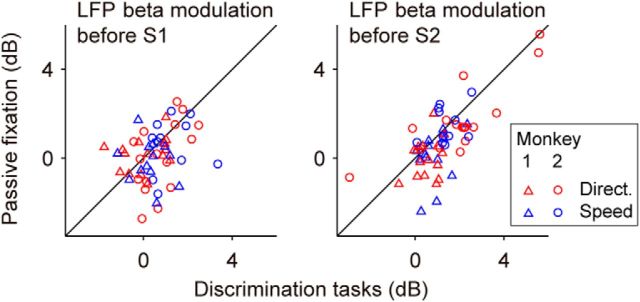
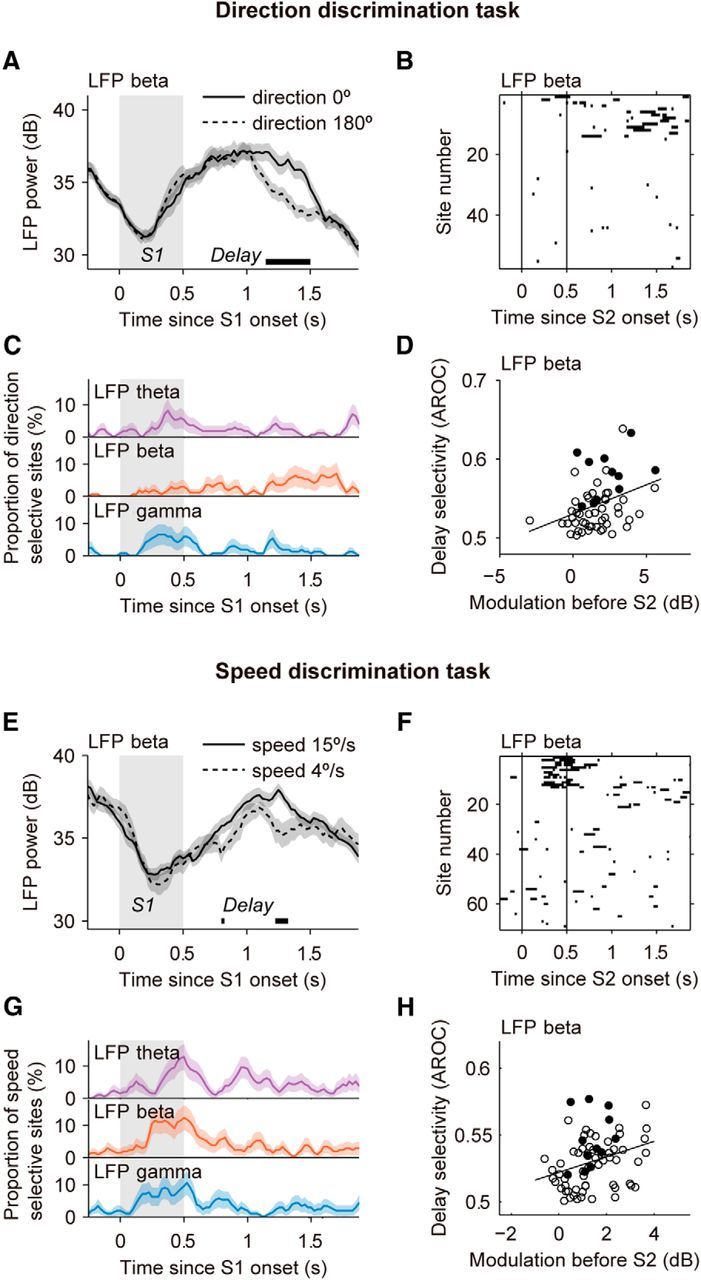
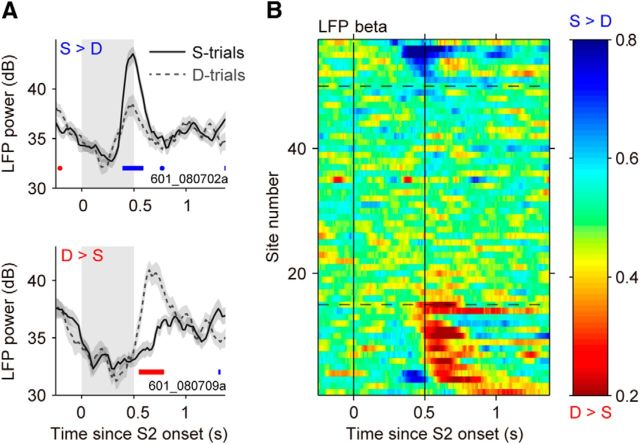
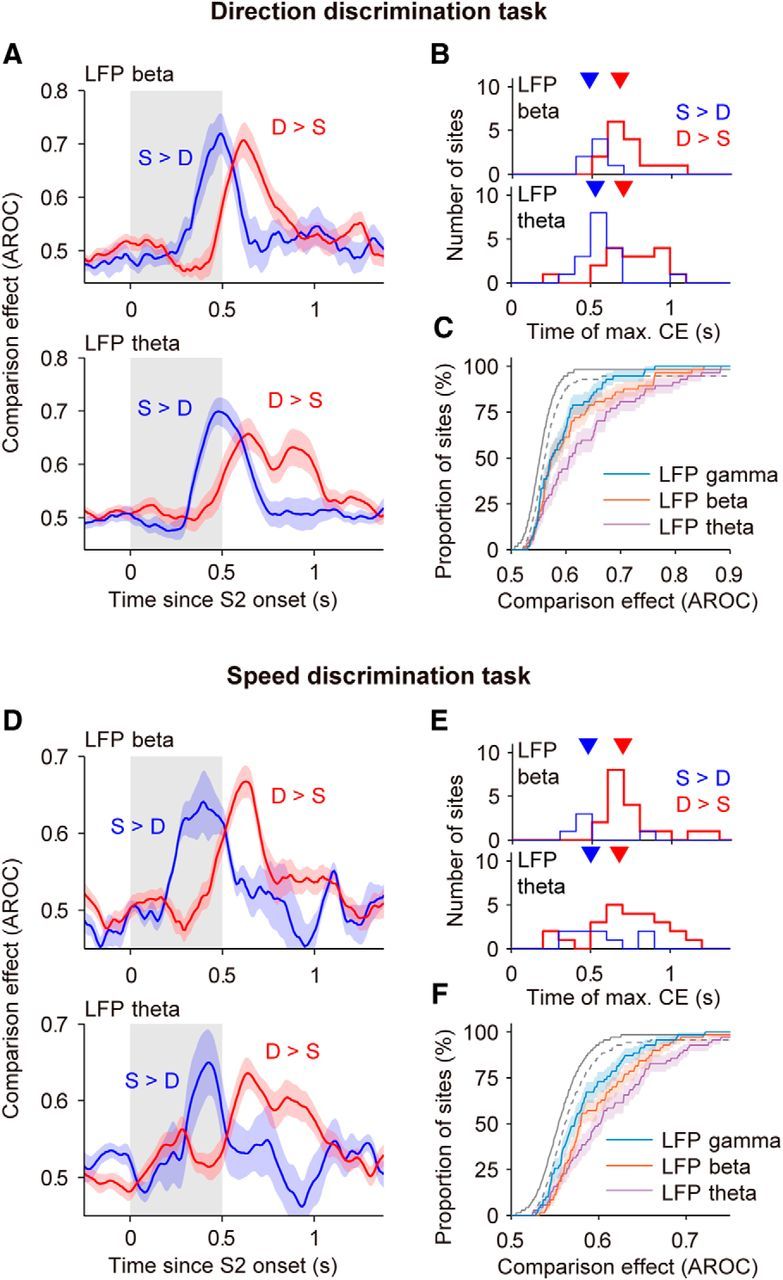
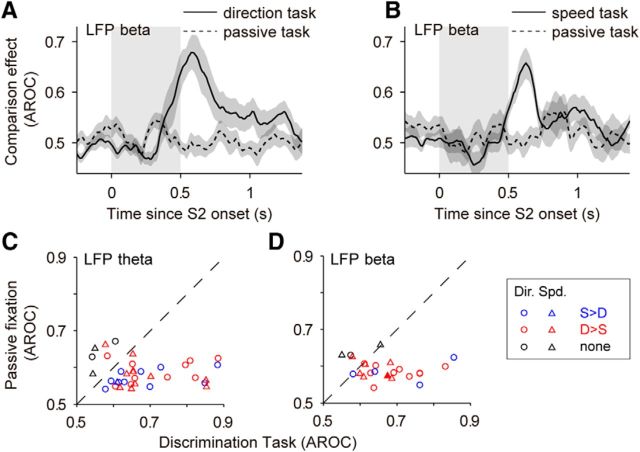
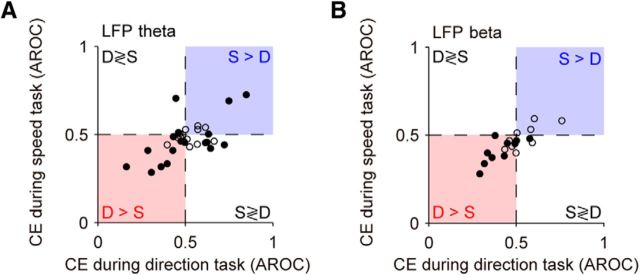
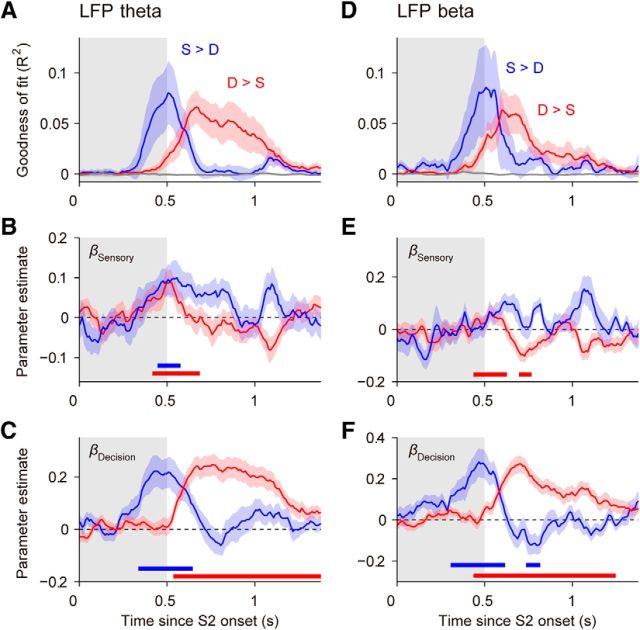
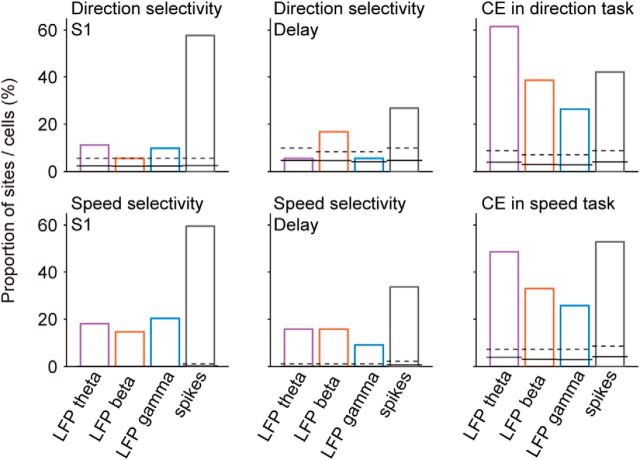
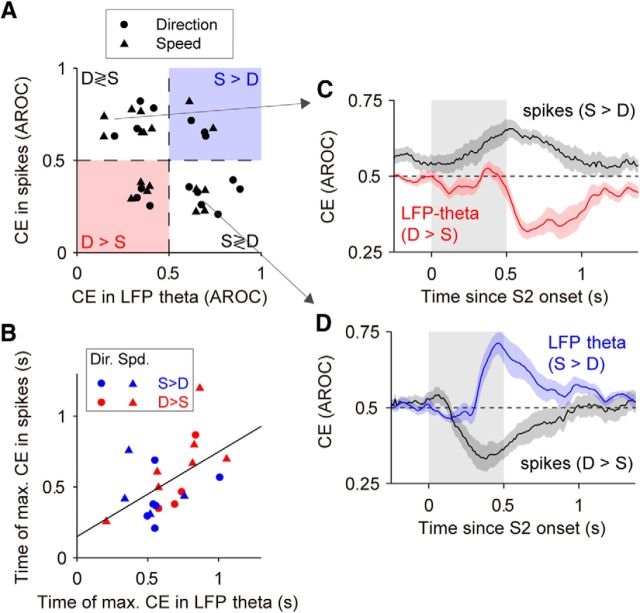
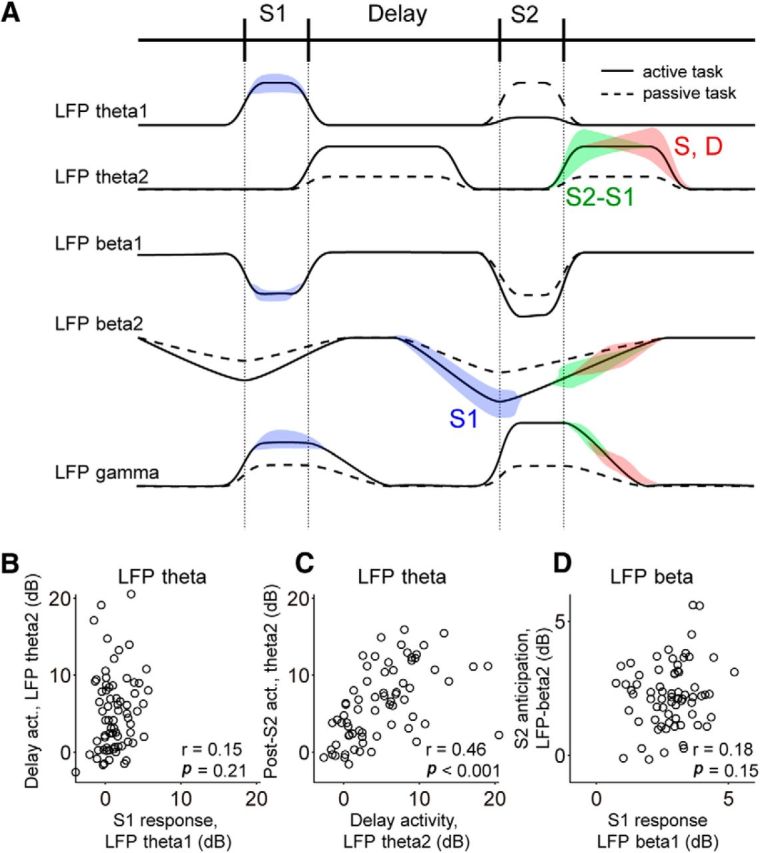
Neuronal activity in the lateral prefrontal cortex (LPFC) reflects the structure and cognitive demands of memory-guided sensory discrimination tasks. However, we still do not know how neuronal activity articulates in network states involved in perceiving, remembering, and comparing sensory information during such tasks. Oscillations in local field potentials (LFPs) provide fingerprints of such network dynamics. Here, we examined LFPs recorded from LPFC of macaques while they compared the directions or the speeds of two moving random-dot patterns, S1 and S2, separated by a delay. LFP activity in the theta, beta, and gamma bands tracked consecutive components of the task. In response to motion stimuli, LFP theta and gamma power increased, and beta power decreased, but showed only weak motion selectivity. In the delay, LFP beta power modulation anticipated the onset of S2 and encoded the task-relevant S1 feature, suggesting network dynamics associated with memory maintenance. After S2 onset the difference between the current stimulus S2 and the remembered S1 was strongly reflected in broadband LFP activity, with an early sensory-related component proportional to stimulus difference and a later choice-related component reflecting the behavioral decision buildup. Our results demonstrate that individual LFP bands reflect both sensory and cognitive processes engaged independently during different stages of the task. This activation pattern suggests that during elementary cognitive tasks, the prefrontal network transitions dynamically between states and that these transitions are characterized by the conjunction of LFP rhythms rather than by single LFP bands.

Significance statement: Neurons in the brain communicate through electrical impulses and coordinate this activity in ensembles that pulsate rhythmically, very much like musical instruments in an orchestra. These rhythms change with "brain state," from sleep to waking, but also signal with different oscillation frequencies rapid changes between sensory and cognitive processing. Here, we studied rhythmic electrical activity in the monkey prefrontal cortex, an area implicated in working memory, decision making, and executive control. Monkeys had to identify and remember a visual motion pattern and compare it to a second pattern. We found orderly transitions between rhythmic activity where the same frequency channels were active in all ongoing prefrontal computations. This supports prefrontal circuit dynamics that transitions rapidly between complex rhythmic patterns during structured cognitive tasks.

Keywords: attention; decision making; motion discrimination; prefrontal; visual perception; working memory.


Figures

Figure 1.
Figure 1.
Behavioral tasks and behavioral performance. A, Behavioral tasks. Monkeys report either whether the direction (top) or the speed (bottom) of two consecutive random-dot motion stimuli (S1 and S2) were the same or different by pressing one of the two response buttons. The animals were allowed to respond 1000 ms after the termination of the second stimulus (S2). Stimulus speed did not change in the direction task, and stimulus direction did not change in the speed task. Task difficulty was controlled by varying the direction (speed) differences between S1 and S2. During the corresponding passive fixation tasks (data not shown), stimulus conditions were identical but the monkeys were rewarded for maintaining fixation throughout the trial without a choice report. Each task was signaled by a different fixation target. B, Percentage of different reports (left button presses) for two monkeys performing the direction (top) and the speed discrimination task (bottom) as a function of the difference between S1 and S2. For the direction task, the stimulus difference was the direction difference between S1 and S2 and data were collected during 57 recording sessions with 10,897 trials in total. For the speed task, the stimulus difference was the relative speed difference Δv/v, where v is the base speed (2 or 4°/s), and data were collected during 70 recording sessions with 14,649 trials.
Figure 2.
Figure 2.
Modulation of LFPs in the LPFC during the direction comparison task. A, Single-trial LFPs from a sample site (601_080305g) recorded during the direction discrimination task. Shadings indicate the stimulus periods. B, Trial-averaged LFP power spectrum (N = 175 trials) in the fixation and the delay periods of the same recording site as in A. C, Population-averaged spectrogram (N = 57 sites recorded in both monkeys) for the direction discrimination task. Spectrograms (window size, 500 ms) were normalized to the baseline activity at t = −0.5 s (relative to S1 onset), and then averaged across sites. D, Histogram of the peak frequency during fixation. A majority of sites (N = 44 of 57 sites) showed a peak in LFP power in the beta range (average peak frequency ± SEM, 18.1 ± 0.6 Hz). E, Population-average of the spike-triggered average (STA) of the LFP obtained during the fixation period (N = 47 STA LFPs for neurons with a sufficient number of spikes, from 44 recording sites; see Materials and Methods) showed the locking of spikes and LFP oscillations in the beta range. F, Population average of the STA of the LFP, filtered to reveal the relationship between spike timing and LFP-theta oscillations (see Materials and Methods). The locking between LFPs and spikes was stronger in Monkey 2 but also present in Monkey 1. Error bars are the SEMs obtained using bootstrap.
Figure 3.
Figure 3.
LFP power in the theta, beta, and gamma bands reflects task engagement. A–C, Average time course of the spectral power in the theta, beta, and gamma frequency bands (4–8, 12–30, and 50–85 Hz, respectively) during the task condition and during passive fixation (window size, 250 ms). LFP power in each frequency band was normalized by subtracting the power during the fixation period (at t = −0.625 s relative to S1 onset) for each site. We included data for sites for which both active tasks (direction task, N = 31; speed task, N = 24) and the corresponding passive fixation task were available. Shadings indicate the stimulus periods. Error bars are the SEMs obtained using bootstrap. Black horizontal lines along the x-axis indicate periods of significant differences (p < 0.05; permutation tests).
Figure 4.
Figure 4.
Enhanced beta modulation in the prestimulus intervals during discrimination tasks. Modulation of LFP beta before the onset of stimulus S1 (left) and stimulus S2 (right) was reduced during the passive fixation task. Pre-S1 (pre-S2) beta modulation was defined as the difference of LFP-beta power in 250 ms windows between the middle of the fixation (delay; 625 ms before the corresponding stimulus onset) and the onset of S1 (S2); see Materials and Methods for details. Each data point corresponds to the beta modulation for one site, with different symbols denoting data obtained from Monkey 1 (▵; N = 28 sites) and Monkey 2 (○; N = 27 sites).
Figure 5.
Figure 5.
Selectivity for motion direction and speed during the S1 and delay periods. A, Example site (601_070926g) showing stimulus-selective LFP-beta activity during the delay phase of the direction comparison task for trials with S1 stimuli moving in opposite directions (thick horizontal line; p < 0.01). B, Direction selectivity in the beta band for all sites (N = 57), quantified using ROC analysis for each time bin (window size T = 250 ms; see Materials and Methods). Point-wise significance was tested with permutation tests (AROC different from 0.5; p < 0.01). C, Incidence of sites with significant direction selectivity in the theta, beta, and gamma bands in the population (N = 57). D, Relationship between modulation of LFP beta before the onset of stimulus S2 (Fig. 4) and direction selectivity at the end of the delay, from t = 1.375 to 1.875 s after S1 onset. Filled circles indicate sites that were classified as significantly delay-selective (see Materials and Methods). E, Example site (601_080725b) showing stimulus-selective LFP-beta activity during the delay in the speed comparison task, for trials in which the S1 stimuli moved either at 4 or 15°/s. F–H, Same as B–D but for speed selectivity (N = 70 sites). Speed selectivity was weak but above chance level in all three frequency bands during the S1 period and during the delay. As for the direction task, speed selectivity in LFP beta during the delay was correlated with anticipatory modulation before S2 (H). Shadings indicate the stimulus periods. Error bars are the SEM obtained using bootstrap.
Figure 6.
Figure 6.
Two types of CEs during and after the stimulus S2 in the direction task. A, Example LFP-beta responses during S2. Top, This site shows higher LFP power on S-trials containing the same directions in S1 and S2 (S > D). Bottom, This site shows higher LFP power on D-trials containing different directions in S1 and S2 (D > S). Thick horizontal lines indicate periods of significant differences between responses on S-trials and D-trials quantified with ROC analysis (p < 0.05; blue: S > D; red: D > S). B, CE in LFP beta during S2 (N = 57 sites). AROC values >0.5 correspond to higher LFP power in S-trials, and AROC values <0.5 to higher LFP power in D-trials. Sites were sorted by timing and the type of CE. Dashed horizontal lines delimit the sites with significant S > D effect (N = 7 sites) and D > S effect (N = 15 sites).
Figure 7.
Figure 7.
CEs in LFPs in the direction and speed comparison tasks. A, Top, Average CE in LFP beta in the direction task for S > D sites (blue) and D > S sites (red) from Figure 6B. The CE of sites with D > S were reflected above 0.5 (CE′ = 1 − CE; see Materials and Methods). Bottom, Average CE in LFP theta for S > D sites (N = 17) and D > S sites (N = 18). B, Times of maximal CEs in LFP beta and LFP theta. Only significant CEs were used for this analysis. CE reached its maximum earlier in S > D sites (blue and red triangles point to the mean times; LFP beta: 484 vs 676 ms; LFP theta: 530 vs 708 ms; Wilcoxon rank-sum test, LFP beta, p = 0.0038, z = −2.89; LFP theta, p = 0.002, z = −3.09). C, Cumulative distributions of CEs for different frequency bands (N = 57). For each site, we took the average CE in the 300 ms window with the strongest effect. Chance level was estimated from surrogate data with trials shuffled between the two trial types (see Materials and Methods; dark gray line: median cumulative distribution obtained from surrogate data; dashed gray line: 99% percentile of the cumulative distributions obtained from surrogate data). D, Top, LFP beta. Average CEs in the speed task for S > D sites (blue; N = 5) and D > S sites (red; N = 18). Bottom, LFP theta. Average CEs for S > D sites (N = 9) and D > S sites (N = 25). E, Times of maximal CEs in LFP beta (S > D: 475 ms; D > S 694 ms) and LFP theta (S > D: 501 ms; D > S: 681 ms) in the speed task. Latency for D > S sites was significantly longer for both bands (Wilcoxon rank-sum test; LFP beta: p = 0.028, z = −2.20; LFP theta: p = 0.037, z = −2.09). F, Cumulative distributions of CEs for different LFP bands in the speed task (N = 70). For details see C. Colored shadings represent the SEM. The periods of S2 are shown with gray shadings.
Figure 8.
Figure 8.
Attenuation of CEs during the passive fixation task. A, Average CE in LFP beta during the direction task and during passive fixation for sites with significant CE and a sufficient number of trials in both tasks (N = 15 sites). B, Average CE in LFP beta during speed discrimination and during passive fixation (N = 9 sites). C, D, Site-by-site CE in LFP theta (C) and LFP beta (D) during both comparison tasks and during the corresponding passive fixation task. CEs were weaker during the passive task in LFP theta (Wilcoxon test, p = 9.3 × 10⁻⁵, N = 36, z = −3.91) and LFP beta (Wilcoxon test, p = 0.001, N = 24, z = −3.29). The trial-type preference (S > D or D > S) was determined from the task condition. Black symbols (“none”) mark sites that showed a significant CE only during passive fixation and sites that had a significant CE during the passive condition opposite to the CE in the task condition (4 of 36 sites in C; 3 of 24 sites in D).
Figure 9.
Figure 9.
Similar CEs during the direction and the speed discrimination tasks. A, CE in LFP theta across tasks. CEs were measured at the offset of S2 for sites that showed a significant effect in either task (N = 30 sites). CEs in the two tasks were correlated (Pearson's correlation, r = 0.63, p = 2.2 × 10⁻⁴). B, CEs in LFP beta across tasks (N = 19 sites). CEs in the two tasks were correlated (Pearson's correlation, r = 0.82, p = 1.7 × 10⁻⁵). Sites that consistently prefer S > D trials fall in the first quadrant (blue shading), and sites that consistently prefer D > S lie in the third quadrant (red shading). Open circles indicate sites that had a significant effect in only one of the tasks. Filled circles indicate sites that had a significant effect in both tasks.
Figure 10.
Figure 10.
Sensory and decision components of CEs in a linear mixed-effects model. A, Quality of the model fit (R2) for LFP-theta activity after S2 onset, computed separately for S > D sites (blue, N = 17 sites), D > S sites (red, N = 30 sites), and nonselective sites (gray, N = 36 sites). Periods with high R2 indicate those moments in which our model best fits the data. Data from the direction and the speed task were combined. The model incorporates the fixed-effects stimulus difference (βSensory), choice report (βDecision), task (βTask), and their interactions (see Materials and Methods). B, Slopes of the relationship between LFP theta and the sensory predictor variable as a function of time, regressors βSensory(t), for the two linear models in A, corresponding to sites with D > S (red) and sites with S > D (blue). Horizontal bars indicate periods with a significant contribution of βSensory (i.e., a reduced model in which the sensory predictor was removed provided a significantly worse fit to LFP-theta activity than the full model; p < 0.01, log-likelihood ratio test; see Materials and Methods). C, Slopes of the relationship between LFP theta and the decision predictor variable as a function of time, βDecision. D–F, Same as AC for LFP-beta activity, for N = 10 sites with S > D, N = 27 sites with D > S, and N = 46 nonselective sites. Gray shadings indicate the stimulus period S2.
Figure 11.
Figure 11.
Comparison of LFP and spiking activity recorded throughout the task. Incidence of stimulus selectivity during S1 and delay, and CEs during S2 and post-S2 in different LFP bands and spiking activity, in the direction (N = 57 site–neuron pairs) and speed task (N = 70 site–neuron pairs). Statistical significance was determined based on surrogate data with trials shuffled between the relevant conditions (S1 stimulus for selectivity and trial type for CEs). Solid horizontal lines indicate the proportion of significant sites expected by chance and dashed horizontal lines indicate the corresponding 95th percentiles.
Figure 12.
Figure 12.
CEs in LFPs and in spiking activity. A, CE in spiking activity vs LFP theta for site–neuron pairs with significant CE in both measures (N = 33). The majority of site–neuron pairs (N = 21) showed opposite preference for trial type in LFP theta and spikes, resulting in a negative correlation between the CE in spiking activity and in LFP theta (Pearson's correlation, r = −0.36, p = 0.039, N = 33). B, Correlation between the time of maximal CE in spiking activity and the time of maximal CE in LFP theta for sites and neurons with opposite polarity of CE (Pearson's correlation, r = 0.53, p = 0.013, N = 21 sites/cells). Site–neuron pairs with congruent polarity of CE showed no such correlations in the latency of maximal CE (Pearson's correlation, r = 0.03, p = 0.93, N = 12; data not shown). C, D, Average time course of the CE for sites with D > S (S > D) preference in LFP (spikes) and for sites with S > D (D > S) preference in LFP theta (spikes).
Figure 13.
Figure 13.
Sensory and cognitive components are dissociated in individual LFP bands. A, Schematic of our findings, separating putative sensory and cognitive components of LFP theta (LFP-theta1 and LFP-theta2, respectively) and LFP beta (LFP-beta1 and LFP-beta2, respectively). Power modulations are represented as deviations from baseline in the early fixation period. Modulations observed in passive tasks are shown with dashed lines. LFP selectivity to different task parameters is indicated with colored areas (S1 selectivity in blue; difference between S2 and S1 in green; same–different comparison in red). B, Lack of correlation between LFP-theta S1 response and LFP-theta delay activity across sites indicates a dissociation between sensory and cognitive parameters in LFP-theta1 and LFP-theta2, respectively. C, Strong correlation between LFP-theta2 delay and post-S2 activity supports a common substrate for memory and comparison-related processes in LFP theta. D, Absence of correlation between LFP-beta S1 response and pre-S2 LFP-beta drop indicates the dissociation of sensory and cognitive parameters in LFP-beta1 and LFP-beta2, respectively. All data are for Monkey 2, who had significant LFP-theta activity (N = 70) and thus presented all effects shown in A. For the other monkey (N = 57), the results were analogous except that we found some evidence of mixing of sensory and cognitive components in LFP theta, possibly due to the lack of robust theta delay activity in this monkey (LFP theta: S1 response vs delay activity r = 0.58, p < 0.001; delay vs post-S2 activity r = 0.35, p = 0.007; LFP beta: S1 response vs pre-S2 activity r = 0.174, p = 0.19; Pearson's correlation).

References

    1. Bastos AM, Vezoli J, Bosman CA, Schoffelen JM, Oostenveld R, Dowdall JR, De Weerd P, Kennedy H, Fries P. Visual areas exert feedforward and feedback influences through distinct frequency channels. Neuron. 2015;85:390–401. doi: 10.1016/j.neuron.2014.12.018. - DOI - PubMed
    1. Bressler SL, Richter CG. Interareal oscillatory synchronization in top-down neocortical processing. Curr Opin Neurobiol. 2015;31:62–66. doi: 10.1016/j.conb.2014.08.010. - DOI - PubMed
    1. Brincat SL, Miller EK. Frequency-specific hippocampal-prefrontal interactions during associative learning. Nat Neurosci. 2015;18:576–581. doi: 10.1038/nn.3954. - DOI - PMC - PubMed
    1. Britten KH, Shadlen MN, Newsome WT, Movshon JA. The analysis of visual motion: a comparison of neuronal and psychophysical performance. J Neurosci. 1992;12:4745–4765. - PMC - PubMed
    1. Buschman TJ, Miller EK. Top-down versus bottom-up control of attention in the prefrontal and posterior parietal cortices. Science. 2007;315:1860–1862. doi: 10.1126/science.1138071. - DOI - PubMed

Publication types

MeSH terms