. 2016 Jan 13;36(2):532-47.
doi: 10.1523/JNEUROSCI.0578-15.2016.

Decentralized Multisensory Information Integration in Neural Systems

Affiliations

Decentralized Multisensory Information Integration in Neural Systems

Wen-Hao Zhang et al. J Neurosci. .

Abstract

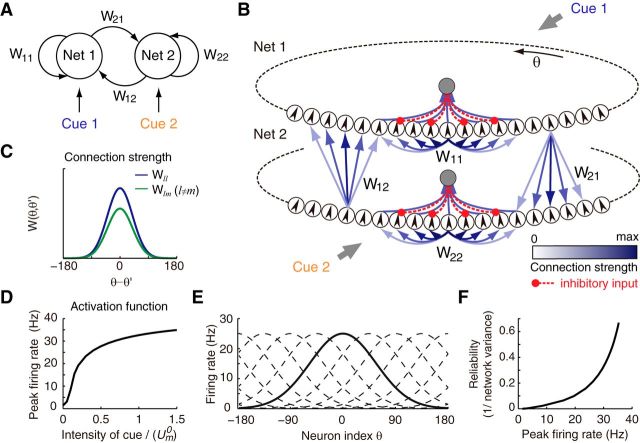
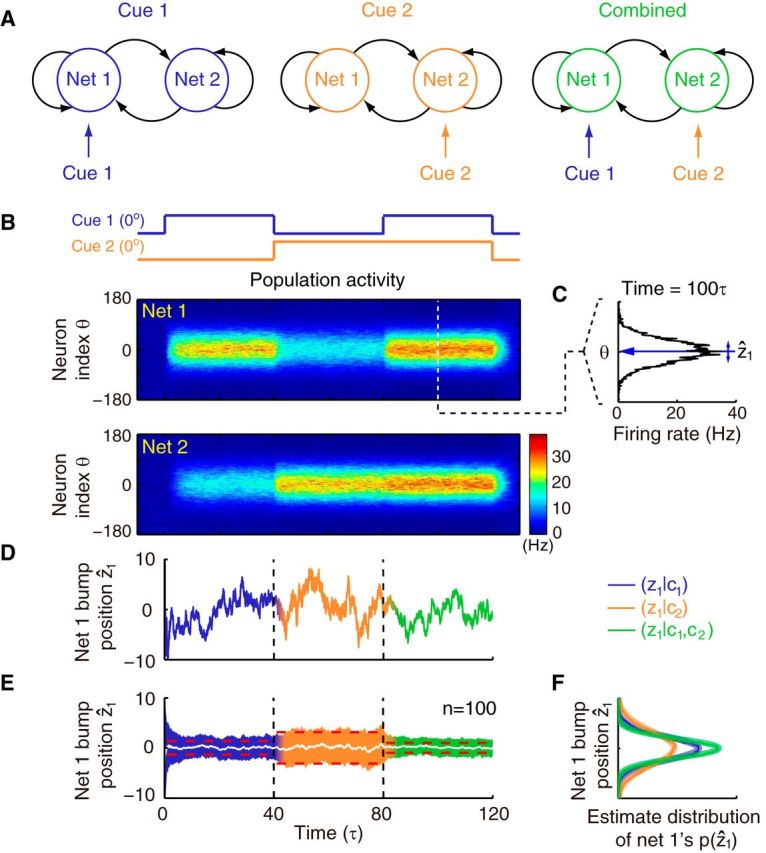
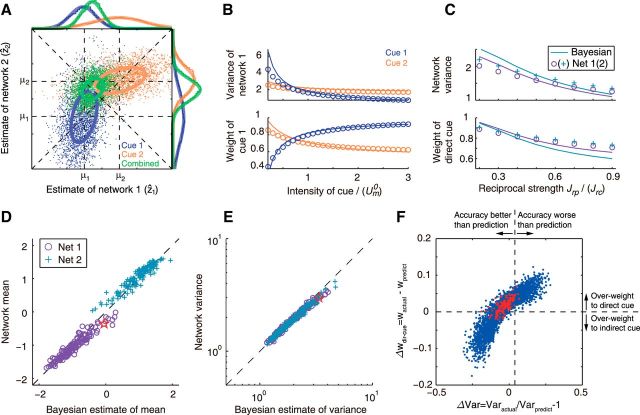
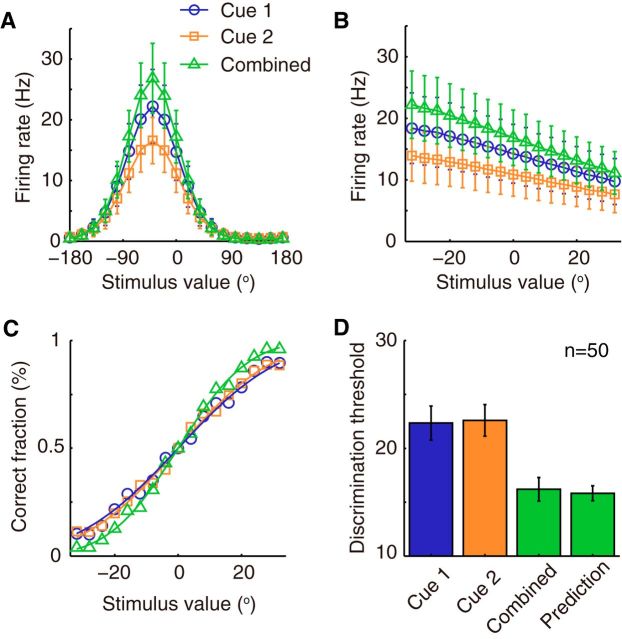
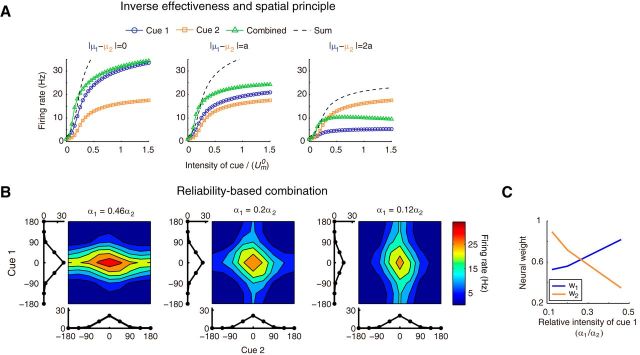
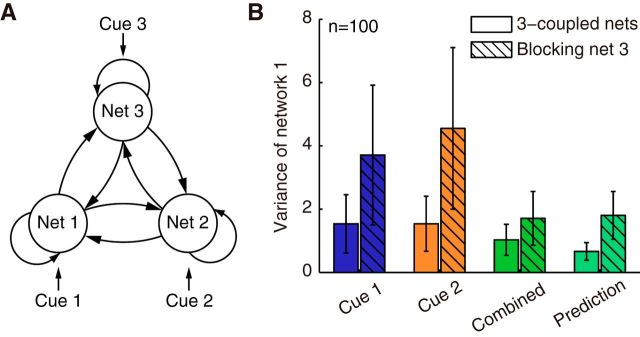
How multiple sensory cues are integrated in neural circuitry remains a challenge. The common hypothesis is that information integration might be accomplished in a dedicated multisensory integration area receiving feedforward inputs from the modalities. However, recent experimental evidence suggests that it is not a single multisensory brain area, but rather many multisensory brain areas that are simultaneously involved in the integration of information. Why many mutually connected areas should be needed for information integration is puzzling. Here, we investigated theoretically how information integration could be achieved in a distributed fashion within a network of interconnected multisensory areas. Using biologically realistic neural network models, we developed a decentralized information integration system that comprises multiple interconnected integration areas. Studying an example of combining visual and vestibular cues to infer heading direction, we show that such a decentralized system is in good agreement with anatomical evidence and experimental observations. In particular, we show that this decentralized system can integrate information optimally. The decentralized system predicts that optimally integrated information should emerge locally from the dynamics of the communication between brain areas and sheds new light on the interpretation of the connectivity between multisensory brain areas.

Significance statement: To extract information reliably from ambiguous environments, the brain integrates multiple sensory cues, which provide different aspects of information about the same entity of interest. Here, we propose a decentralized architecture for multisensory integration. In such a system, no processor is in the center of the network topology and information integration is achieved in a distributed manner through reciprocally connected local processors. Through studying the inference of heading direction with visual and vestibular cues, we show that the decentralized system can integrate information optimally, with the reciprocal connections between processers determining the extent of cue integration. Our model reproduces known multisensory integration behaviors observed in experiments and sheds new light on our understanding of how information is integrated in the brain.

Keywords: continuous attractor neural network; decentralized information integration.


Figures

Figure 1.
Figure 1.
Comparison of different information integration architectures. A, Centralized architecture. A central processor directly receives the raw observations from the sensors, and does all the computations to globally integrate information. B, Distributed architecture. Local processors first compute local estimates, which are subsequently integrated by a central processor to reach a global estimate. C, Decentralized architecture. No central element exists. Each processor first computes a local estimate and then propagates it to others. Information integration is done via cross talk among processors, so that each processor individually arrives at an optimally integrated estimate. D, Example of a decentralized information integration system in the cortex. MSTd and VIP are reciprocally connected with each other. Both areas can optimally integrate visual and vestibular information.
Figure 2.
Figure 2.
Decentralized neural network model for information integration. A, Decentralized information integration system consisting of two reciprocally connected networks, each receiving an independent cue. B, Detailed network structure of the decentralized system in A. Each network module is modeled as a CANN. Small circles represent neurons with preferred feature θ indicated by the arrow inside. An inhibitory neuron pool (the gray circle in the center) sums all activities of excitatory neurons and generates divisive normalization. The blue arrows indicate translation-invariant excitatory connections, with strength represented by color; red lines are inhibitory connections. Each network module receives an independent cue as feedforward input. C, Recurrent and reciprocal connections in the system are translation-invariant; that is, the connection strength between two neurons only depends on their distance in feature space. D, Activation function of network neurons. The saturation for large synaptic input stems from the divisive normalization by the inhibitory neuron pool in each network. E, Population activity is a family of bell-shaped bumps (dashed lines), the position of which is determined by the stimulus (solid lines). F, Peak firing rate (bump height) encodes the reliability of network estimation.
Figure 3.
Figure 3.
Population responses and estimation results of network modules in the decentralized system. A, Illustration of the three stimulus conditions applied to the system. Cue 1 (blue) and cue 2 (orange) are first individually presented to network 1 and network 2, respectively, and then both cues are applied simultaneously (green) in the combined cue condition. B, Averaged population activities over trials of two coupled networks when presenting the stimulus conditions from A in temporal order. Both cues are congruent and static, and centered at 0°. The color encodes firing rate of the population activity. C, Snapshot of the population activity in network 1. The position of the activity bump is considered as the current estimate of the network (1). D, Estimate of network 1 (from the population activity shown in B, computed as indicated in C) fluctuates with time. E, Mean (white line) and SD (colored region) of network 1's estimates averaged over 100 trials. Red dashed lines are theoretical calculations of the SD, which fit well with the simulation results. Note that the variance of the network estimate when presenting two cues decreases compared with that when presenting single cues. Also note that the estimate based on the direct cue has less variance than that based on the indirect cue alone. F, Histograms and Gaussian fits of network 1's estimates under three stimulus conditions represent the posterior of the underlying state. Parameters: Jrc = 0.5Jc, Jrp = 0.5Jrc, and α = 0.5Um0.
Figure 4.
Figure 4.
Optimal information integration in two reciprocally connected networks. A, Example of joint estimations of two networks under three cueing conditions, with the marginal distributions plotted on the margin. B, Estimation variance and weight of cue 1 of network 1 when changing the intensity of either cue and fixing the intensity of another. Symbols: network results; lines: Bayesian prediction. C, Estimation variance and weight of direct cue (feedforward cue) of both networks with reciprocal connection strength. D, E, Comparisons of the mean (D) and variance (E) of the network estimate during the combined cue condition with the Bayesian prediction (Eq. 46 and 47) for different combinations of intensities for two cues (dots). Red star is an example parameter used in Figures 5, 6, and 7. F, Deviations of weight with deviations of variance of network's estimations. Red dots are deviations of network's estimations shown in D and E. Parameters: α1, α2 ∈ [0.4, 1.5]Um0, (BE) Jrc = 0.5Jc, Jrp ∈ 0.5Jrc; (F) Jrc = [0.4, 0.6]Jc, Jrp ∈ [0.2, 0.9]Jrc.
Figure 5.
Figure 5.
Single neurons integrate information optimally. A, Tuning curve of an example neuron in network 1 for the three stimulus conditions. The example neuron prefers −40° stimulus. Error bar indicates the SD of firing rate across trials. B, Responses of the example neuron in a narrow range of stimulus values for the three stimulus conditions. The responses in this small stimulus range are used to perform ROC analysis to estimate the neurometric functions. C, Neurometric functions of the example neuron, which denotes the correct fraction of judging the stimulus to be larger than 0°. Smooth lines show the cumulative Gaussian fit of the neurometric functions. D, Average neuronal discrimination thresholds of the example neuron in three stimulus conditions compared with the Bayesian prediction (Eq. 30). The actual neuronal discrimination thresholds in the case of combined cues are comparable with the Bayesian prediction (p = 0.044, n = 50, unpaired t test). Parameters: Jrc = 0.5Jc, Jrp ∈ 0.5Jrc, α1 = 0.4Um0, α2 = 0.9Um0.
Figure 6.
Figure 6.
Empirical principles of multisensory integration for single neurons. A, Inverse effectiveness and spatial principle. Neuronal responses in the three stimulus conditions (cue 1 or 2 alone and cue 1 and cue 2 together) are plotted as a function of cue intensity, under different disparity between two cues. The differences of two cues are varied from 0 to 2a, where a is the turning width. B, Reliability-dependent combination. The bimodal tuning curves of a probe neuron with varied cue intensities are shown as a contour plot. The two marginal curves around each contour are the unimodal tuning curves. The intensity of cue 1, α1, decreases gradually from left to right, whereas the intensity of cue 2, α2, is fixed. C, Bimodal turning curve fitted as a linear model of the two unimodal turning curves (Eq. 31). The plot shows the weight of the two cues with respect to the relative intensity of cue 1. Parameters are the same as in Figure 5.
Figure 7.
Figure 7.
Information integration in a decentralized system with multiple reciprocally connected networks. A, Architecture of a system consisting of three reciprocally connected networks. The insertion of a third network is done simply by reciprocally connecting network 3 with other networks. B, Robust information integration in three reciprocally connected networks. After blocking network 3 (shaded bars), network 1's estimate in the combined condition is nevertheless still similar to the Bayesian estimate (no significant difference: p = 0.27, n = 80, unpaired t test), although its variance increases. Error bars plot SD of the network estimation variance obtained from 100 trials. Parameters are the same as Figure 5.
Figure 8.
Figure 8.
A, Deviation of network variance with additivity index. The additivity index is the ratio of the peak firing rate (bump height) under combined cue condition and the sum of the two peak firing rates under both single-cue conditions. The parameters are the same as in Figure 4F. B, M-shaped covariance structure between two neurons in decentralized system, which is a symbol of CANN. θ1 and θ2 are the preferred direction of the two neurons. When the stimulus is in between the preferred directions, the two neurons display negative correlation; otherwise, their activities are positively correlated.

Similar articles

Cited by

References

    1. Alais D, Burr D. The ventriloquist effect results from near-optimal bimodal integration. Curr Biol. 2004;14:257–262. doi: 10.1016/j.cub.2004.01.029. - DOI - PubMed
    1. Alvarado JC, Rowland BA, Stanford TR, Stein BE. A neural network model of multisensory integration also accounts for unisensory integration in superior colliculus. Brain Res. 2008;1242:13–23. doi: 10.1016/j.brainres.2008.03.074. - DOI - PMC - PubMed
    1. Avillac M, Denève S, Olivier E, Pouget A, Duhamel JR. Reference frames for representing visual and tactile locations in parietal cortex. Nat Neurosci. 2005;8:941–949. doi: 10.1038/nn1480. - DOI - PubMed
    1. Baizer JS, Ungerleider LG, Desimone R. Organization of visual inputs to the inferior temporal and posterior parietal cortex in macaques. J Neurosci. 1991;11:168–190. - PMC - PubMed
    1. Beck JM, Latham PE, Pouget A. Marginalization in neural circuits with divisive normalization. J Neurosci. 2011;31:15310–15319. doi: 10.1523/JNEUROSCI.1706-11.2011. - DOI - PMC - PubMed

Publication types

LinkOut - more resources