. 2016 Jan 13;36(2):577-89.
doi: 10.1523/JNEUROSCI.2117-15.2016.

Astrocyte-Microglia Cross Talk through Complement Activation Modulates Amyloid Pathology in Mouse Models of Alzheimer's Disease

Affiliations

Astrocyte-Microglia Cross Talk through Complement Activation Modulates Amyloid Pathology in Mouse Models of Alzheimer's Disease

Hong Lian et al. J Neurosci. .

Abstract

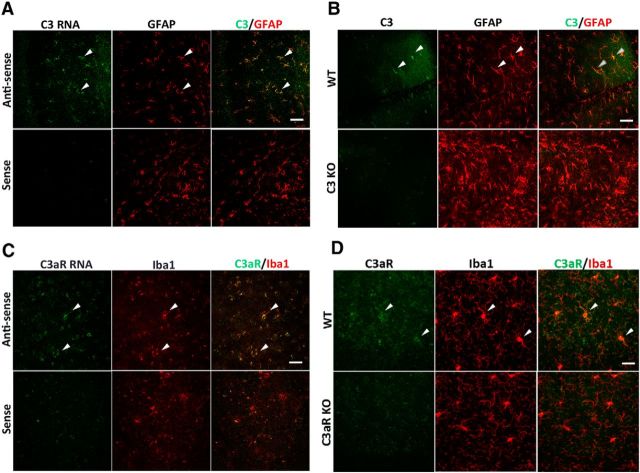
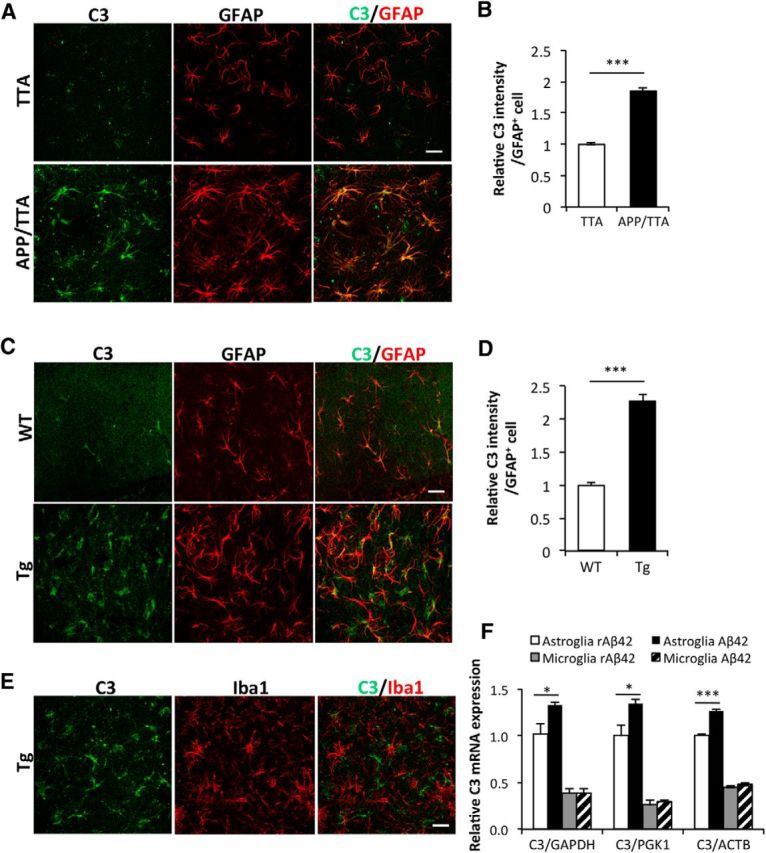
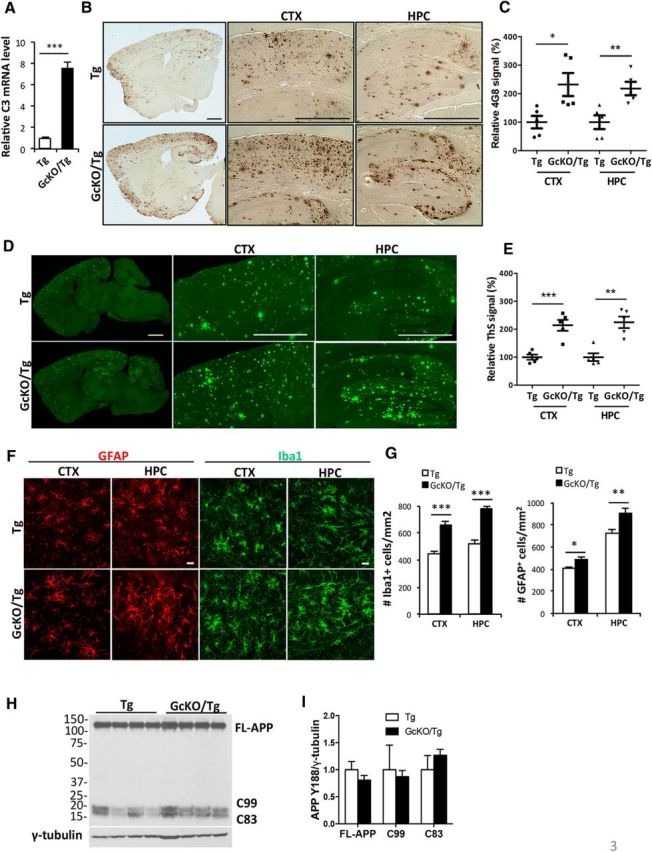
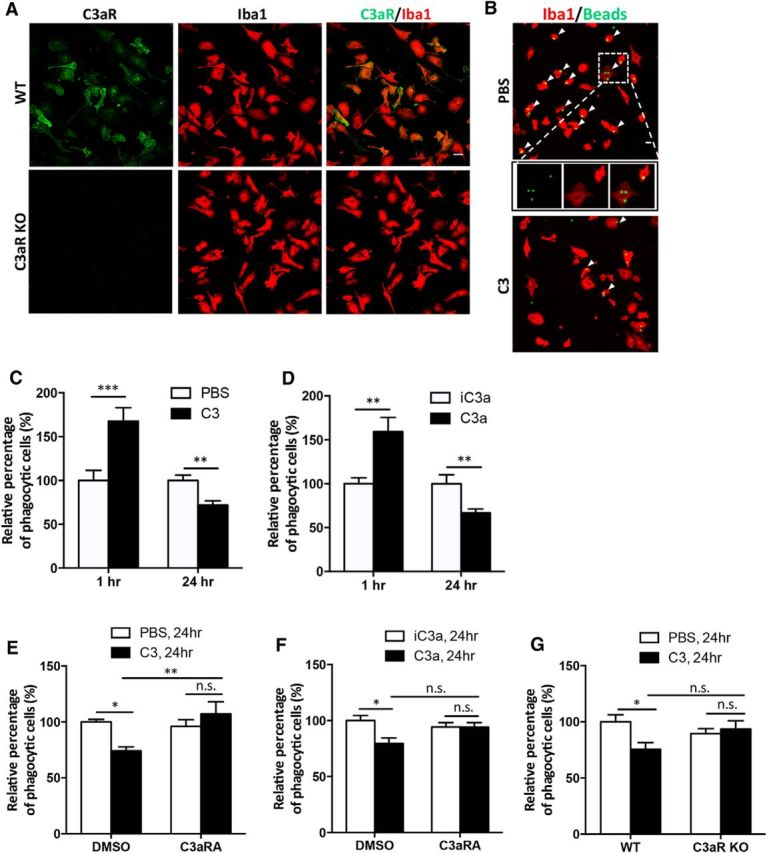
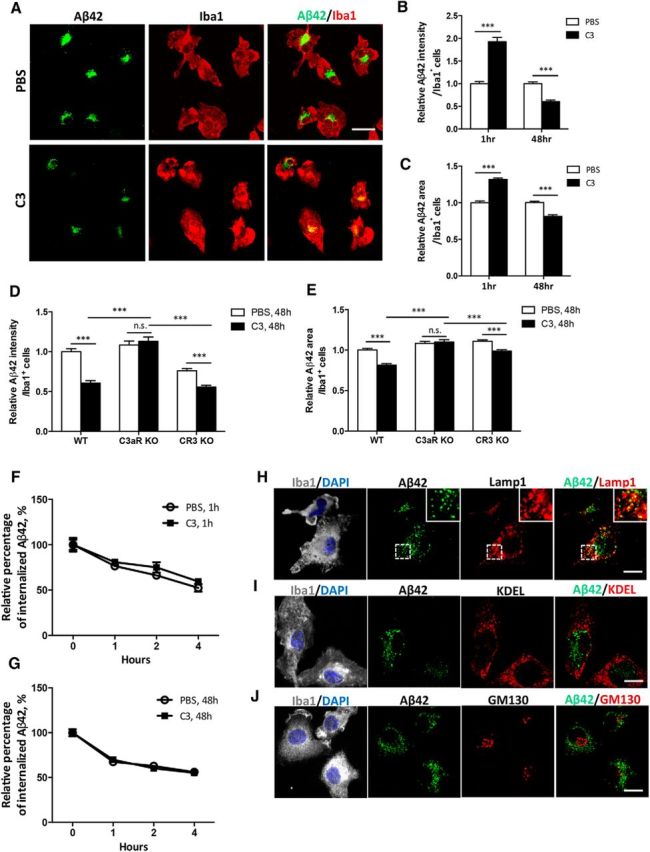
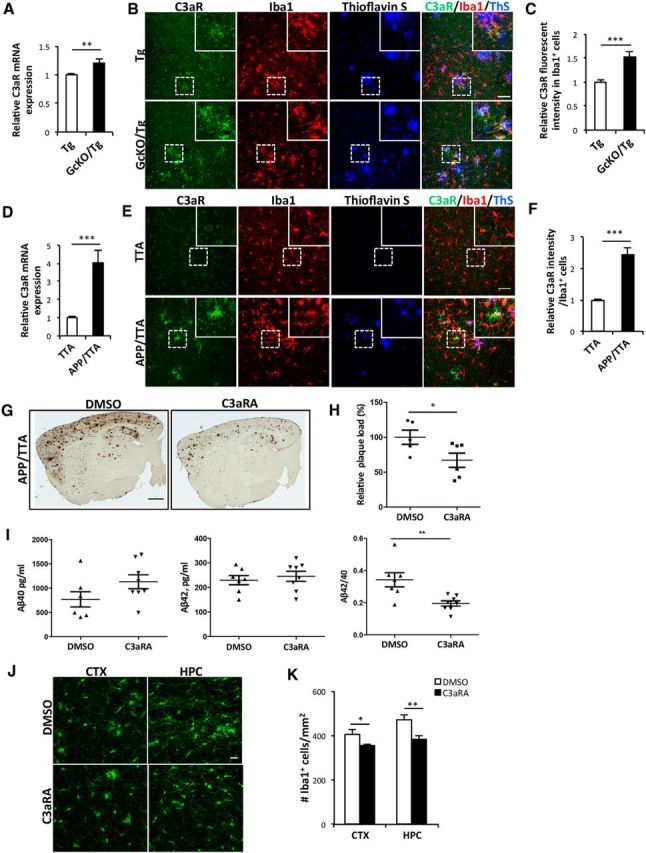
Increasing evidence supports a role of neuroinflammation in the pathogenesis of Alzheimer's disease (AD). Previously, we identified a neuron-glia signaling pathway whereby Aβ acts as an upstream activator of astroglial nuclear factor kappa B (NF-κB), leading to the release of complement C3, which acts on the neuronal C3a receptor (C3aR) to influence dendritic morphology and cognitive function. Here we report that astrocytic complement activation also regulates Aβ dynamics in vitro and amyloid pathology in AD mouse models through microglial C3aR. We show that in primary microglial cultures, acute C3 or C3a activation promotes, whereas chronic C3/C3a treatment attenuates, microglial phagocytosis and that the effect of chronic C3 exposure can be blocked by cotreatment with a C3aR antagonist and by genetic deletion of C3aR. We further demonstrate that Aβ pathology and neuroinflammation in amyloid precursor protein (APP) transgenic mice are worsened by astroglial NF-κB hyperactivation and resulting C3 elevation, whereas treatment with the C3aR antagonist (C3aRA) ameliorates plaque load and microgliosis. Our studies define a complement-dependent intercellular cross talk in which neuronal overproduction of Aβ activates astroglial NF-κB to elicit extracellular release of C3. This promotes a pathogenic cycle by which C3 in turn interacts with neuronal and microglial C3aR to alter cognitive function and impair Aβ phagocytosis. This feedforward loop can be effectively blocked by C3aR inhibition, supporting the therapeutic potential of C3aR antagonists under chronic neuroinflammation conditions.

Significance statement: The complement pathway is activated in Alzheimer's disease. Here we show that the central complement factor C3 secreted from astrocytes interacts with microglial C3a receptor (C3aR) to mediate β-amyloid pathology and neuroinflammation in AD mouse models. Our study provides support for targeting C3aR as a potential therapy for Alzheimer's disease.

Keywords: Alzheimer's disease; C3; C3a receptor; amyloid; mice; microglia.


Figures

Figure 1.
Figure 1.
C3 and C3aR are specifically expressed in astrocytes and microglia, respectively. A, C3 RNA in situ hybridization combined with anti-GFAP antibody staining in 12-month-old wild-type mice. Sense, Sense probe for C3; antisense, antisense probe for C3. B, Representative anti-C3 and anti-GFAP double immunostaining in 3-month-old WT and C3 KO mice. C, C3aR RNA in situ hybridization combined with anti-Iba1 antibody staining in 12-month-old wild-type mice. Sense, Sense probe for C3aR; antisense, antisense probe for C3aR. D, Representative anti-C3aR and anti-Iba1 coimmunostaining in 3-month-old WT and C3aR KO mice. Arrowheads mark representative colocalized cells. Scale bars: 50 μm.
Figure 2.
Figure 2.
Astrocytic C3 upregulation in APP transgenic mice. A, C, Representative double immunostaining for C3 and astrocytic marker GFAP in the hippocampus of APP/TTA transgenic mice at 8 months of age (A) and APP/PS1 transgenic (Tg) animals at 18 months (C). Littermate TTA and WT mice were used as controls for bigenic APP/TTA and Tg mice, respectively. B, D, Quantification of C3 fluorescence intensity in GFAP+ cells in APP/TTA (B) or Tg (D) hippocampal regions. N = 126 (TTA), 145 (APP/TTA), 87 (WT), 88 (Tg) cells collected randomly from sections of three animals per genotype. E, Representative double immunostaining for C3 and microglial marker Iba1 in the hippocampus of Tg animals. F, qPCR measurement of C3 mRNA levels in WT primary astroglial and microglial cultures treated with 100 nm Aβ42 or reverse peptide (rAβ42). Three internal controls (GAPDH, PGK1, and ACTB) were used. N = 3 cultures per condition. Scale bars: 50 μm. *p ≤ 0.05; ***p ≤ 0.001 (B, D, Student's t test; F, two-way ANOVA followed by Bonferroni's post hoc analysis).
Figure 3.
Figure 3.
Astrocyte-specific NF-κB/C3 activation increases amyloid burden and exacerbates reactive gliosis in APP/PS1 transgenic (Tg) mice. A, qPCR measurement of C3 mRNA levels in Tg animals with astrocyte-specific IκBα deletion and NF-κB/C3 activation (GcKO/Tg) and Tg mice alone. N = 3 animals per genotype. B, Representative DAB immunostaining of amyloid plaques in Tg and GcKO/Tg animals using the rabbit anti-Aβ antibody. CTX, Cortex; HPC, hippocampus. C, Quantification of plaque load in the CTX and HPC of Tg and GcKO/Tg animals. N = 5 animals per genotype, 4–5 sections per mouse. D, Representative Thioflavin S (ThS) staining of amyloid plaques in the CTX and HPC of Tg and GcKO/Tg animals. E, Quantification of ThS-positive signals in the CTX and HPC of Tg and GcKO/Tg animals. N = 5 animals per genotype, 4–5 sections per mouse. F, Representative GFAP and Iba1 immunostaining in CTX and HPC of Tg and GcKO/Tg animals. G, Quantification of GFAP+ and Iba1+ cells in the CTX and HPC. N = 16 sections per genotype (GFAP), N = 13 sections per genotype (Iba1). H, I, Western blot analysis of FL-APP and its C-terminal fragments C83 and C99 using the APP Y188 antibody in Tg and GcKO/Tg animals (H) and its quantification (I, nonsignificant). Scale bars: B, D, 1 mm; F, 20 μm. *p ≤ 0.05; **p ≤ 0.01; ***p ≤ 0.001 (two-tailed Student's t test). Filled circle, Tg CTX; filled square: GcKO/Tg CTX; filled triangle, Tg HPC; filled reverse triangle, GcKO/Tg HPC.
Figure 4.
Figure 4.
C3 and C3aR signaling modulates microglial phagocytosis in vitro. A, Double immunostaining for C3aR and Iba1 in WT and C3aR KO primary microglia. B, Representative images of fluorescent bead uptake in primary WT microglial cultures treated with PBS or 10 μg/ml C3 for 24 h. Microglia are labeled with an anti-Iba1 antibody in red, and beads are labeled with green fluorescence. Examples of phagocytic Iba1+ cells with internalized beads are marked by arrowheads, with one PBS-treated cell (inset) shown in higher-magnification views. C, Relative percentage of phagocytic microglia following 1 or 24 h of vehicle (PBS) or C3 (10 μg/ml) treatment. D, Relative percentage of phagocytic microglia following 1 or 24 h of control (iC3a) or C3a (100 nm) treatment. E, Relative percentage of phagocytic microglia after 24 h PBS or C3 treatment in the presence of 10 μm C3aRA or DMSO vehicle. F, Relative percentage of phagocytic microglia after 24 h iC3a or C3a treatment in the presence of 10 μm C3aRA or DMSO vehicle. G, Relative percentage of phagocytic cells in WT or C3aR KO microglia treated with PBS or C3 for 24 h. N = 12 random fields for each data point; each field contained >100 cells. Scale bars: 20 μm. *p ≤ 0.05; **p ≤ 0.01; ***p ≤ 0.01 (C, D, Student's t test; E–G, two-way ANOVA followed by Bonferroni's post hoc analysis; n.s., nonsignificant.
Figure 5.
Figure 5.
Complement activation mediates microglial phagocytosis of Aβ in vitro. A, Representative images of fluorescent FAM-labeled Aβ42 peptide uptake in primary wild-type microglial cultures treated with vehicle (PBS) or 10 μg/ml C3 for 48 h. Microglia are marked by Iba1 immunoreactivity in red; Aβ42 is labeled with green fluorescence. B, C, Quantification of relative Aβ42 fluorescence intensity per Iba1-positive cell (B) and percentage of Aβ42+ area within each cell (C) in microglial cultures treated with PBS or 10 μg/ml C3 for 1 h or 48 h. N = 165 cells (PBS, 1 h); N = 151 (C3, 1 h); N = 164 (PBS, 48 h); N = 158 (C3, 48 h). D, E, Quantification of relative Aβ42 fluorescence intensity per Iba1+ cell (D) and percentage of Aβ42+ area within each cell (E) in primary WT, C3aR KO, and CR3 KO microglia exposed to FAM-labeled Aβ42 after 48 h of PBS or C3 treatment. N = 164 cells (WT); N = 112 (C3aR KO); N = 154 (CR3 KO). F, G, Aβ42 degradation assay by application of the peptide to 1 h (F) or 48 h (G) PBS- or C3-treated microglial cultures and by measuring relative intracellular Aβ42 levels immediately after (0 h) and at 1, 2, and 4 h later. The experiments were performed in triplicate. H–J, Coimmunostaining of Iba1 and lysosome marker Lamp1 (H), ER marker KDEL (I), and cis-Golgi network marker GM130 (J) in primary WT microglia following 48 h C3 treatment and 1 h incubation with FAM-labeled Aβ. The Iba1/DAPI are merged z-stack images; all others are taken from a single z position to test colocalization. Insets in H are enlarged views of the bracketed areas within each image. Scale bars: A, 20 μm; H–J, 10 μm. ***p ≤ 0.001 (B, C, Student's t test; D, E, two-way ANOVA followed by Bonferroni's post hoc analysis; n.s., nonsignificant). F, G, Linear regression followed by F test (p > 0.5).
Figure 6.
Figure 6.
C3aR inhibition ameliorates amyloid pathology. A, qPCR measurement of C3aR mRNA in Tg and GcKO/Tg mouse brains. N = 6/group. B, Representative double immunostaining for C3aR and Iba1 with amyloid plaques labeled by Thioflavin S in cortical sections from 18-month-old Tg and GcKO/Tg mice. C, Quantification of relative C3aR immunofluorescence intensity in Iba1+ cells from Tg and GcKO/Tg mice brain sections. N = 40 cells (Tg); N = 35 (GcKO/Tg). Random sections were selected for analysis from three animals per genotype. D, qPCR measurement of C3aR mRNA in TTA and APP/TTA mouse brains. N = 6 animals (TTA); N = 7 (APP/TTA). E, Representative double immunostaining for C3aR and Iba1 with amyloid plaque labeled by Thioflavin S in cortical sections from 8-month-old TTA and APP/TTA mice. F, Quantification of relative C3aR immunofluorescence intensity in Iba1+ cells from TTA and APP/TTA brain sections. N = 35 cells (TTA); N = 28 (APP/TTA). Random sections were selected for analysis from three animals per genotype. G, Representative immunostaining of amyloid plaques in APP/TTA mice treated with vehicle (DMSO) or 1 mg/kg C3aRA. H, Quantification of plaque load in the forebrain of DMSO- or C3aRA-treated animals. N = 6 animals/genotype/treatment, 2–4 sections per mouse. I, Levels of RIPA-extracted Aβ40 and Aβ42 and the Aβ42/40 ratio in DMSO- or C3aRA-treated APP/TTA mice. N = 6 animals/genotype/treatment. J, Representative Iba1 immunostaining in the CTX and HPC of APP/TTA animals treated with DMSO or C3aRA. K, Number of Iba1+ cells in the CTX and HPC of APP/TTA animals treated with DMSO or C3aRA. N = 11 sections (CTX, APP/TTA, DMSO); N = 12 (CTX, APP/TTA, C3aRA); N = 12 (HPC, APP/TTA, DMSO); N = 16 (CTX, APP/TTA, C3aRA). Scale bars: B, E, 50 μm; G, 1 mm; J, 20 μm. *p ≤ 0.05; **p ≤ 0.01; ***p ≤ 0.001 (Student's t test).

Similar articles

Cited by

References

    1. Ames RS, Lee D, Foley JJ, Jurewicz AJ, Tornetta MA, Bautsch W, Settmacher B, Klos A, Erhard KF, Cousins RD, Sulpizio AC, Hieble JP, McCafferty G, Ward KW, Adams JL, Bondinell WE, Underwood DC, Osborn RR, Badger AM, Sarau HM. Identification of a selective nonpeptide antagonist of the anaphylatoxin C3a receptor that demonstrates antiinflammatory activity in animal models. J Immunol. 2001;166:6341–6348. doi: 10.4049/jimmunol.166.10.6341. - DOI - PubMed
    1. Bajenaru ML, Zhu Y, Hedrick NM, Donahoe J, Parada LF, Gutmann DH. Astrocyte-specific inactivation of the neurofibromatosis 1 gene (NF1) is insufficient for astrocytoma formation. Mol Cell Biol. 2002;22:5100–5113. doi: 10.1128/MCB.22.14.5100-5113.2002. - DOI - PMC - PubMed
    1. Bamberger ME, Harris ME, McDonald DR, Husemann J, Landreth GE. A cell surface receptor complex for fibrillar beta-amyloid mediates microglial activation. J Neurosci. 2003;23:2665–2674. - PMC - PubMed
    1. Banda NK, Hyatt S, Antonioli AH, White JT, Glogowska M, Takahashi K, Merkel TJ, Stahl GL, Mueller-Ortiz S, Wetsel R, Arend WP, Holers VM. Role of C3a receptors, C5a receptors, and complement protein C6 deficiency in collagen antibody-induced arthritis in mice. J Immunol. 2012;188:1469–1478. doi: 10.4049/jimmunol.1102310. - DOI - PMC - PubMed
    1. Beg AA, Sha WC, Bronson RT, Baltimore D. Constitutive NF-κB activation, enhanced granulopoiesis, and neonatal lethality in IκBα-deficient mice. Genes Dev. 1995;9:2736–2746. doi: 10.1101/gad.9.22.2736. - DOI - PubMed

Publication types

MeSH terms