. 2016 Jan 12:11:5.
doi: 10.1186/s13024-016-0070-y.

Alzheimer's disease-like APP processing in wild-type mice identifies synaptic defects as initial steps of disease progression

Affiliations

Alzheimer's disease-like APP processing in wild-type mice identifies synaptic defects as initial steps of disease progression

Mickael Audrain et al. Mol Neurodegener. .

Abstract

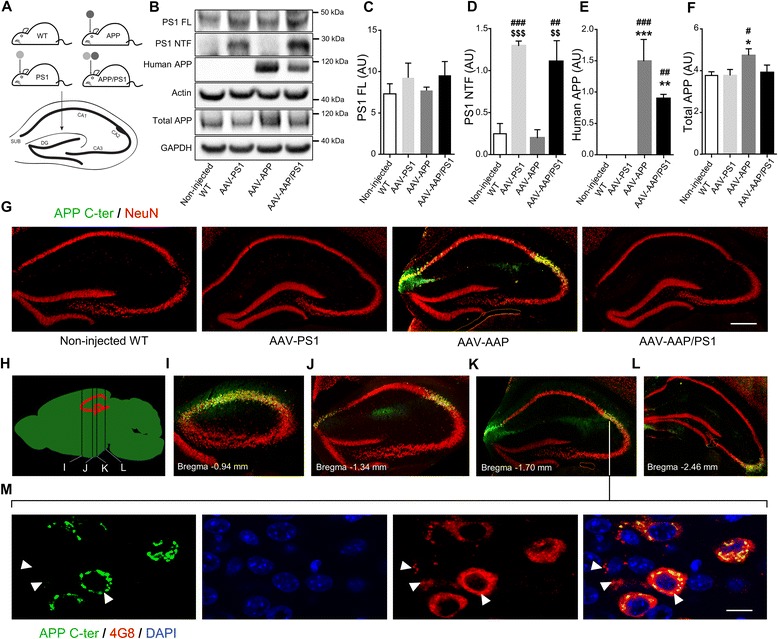
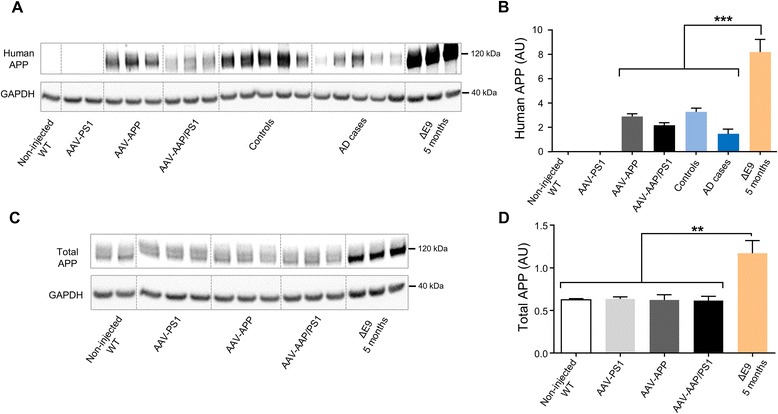
Background: Alzheimer's disease (AD) is the most frequent form of dementia in the elderly and no effective treatment is currently available. The mechanisms triggering AD onset and progression are still imperfectly dissected. We aimed at deciphering the modifications occurring in vivo during the very early stages of AD, before the development of amyloid deposits, neurofibrillary tangles, neuronal death and inflammation. Most current AD models based on Amyloid Precursor Protein (APP) overproduction beginning from in utero, to rapidly reproduce the histological and behavioral features of the disease within a few months, are not appropriate to study the early steps of AD development. As a means to mimic in vivo amyloid APP processing closer to the human situation in AD, we used an adeno-associated virus (AAV)-based transfer of human mutant APP and Presenilin 1 (PS1) genes to the hippocampi of two-month-old C57Bl/6 J mice to express human APP, without significant overexpression and to specifically induce its amyloid processing.

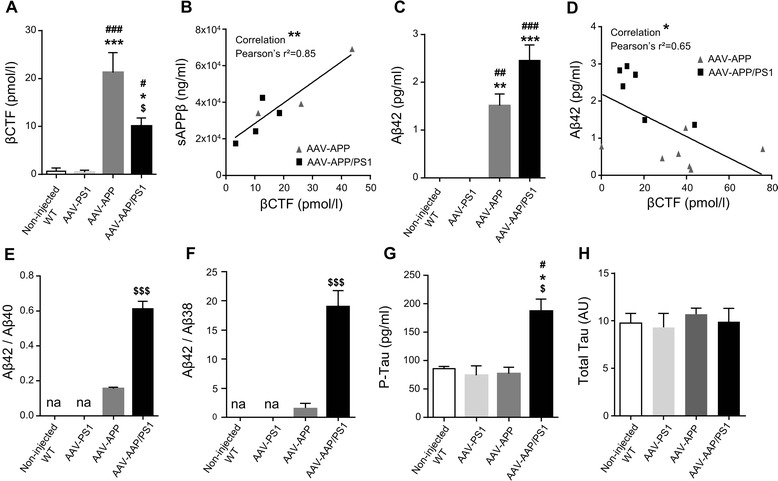
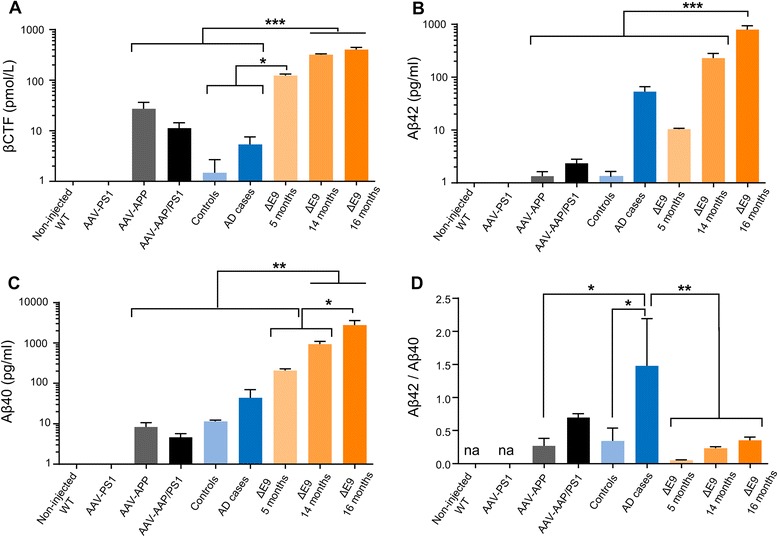
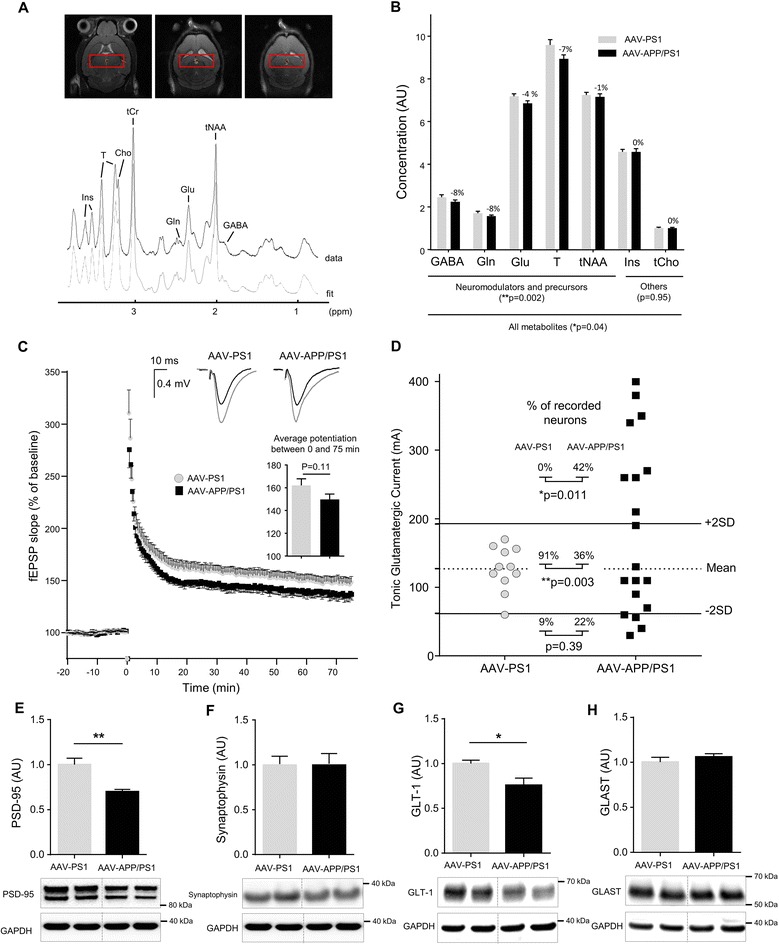
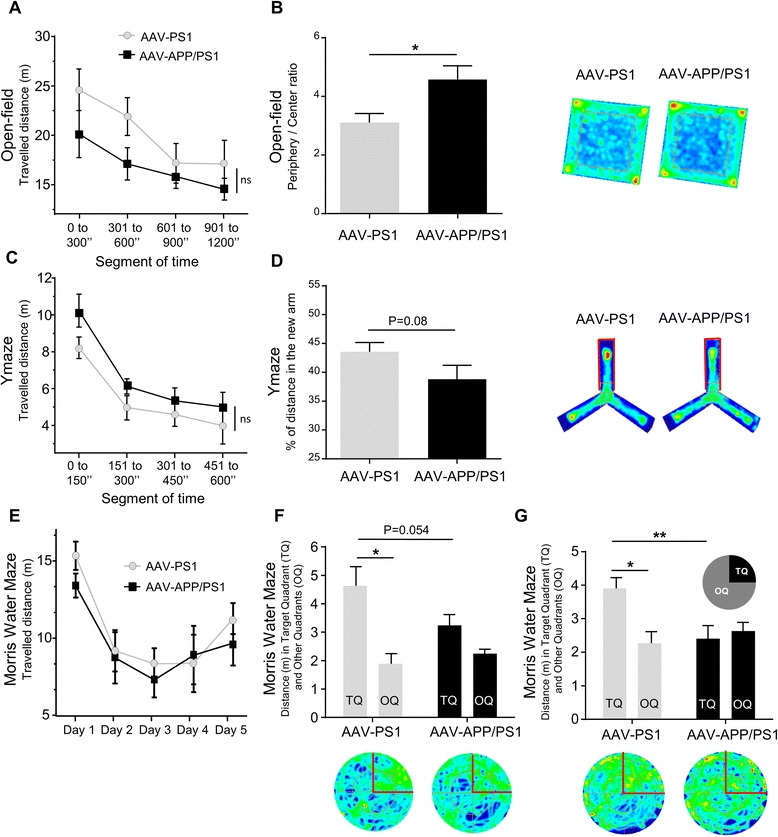
Results: The human APP, βCTF and Aβ42/40 ratio were similar to those in hippocampal tissues from AD patients. Three months after injection the murine Tau protein was hyperphosphorylated and rapid synaptic failure occurred characterized by decreased levels of both PSD-95 and metabolites related to neuromodulation, on proton magnetic resonance spectroscopy ((1)H-MRS). Astrocytic GLT-1 transporter levels were lower and the tonic glutamatergic current was stronger on electrophysiological recordings of CA1 hippocampal region, revealing the overstimulation of extrasynaptic N-methyl D-aspartate receptor (NMDAR) which precedes the loss of long-term potentiation (LTP). These modifications were associated with early behavioral impairments in the Open-field, Y-maze and Morris Mater Maze tasks.

Conclusions: Altogether, this demonstrates that an AD-like APP processing, yielding to levels of APP, βCTF and Aβ42/Aβ40 ratio similar to those observed in AD patients, are sufficient to rapidly trigger early steps of the amyloidogenic and Tau pathways in vivo. With this strategy, we identified a sequence of early events likely to account for disease onset and described a model that may facilitate efforts to decipher the factors triggering AD and to evaluate early neuroprotective strategies.


Figures

Fig. 1
Fig. 1
Stereotactic injection of AAV vectors induces the neuronal expression of human APP and PS1 in the hippocampus of C57BL/6 J mice, 1 month after injection. C57Bl/6 J mice (all males) were injected at 8 weeks of age either with AAV-CAG-PS1M146L (AAV-PS1 mice, n = 4), AAV-CAG-APPSL (AAV-APP mice, n = 4) or both vectors at the same doses as for the other two groups (AAV-APP/PS1 mice, n = 4). Non-injected WT mice (n = 4) were also analyzed. Mice were killed one month later for analyses. a Upper panel: schematic representation of the four groups used. Bottom panel: coronal diagram showing the injection site and the architecture of the mouse hippocampus. b Representative western blots showing the expression of PS1 (full length: PS1 FL and N-terminal fragment: PS1 NTF), human APP (6E10 antibody) and total APP (murine + human forms; APP C-ter antibody) confirming transgene expression 1 month after injection. All western blots were performed on the whole hippocampus (TBS-Tx soluble fraction). c-f Densitometric analyses of western blots showing the expression of PS1 FL (c), PS1 NTF (d), human APP (e) and total APP (f) in the four groups hippocampi 1 month after injection. Note that despite the expression of human APP in the AAV-APP/PS1 group, no significant difference in total APP levels was found between non-injected, AAV-PS1 and AAV-APP/PS1 groups. Bars represent means ± SEM and data were normalized with respect to GAPDH. Statistical analysis was performed by one-way ANOVA followed by Tukey’s post-hoc test where ###, *** and $$$ denote p < 0.001 versus non-injected WT mice, AAV-PS1 mice and AAV-APP mice respectively. ##, ** and $$ denote p < 0.01; # and * denote p < 0.05. g High magnification of a hippocampal coronal section of each group showing neuronal layers (NeuN antibody, red) and the APP expression (APP C-ter antibody, green). Note that the human APP expression in the AAV-APP/PS1 group (see Fig. 1e) is not sufficient to exceed a threshold detectable by immunohistochemistry. The exogenous APP is essentially detected into two areas: the CA2 and subiculum. Scale bar represents 500 μm. h Scheme representing antero-posterior coordinates of coronal sections depicted in (i-l). i-l Immunostaining of APP (APP C-ter antibody, green) and NeuN (red) at different antero-posterior coordinates in AAV-APP mice coronal sections. m Magnified confocal images of an AAV-APP mouse section with double immunofluorescence staining showing the location of APP (APP C-ter antibody, green) and the diffusion of Aβ indicated by arrow heads (4G8 antibody, red) in the CA2 layer. Blue: DAPI. Scale bar represents 10 μm
Fig. 2
Fig. 2
Exogenous human APP is processed following the amyloidogenic pathway, 3 months after injection. C57Bl/6 J mice (all males) were injected at 8 weeks of age either with AAV-CAG-PS1M146L (AAV-PS1 mice), AAV-CAG-APPSL (AAV-APP mice) or both vectors at the same doses as for the other two groups (AAV-APP/PS1 mice, n = 7-8 mice per group). Non-injected WT mice (n = 4) were also analyzed. Mice were killed three months later for analyses of whole hippocampi. a Comparative analysis of TBS-Tx soluble human βCTF levels by ELISA. Note that βCTF levels follow the same pattern of expression than for the human APP in the four different groups (see Fig. 1e). Bars represent means ± SEM. Statistical analysis was performed by one-way ANOVA with Tukey’s post-hoc test where ###, *** denote p < 0.001 versus non-injected WT and AAV-PS1 mice. #, * and $ denote p < 0.05. b Correlation between TBS-Tx soluble human βCTF and sAPPβ levels between AAV-APP and AAV-APP/PS1 mice (n = 7). Linear regression analysis confirms the engagement in the amyloidogenic pathway. Correlation analysis was performed with Pearson’s parametric correlation test: **p < 0.01. c Comparative analysis of TBS-Tx soluble human Aβ42 levels by MSD immunoassay showing higher levels in AAV-APP/PS1 mice (n = 6-8 mice per group). Bars indicate means ± SEM. Statistical analysis was performed by one-way ANOVA followed by Tukey’s post-hoc test where ###, *** denote p < 0.001 versus non-injected WT mice and AAV-PS1 mice. ## and ** denote p < 0.01. d Correlation between TBS-Tx soluble human Aβ42 and βCTF levels between AAV-APP and AAV-APP/PS1 (n = 13). Correlation analysis was performed with Pearson’s parametric correlation test: *p < 0.05. e-f Representation of Aβ42/40 (e) and Aβ42/38 (f) ratios determined by multiplex MSD immunoassay (n = 4 mice per group). Bars indicate means ± SEM. Statistical analysis was performed by one-way ANOVA followed by Tukey’s post-hoc test where $$$ denotes p < 0.001 versus AAV-APP mice. na = not applicable. g Comparative analysis of TBS-Tx soluble murine phosphorylated Tau protein (AT270, Thr181) by ELISA. Bars indicate means ± SEM. Statistical analysis was performed by one-way ANOVA followed by Tukey’s post-hoc test where #, * and $ denote p < 0.05 versus non-injected WT mice, AAV-PS1 mice and AAV-APP mice respectively. h Densitometric analyses of western blots showing the expression of the total Tau protein in each group (n = 4 mice per group). Bars represent means ± SEM and data were normalized with respect to GAPDH
Fig. 3
Fig. 3
AAV-APP/PS1 mice show a production of human APP similar to AD patients, 3 months after injection. C57Bl/6 J mice (all males) were injected at 8 weeks of age either with AAV-CAG-PS1M146L (AAV-PS1 mice, n = 4), AAV-CAG-APPSL (AAV-APP mice, n = 4) or both vectors at the same doses as for the other two groups (AAV-APP/PS1 mice, n = 4). Non-injected WT mice (n = 4) and transgenic APP/PS1ΔE9 mice were also used and all animals were killed at 5 months of age. Human samples were obtained from late-onset AD cases (Braak 6, Thal 5) and age-matched controls. The hippocampus was the structure analyzed for all samples. a Representative western blot of human APP (6E10 antibody) between AAV injected mice (n = 3 per group), human samples (n = 5 per group) and transgenic APP/PS1ΔE9 mice (n = 3). b Densitometric analyses of the antibody immunoreactivity shown in panel (a). Bars represent means ± SEM and data were normalized with respect to GAPDH. Statistical analysis was performed by one-way ANOVA with Tukey’s post-hoc test: ***p < 0.001. Note that AAV-APP/PS1 mice and human AD cases have similar levels. c Representative western blot of total APP (APP C-ter antibody) between non-injected WT, AAV injected and APP/PS1ΔE9 mice. d Densitometric analyses of the antibody immunoreactivity shown in panel c. Bars represent means ± SEM and data were normalized with respect to GAPDH. Statistical analysis was performed by one-way ANOVA with Tukey’s post-hoc test: **p < 0.01
Fig. 4
Fig. 4
AAV-APP/PS1 mice show a production of amyloid derivatives similar to AD patients, 3 months after injection. C57Bl/6 J mice (all males) were injected at 8 weeks of age either with AAV-CAG-PS1M146L (AAV-PS1 mice, n = 4), AAV-CAG-APPSL (AAV-APP mice, n = 4) or both vectors at the same doses as for the other two groups (AAV-APP/PS1 mice, n = 4). Non-injected WT mice (n = 4) and transgenic APP/PS1ΔE9 mice at 5 (n = 3), 14 (n = 8) and 16 (n = 8) months of age were also used. Human samples were obtained from late-onset AD cases (Braak 6, Thal 5) and age-matched controls. The hippocampus was the structure analyzed for all samples. a Comparative analysis of TBS-Tx soluble human βCTF levels by ELISA. Statistical analysis was performed by one-way ANOVA with Tukey’s post-hoc test: ***p < 0.001. A logarithmic scale was used. Note that AAV-APP/PS1 mice and human AD cases have similar levels. b-c Quantification (6E10 based MSD immunoassay detecting human Aβ species) of TBS-Tx soluble human Aβ42 (b) and Aβ40 (c). Statistical analysis was performed by one-way ANOVA with Tukey’s post-hoc test: ***p < 0.001, **p < 0.01. Note that AAV-APP/PS1 injected mice show higher levels of Aβ42 compared to human controls and reduced levels compared to late stage human cases. d Representation of the Aβ42/40 ratio. Note that no significant difference was detectable between AAV-APP/PS1 mice and human AD cases
Fig. 5
Fig. 5
AAV-APP/PS1 mice present synaptic defects, 3 months after injection. C57Bl/6 J mice (all males) were injected at 8 weeks of age either with AAV-CAG-PS1M146L (AAV-PS1 mice used as an injected control group, n = 10) or AAV-CAG-APPSL + AAV-CAG-PS1M146L (AAV-APP/PS1 mice, n = 10). Mice were used for in-vivo (a-b) and ex-vivo (c-d) recording three months later. a Top panel: localization of the spectroscopic volume of 7.2 mm x 2 mm x 2.6 mm encompassing both. Hippocampi of each mouse. Bottom panel: representative 1H-MR spectrum acquired from the hippocampus of a mouse 3 months after injection. b Concentrations of seven metabolites were determined from spectra: GABA, Gln, Glu, T, tNAA, Ins and tCho. Macromolecules and lipids were not included in the study and the values obtained were expressed as ratios relative to tCr (n = 10-11 per group). Bars represent means ± SEM. Statistical analysis was performed by two-way ANOVA with experimental group and metabolites as effects. Note that metabolite levels were significantly lower in AAV-APP/PS1 mice (experimental group effect: p = 0.04). A selective analysis of metabolites linked to neuromodulation and precursors (GABA, Gln, Glu, T, tNAA) increased the significance of the difference between both groups (experimental group effect: p = 0.002). c Long-term potentiation (LTP) over 75 min induced by high-frequency stimulation. The inset graphs represent for each group an example of unit field excitatory postsynaptic potentials (fEPSP) before (black line) and after (gray line) LTP induction. The inset histogram shows average potentiation. Bars represent means ± SEM (n = 15-16 slices from n = 10 mice per group). Statistical analysis was performed with Student’s t-test. d Scatter diagram showing the tonic glutamatergic current recorded at a holding potential of +40 mV (whole cell patch-clamp of CA1 pyramidal cells, n = 11-19/group from n = 10 mice per group). Normal response was characterized in a range comprised between AAV-PS1 mean +/- 2SD. Analysis of AAV-APP/PS1 profile revealed a decrease of number of neurons with normal response (Chi2 test: p = 0.003) in association with an increase of neurons with an high level of Tonic glutamatergic current (Chi2 test: p = 0.011) suggesting this current was stronger in the AAV-APP/PS1 group. e-h Western blot analysis of PSD-95, Synaptophysin, GLT-1 and GLAST. Bars represent means ± SEM and data were normalized with respect to GAPDH. Student’s t-test was used for statistical analysis: *p < 0.05
Fig. 6
Fig. 6
AAV-APP/PS1 mice present memory impairments, 3 months after injection. C57Bl/6 J mice (all males) were injected at 8 weeks of age either with AAV-CAG-PS1M146L (AAV-PS1 mice used as an injected control group, n = 8) or AAV-CAG-APPSL + AAV-CAG-PS1M146L (AAV-APP/PS1 mice, n = 8) and behavioral analyses were performed three months later. a Open-field assay. Travelled distance during the Open-field task showing no significant difference between both groups. b Left panel: time in periphery/time in center ratio showing a change in emotional behavior when faced to a new environment in the AAV-APP/PS1 group (n = 7-8 mice per group). Bars represent means ± SEM. Statistical analysis was performed with Student’s t-test: *p < 0.05. Right panel: group occupancy plots for visualizing the areas in which the animals spent the most time during the test. c Y-maze assay. Travelled distance during the Y-Maze task showing no significant difference between both groups during the test session. d Left panel: percentage of distance in the new arm showing that AAV-APP/PS1 mice spent less time in the new arm than the other groups (p = 0.08; n = 7-8 mice per groups). Bars represent means ± SEM. Statistical analysis was performed with Student’s t-test. Right panel: group occupancy plots for visualizing the areas in which the animals spent the most time during the test. The arm circled in red is the new arm. e Morris Water Maze assay. Travelled distance during the Morris Water Maze task showing no significant difference between both groups during the five training days. f-g Probe trial performance at 4 h (f) and 72 h (g) after the last training session. TQ = target quadrant that housed the platform during the training sessions. OQ = mean of distance covered in the other three quadrants. Note that AAV-APP/PS1 mice were impaired in comparison to AAV-PS1 mice confirmed by no preference for the trained target quadrant. Bars represent means ± SEM. A two way ANOVA was used with experimental group and quadrant as main effects: *p < 0.05, **p < 0.01

References

    1. Selkoe DJ. Alzheimer’s disease: genes, proteins, and therapy. Physiol Rev. 2001;81(2):741–66. - PubMed
    1. Hardy J, Allsop D. Amyloid deposition as the central event in the aetiology of Alzheimer’s disease. Trends Pharmacol Sci. 1991;12(10):383–8. doi: 10.1016/0165-6147(91)90609-V. - DOI - PubMed
    1. Lee JE, Han PL. An update of animal models of Alzheimer disease with a reevaluation of plaque depositions. Exp Neurobiol. 2013;22(2):84–95. doi: 10.5607/en.2013.22.2.84. - DOI - PMC - PubMed
    1. Oddo S, Caccamo A, Shepherd JD, Murphy MP, Golde TE, Kayed R, et al. Triple-transgenic model of Alzheimer’s disease with plaques and tangles. Neuron. 2003;39(3):409–21. doi: 10.1016/S0896-6273(03)00434-3. - DOI - PubMed
    1. Jonsson T, Atwal JK, Steinberg S, Snaedal J, Jonsson PV, Bjornsson S, et al. A mutation in APP protects against Alzheimer’s disease and age-related cognitive decline. Nature. 2012;488(7409):96–9. doi: 10.1038/nature11283. - DOI - PubMed

Publication types