. 2016 Mar 1;76(5):1284-96.
doi: 10.1158/0008-5472.CAN-15-2478. Epub 2016 Jan 12.

EGFR Signaling Enhances Aerobic Glycolysis in Triple-Negative Breast Cancer Cells to Promote Tumor Growth and Immune Escape

Affiliations

EGFR Signaling Enhances Aerobic Glycolysis in Triple-Negative Breast Cancer Cells to Promote Tumor Growth and Immune Escape

Seung-Oe Lim et al. Cancer Res. .

Abstract

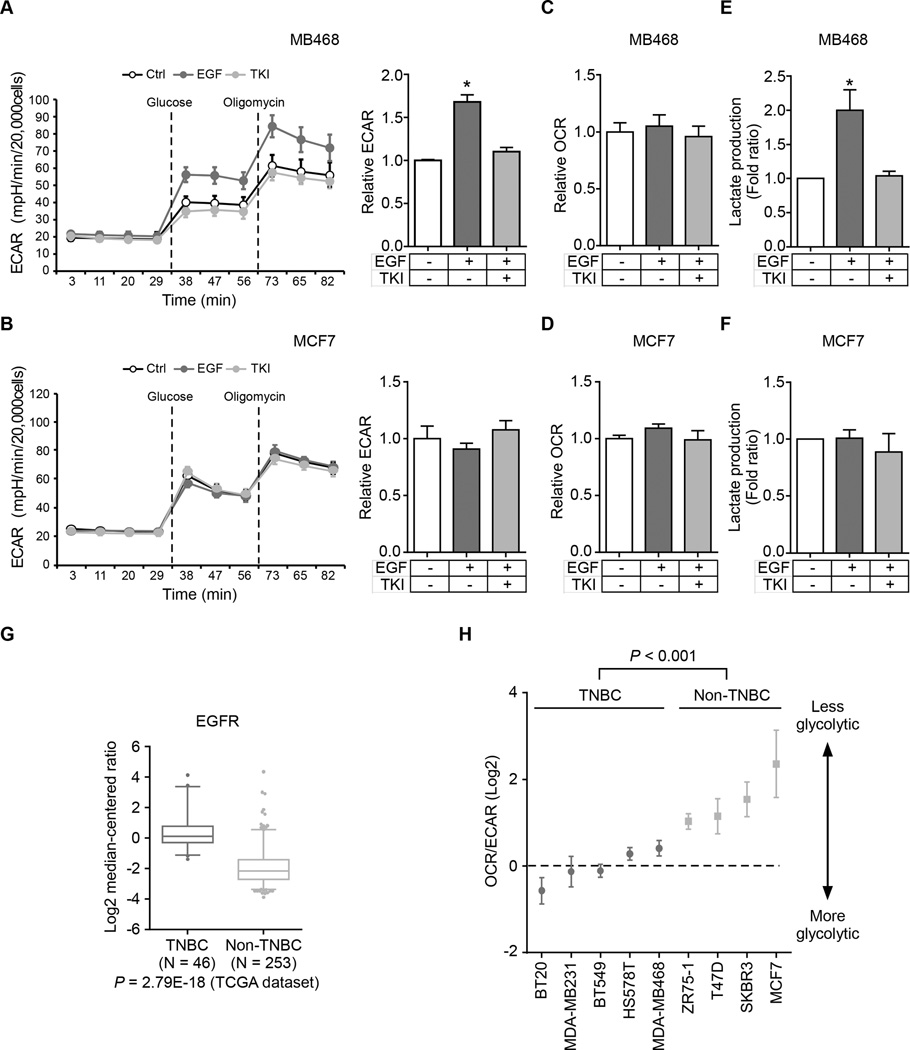
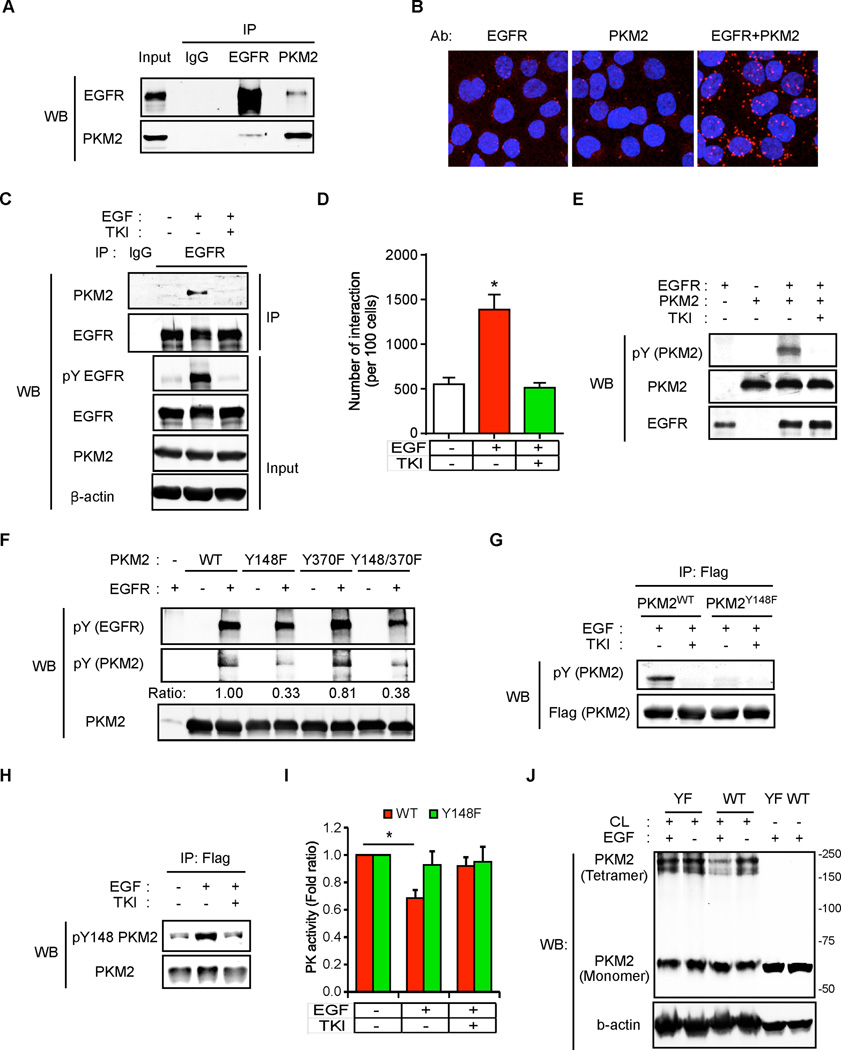
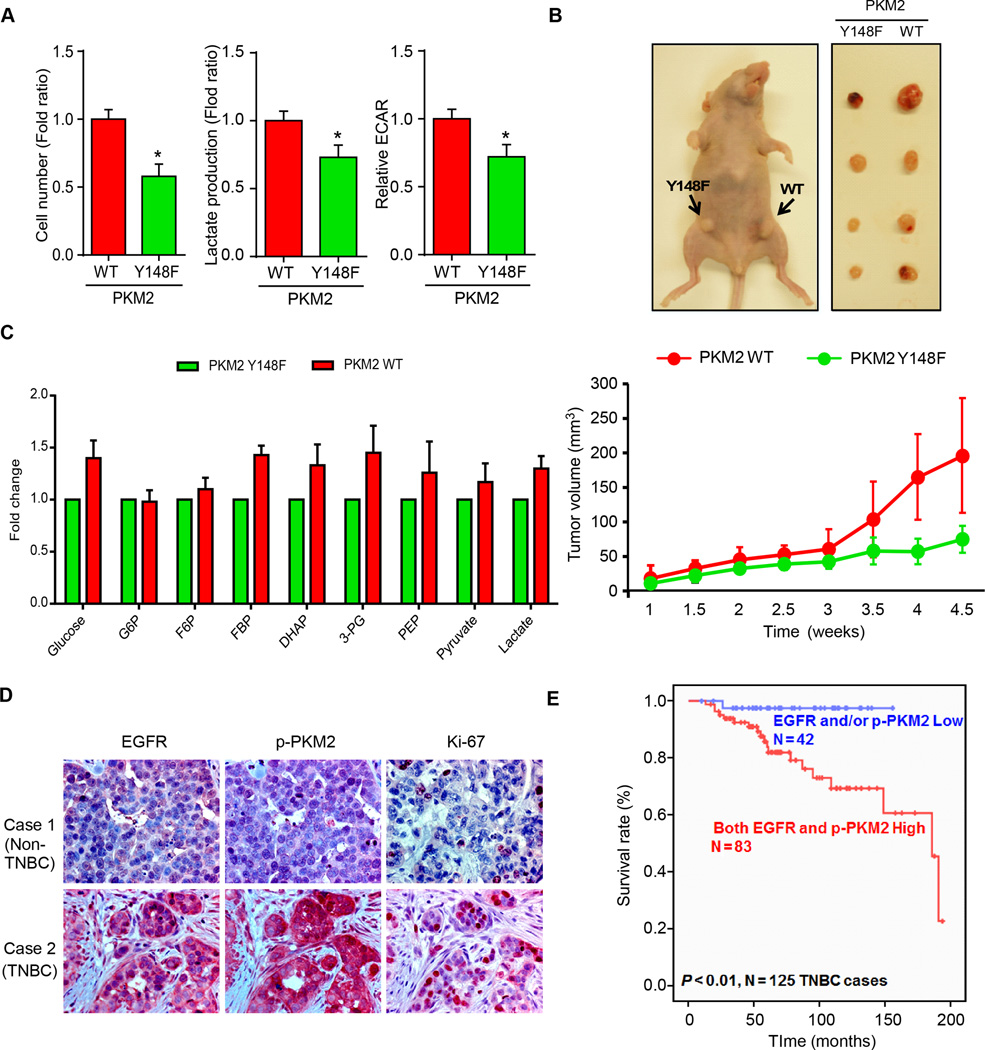
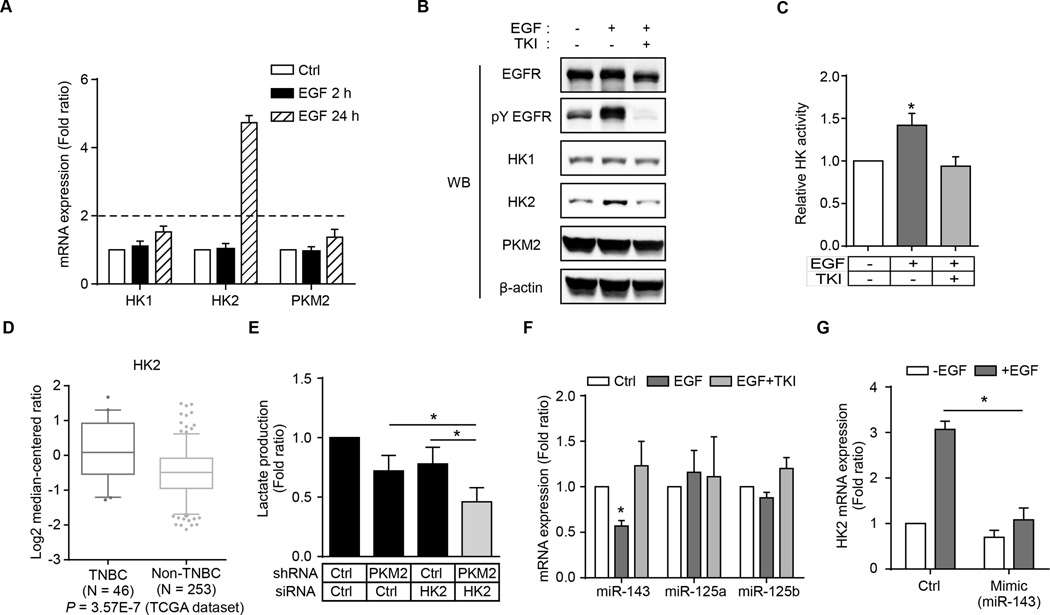
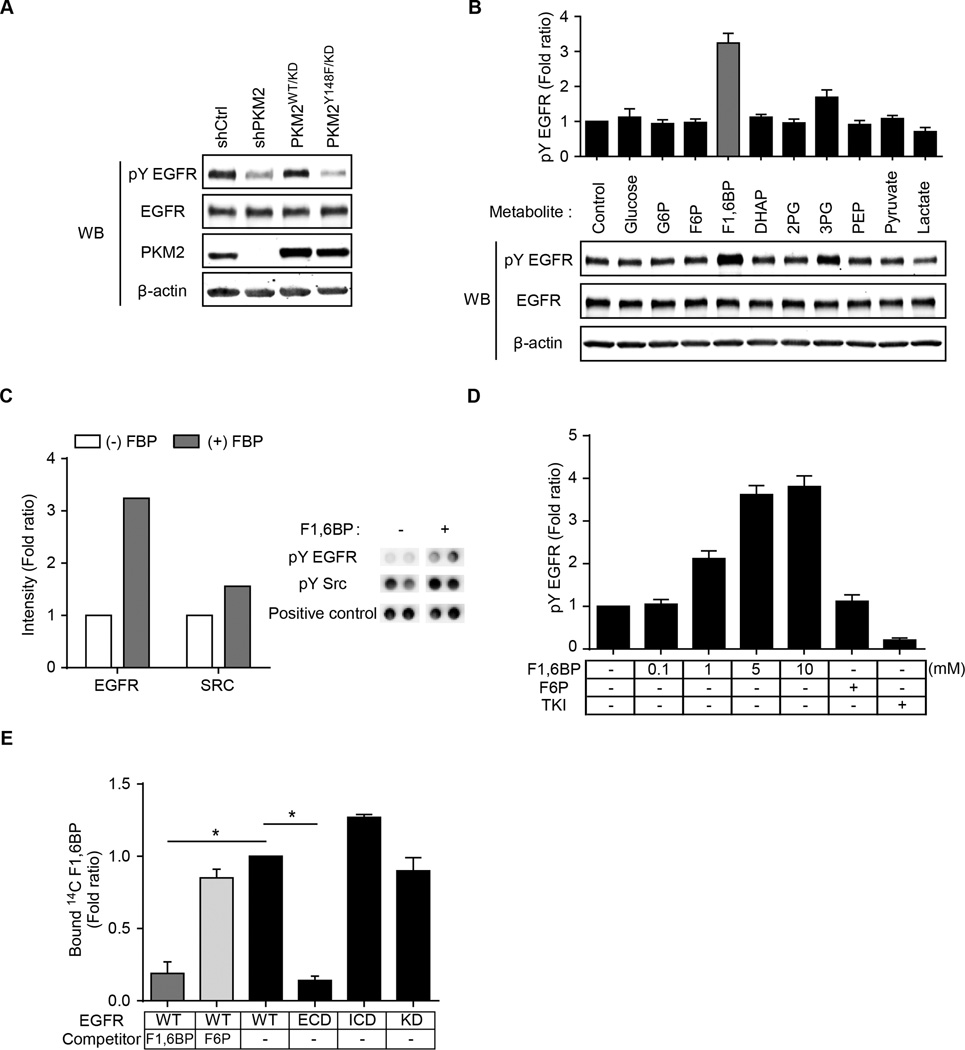
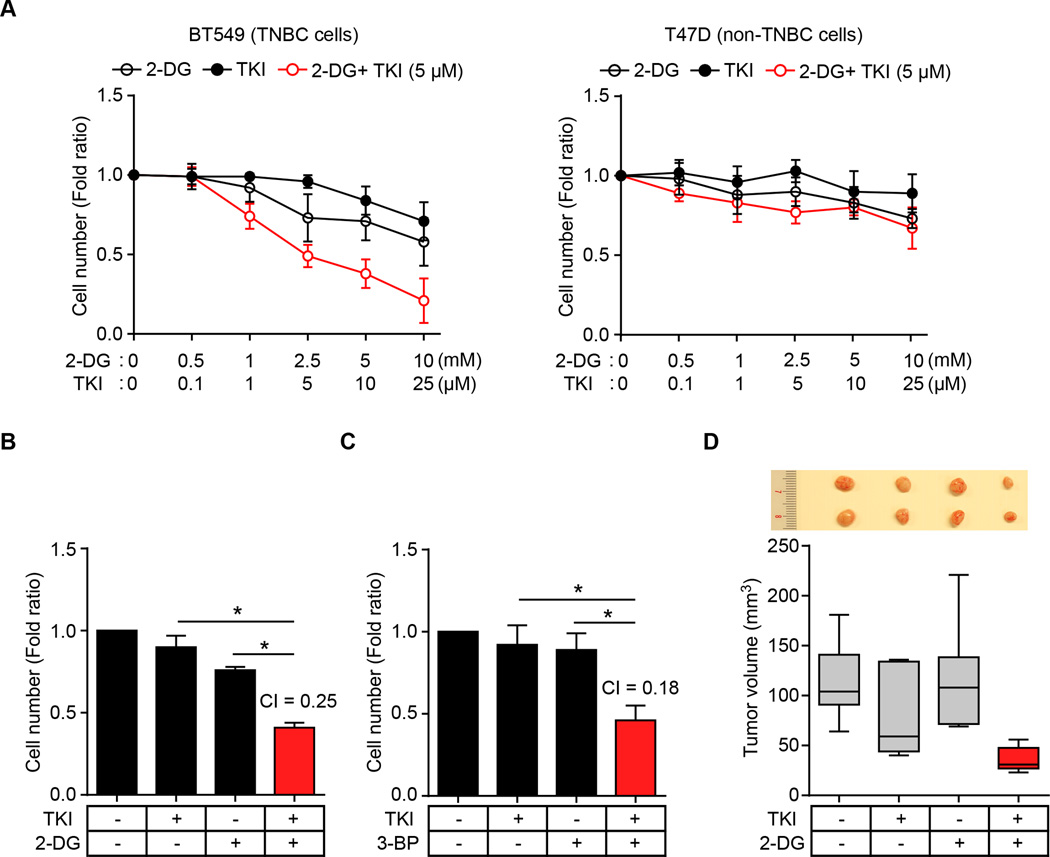
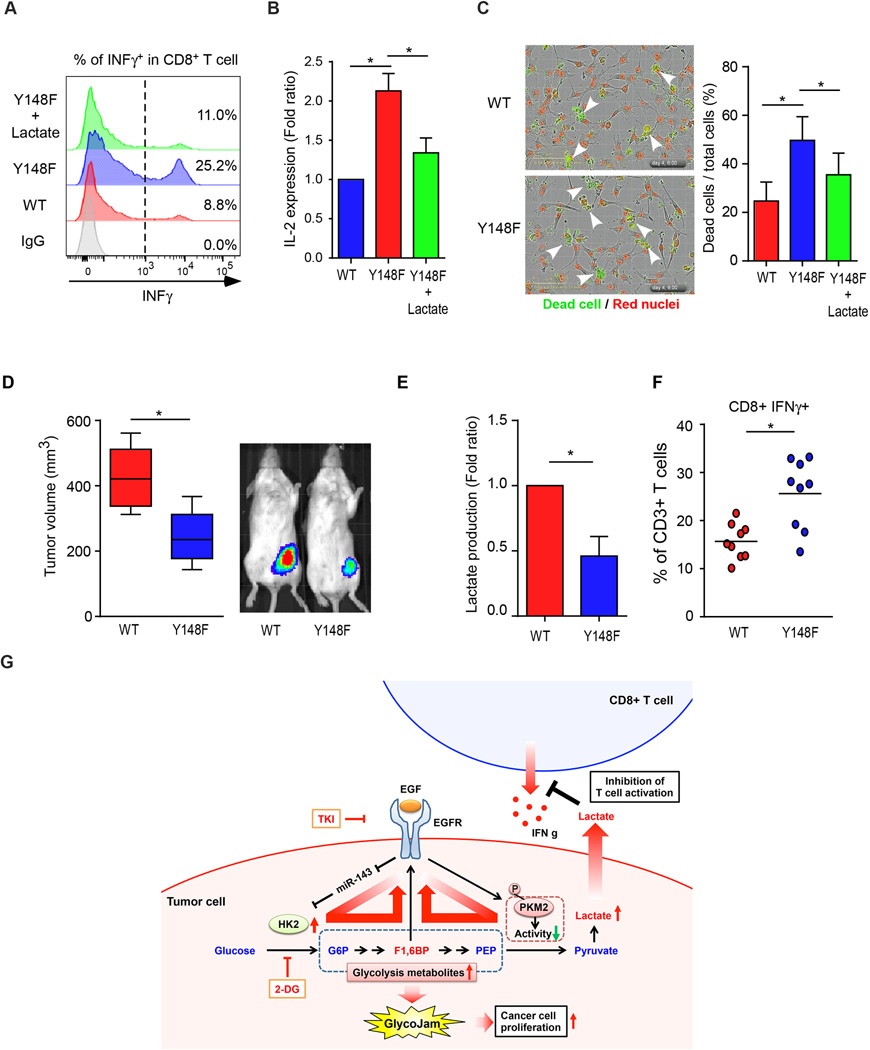
Oncogenic signaling reprograms cancer cell metabolism to augment the production of glycolytic metabolites in favor of tumor growth. The ability of cancer cells to evade immunosurveillance and the role of metabolic regulators in T-cell functions suggest that oncogene-induced metabolic reprogramming may be linked to immune escape. EGF signaling, frequently dysregulated in triple-negative breast cancer (TNBC), is also associated with increased glycolysis. Here, we demonstrated in TNBC cells that EGF signaling activates the first step in glycolysis, but impedes the last step, leading to an accumulation of metabolic intermediates in this pathway. Furthermore, we showed that one of these intermediates, fructose 1,6 bisphosphate (F1,6BP), directly binds to and enhances the activity of the EGFR, thereby increasing lactate excretion, which leads to inhibition of local cytotoxic T-cell activity. Notably, combining the glycolysis inhibitor 2-deoxy-d-glucose with the EGFR inhibitor gefitinib effectively suppressed TNBC cell proliferation and tumor growth. Our results illustrate how jointly targeting the EGFR/F1,6BP signaling axis may offer an immediately applicable therapeutic strategy to treat TNBC.


Conflict of interest statement

Conflicts of Interest

The authors have no conflicts of interest to declare.

Figures

Figure 1
Figure 1
EGF signaling stimulates glycolysis in TNBC cells. (A and B) ECAR, an indicator of glycolysis, was measured in MDA-MB-468 (A) or MCF7 (B) cells following the addition of glucose (10 mM) or oligomycin (1 µM) in the presence of EGF and/or TKI. Right, relative ECAR of EGFR before and after glucose injection. Ctrl, non-treated control cells; EGF, EGF treated cells; TKI, EGF and TKI co-treated cells. (C and D) OCR was measured in MDA-MB-468 (C) or MCF7 (D) following the addition of oligomycin (1 µM) or FCCP (0.5 µM) in the presence of EGF and/or TKI. (E and F) Lactate production was measured in the medium of MDA-MB-468 (E) or MCF7 (F) cells treated with EGF and/or TKI. (G) A Box-and-Whisker plot of EGFR mRNA expression in TNBC and non-TNBC tumors from the TCGA dataset using Oncomine™. (H) OCR/ECAR values in breast cancer cell lines following the addition of oligomycin (1 µM).
Figure 2
Figure 2
EGFR binds to and phosphorylates PKM2 to inhibit its activity. (A) Lysates from EGF-treated MDA-MB-468 cells were subjected to co-immunoprecipitation using EGFR and PKM2 antibodies followed by Western blotting. IgG, negative control. (B) EGF-treated MDA-MB-468 cells were immunostained with EGFR and/or PKM2 antibodies and assessed using Duolink® II assay as indicated. Red foci indicate interactions between endogenous EGFR and PKM2 proteins. EGFR or PKM2 antibody staining alone served as negative control. (C) Lysates from EGF and/or TKI treated MDA-MB-468 cells were subjected to immunoprecipitation using EGFR antibody followed by Western blotting. IgG, negative control. (D) EGF and/or TKI treated MDA-MB-468 cells were immunostained with EGFR and PKM2 antibodies and then subjected to Duolink® II assay. The number of red foci as described in (B) was calculated based on three randomly selected fields and normalized by nuclear number (per 100 cells). (E) In vitro kinase assay was performed using purified full-length recombinant His-PKM2 and commercially available purified EGFR. PKM2 phosphorylation was detected by phospho-Tyr antibody. (F) In vitro kinase reaction products of mutant PKM2 Y148F and/or Y370F detected by phospho-Tyr antibody. (G) EGF and/or TKI treated Flag-PKM2WT- or PKM2Y148F-expressing MDA-MB-468 cells were immunoprecipitated with Flag M2 affinity resin. Flag-PKM2 proteins were eluted by Flag peptide followed by Western blotting. (H) Flag-PKM2WT-expressing MDA-MB-468 cells were treated with EGF and/or TKI and were immunoprecipitated with Flag M2 affinity resin. Flag-PKM2 proteins were eluted by Flag peptide followed by Western blotting using phospho-Y148 PKM2 antibody. (I) PK activities of Flag-PKM2WT- or PKM2Y148F-expressing MDA-MB-468 cells treated with EGF and/or TKI. (J) EGF-treated Flag-PKM2WT- or PKM2Y148F-expressing MDA-MB-468 cells were cross-linked by glutaraldehyde followed by Western blotting. CL, cross-linker glutaraldehyde.
Figure 3
Figure 3
EGFR reprograms cancer cell metabolism by PKM2 phosphorylation in TNBC cells. (A) Cell proliferation, glycolysis (ECAR), and lactate production were measured in EGF-treated PKM2WT- or PKM2Y148F-expressing MDA-MB-468 cells. (B) Top, nude mice were injected with PKM2WT- and PKM2Y148F-expressing BT549 cells in mammary glands as shown. Tumors were measured and dissected at the endpoint. Bottom, tumors were measured at the indicated time points. N = 8 per group. (C) Fold changes of glycolytic intermediates in EGF-treated MDA-MB-468 cells expressing PKM2WT or PKM2Y148F. G6P, glucose 6-phosphate; F6P, fructose 6-phosphate; DHAP, dihydroxyacetone phosphate; 3-PG, 3-phosphoglyceric acid; PEP, phosphoenolpyruvate. (D) Representative images of IHC staining of EGFR, phospho-Y148 PKM2, and Ki-67 in non-TNBC (case 1) and TNBC (case 2) tumor tissues. (E) Kaplan-Meier survival curve of EGFR and phospho-PKM2 in TNBC tissues (N = 125, P < 0.01).
Figure 4
Figure 4
Upregulation of HK2 expression by EGF signaling contributes to aerobic glycolysis in TNBC cells. (A) The mRNA expression of HK1, HK2, and PKM2 in EGF-treated MDA-MB-468 cells. Ctrl, without EGF treatment. (B) Protein expression of HK1, HK2, and PKM2 in EGF-treated MDA-MB-468 cells. (C) Hexokinase activity was measured in MDA-MB-468 cells after 24-h EGF treatment. (D) A Box-and-Whisker plot of HK2 gene expression in TNBC and non-TNBC tumor tissues. (E) Lactate production of PKM2 and/or HK2 knockdown MDA-MB-468 cells after 24-h EGF treatment. (F) RT-qPCR analysis of miR-143, miR-125a, and miR-125b expression in EGF- and/or TKI-treated MDA-MB-468 cells. Ctrl, without EGF and/or TKI treatment. (G) RT-qPCR analysis of HK2 mRNA expression in MDA-MB-468 cells transfected with miR-143 mimic or microRNA mimic negative control (ctrl) and treated with or without EGF for 24 h.
Figure 5
Figure 5
F1,6BP enhances EGFR activity through a direct binding with EGFR. (A) Protein expression of tyrosine-phosphorylated (pY) EGFR in MDA-MB-468 cells expressing control shRNA (shCtrl), sh-PKM2, PKM2WT/KD, or PKM2Y148F/KD. (B) Protein expression of pY EGFR in MDA-MB-468 cells treated with various metabolites. Top, quantification of pY EGFR. (C) In vitro kinase assay on RTK array with or without 500 µM F1,6BP. Left, quantification of pY EGFR and pY SRC. Right, representative RTK array images of pY EGFR, pY SRC, and positive control. (D) Quantitation of pY EGFR Western blotting from in vitro EGFR kinase assay on RTK array with the indicated treatments. (E) Quantification of 14C-F1,6BP bound EGFR from in vitro binding assay. WT, wild type; ECD, extracellular domain; ICD, intracellular domain; KD, kinase dead mutant.
Figure 6
Figure 6
The combination of EGFR and glycolysis inhibitors synergistically suppresses TNBC cell proliferation. (A) Proliferation of BT549 (left) and T47D (right) cells treated with glycolysis inhibitor 2-DG and/or TKI as determined by cell counting assay. (B and C) Proliferation of BT549 cells treated with TKI and/or glycolysis inhibitor 2-DG (B) or 3-BP (C) as measured by cell counting assay. CI, combination index value. CI < 0.8 indicates synergistic effect. (D) Nude mice were injected with BT549 cells in the mammary glands and treated with 2-DG and/or gefitinib. Tumors were measured and dissected at the endpoint, and tumor size (mm3) shown in a Box-and-Whisker plot.
Figure 7
Figure 7
EGF signaling-induced lactate inhibits cytotoxic T cell activity. (A) Flow cytometric analysis of activated cytotoxic T-cell (INFγ+ and CD8+) population in co-culture of primary T cells and PKM2WT- or PKM2Y148F-expressing MDA-MB-468 cells with or without 10 mM lactate treatment. (B) Levels of soluble IL-2 in co-culture of Jurkat T cells and PKM2WT- or PKM2Y148F-expressing MDA-MB-468 cells. (C) Representative images from phase contrast microscopy showing red fluorescence (nuclear restricted RFP) and/or green fluorescence (NucView™ 488 Caspase 3/7 substrate) from merged images (20×) of PKM2WT- or PKM2Y148F-expressing MDA-MB-468 cells and activated T cell co-cultured in the presence of caspase 3/7 substrate for 96 h. Scale bar, 10 µm. Green fluorescent cells were counted as dead cells. Right, the percentage of dead cells relative to the total number of cells counted. (D) Left, tumors were measured and dissected at the endpoint, and tumor size (mm3) shown in a Box-and-Whisker plot. N = 9 mice per group. Right, representative images of tumor growth of PKM2WT- or PKM2Y148F-expressing mouse 4T1-luc cells in BALB/c mice by IVIS bioluminescence imaging (IVIS100). (E) Lactate production of PKM2WT-or PKM2Y148F-expressing 4T1 tumors. (F) Intracellular cytokine staining of IFNγ in CD8+ CD3+ T cell populations. P < 0.05, two-way ANOVA. N = 9 mice per group. (G) Proposed model of EGF-mediated glycolytic metabolite accumulation and immune escape.

References

    1. Warburg O. On the origin of cancer cells. Science. 1956;123(3191):309–314. - PubMed
    1. Vander Heiden MG, Cantley LC, Thompson CB. Understanding the Warburg effect: the metabolic requirements of cell proliferation. Science. 2009;324(5930):1029–1033. - PMC - PubMed
    1. Ward PS, Thompson CB. Metabolic reprogramming: a cancer hallmark even warburg did not anticipate. Cancer cell. 2012;21(3):297–308. - PMC - PubMed
    1. Dang CV. Links between metabolism and cancer. Genes & development. 2012;26(9):877–890. - PMC - PubMed
    1. Fang R, Xiao T, Fang Z, Sun Y, Li F, Gao Y, et al. MicroRNA-143 (miR-143) regulates cancer glycolysis via targeting hexokinase 2 gene. The Journal of biological chemistry. 2012;287(27):23227–23235. - PMC - PubMed

Publication types