. 2016 Jan 12:7:5.
doi: 10.1186/s13293-015-0056-4. eCollection 2016.

Spatial sexual dimorphism of X and Y homolog gene expression in the human central nervous system during early male development

Affiliations

Spatial sexual dimorphism of X and Y homolog gene expression in the human central nervous system during early male development

Martin M Johansson et al. Biol Sex Differ. .

Abstract

Background: Renewed attention has been directed to the functions of the Y chromosome in the central nervous system during early human male development, due to the recent proposed involvement in neurodevelopmental diseases. PCDH11Y and NLGN4Y are of special interest because they belong to gene families involved in cell fate determination and formation of dendrites and axon.

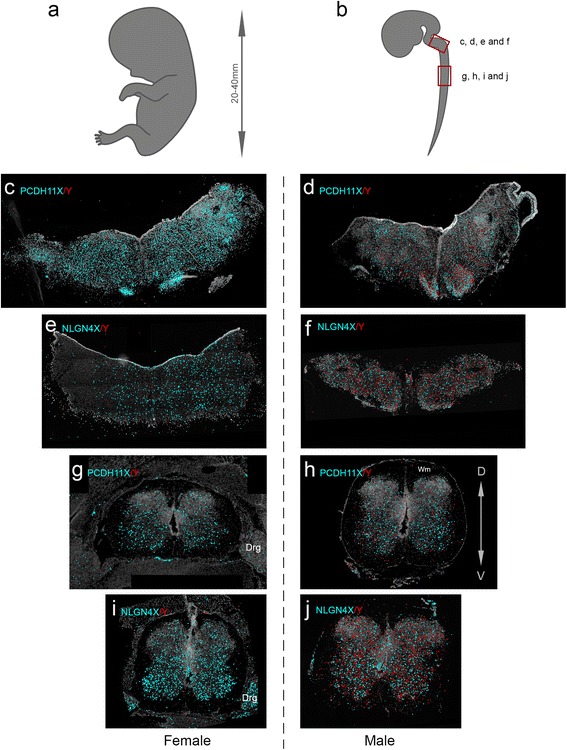
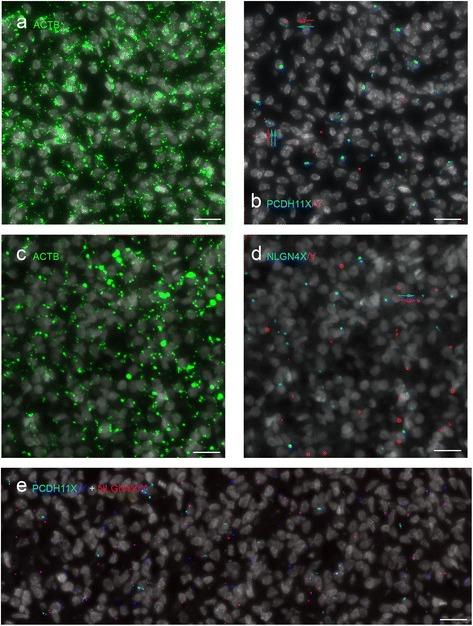
Methods: We used RNA sequencing, immunocytochemistry and a padlock probing and rolling circle amplification strategy, to distinguish the expression of X and Y homologs in situ in the human brain for the first time. To minimize influence of androgens on the sex differences in the brain, we focused our investigation to human embryos at 8-11 weeks post-gestation.

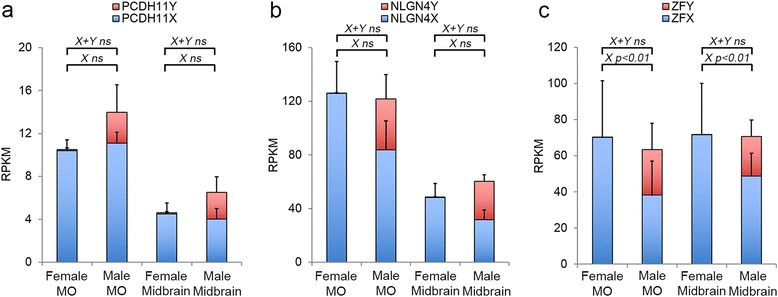
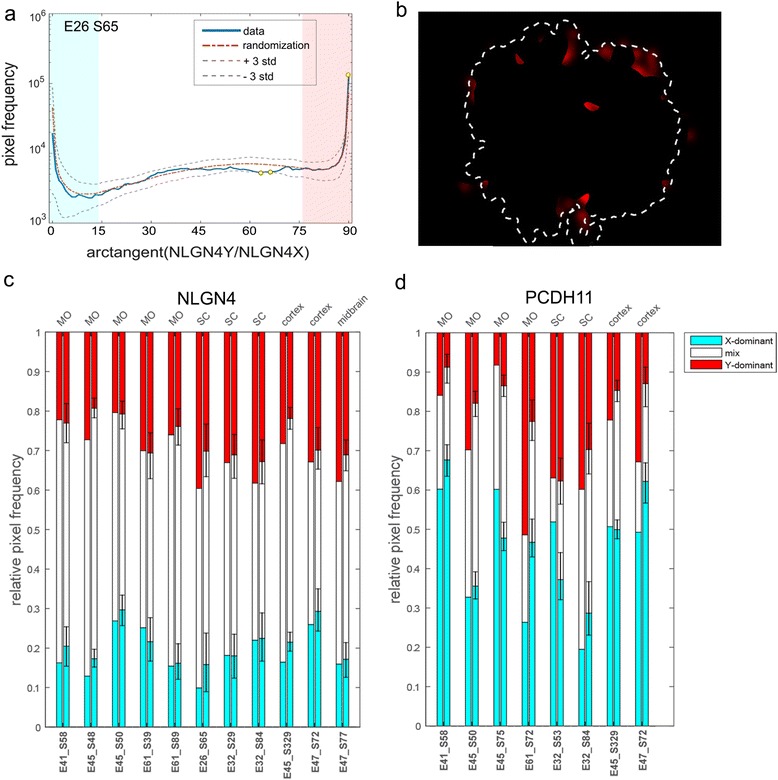
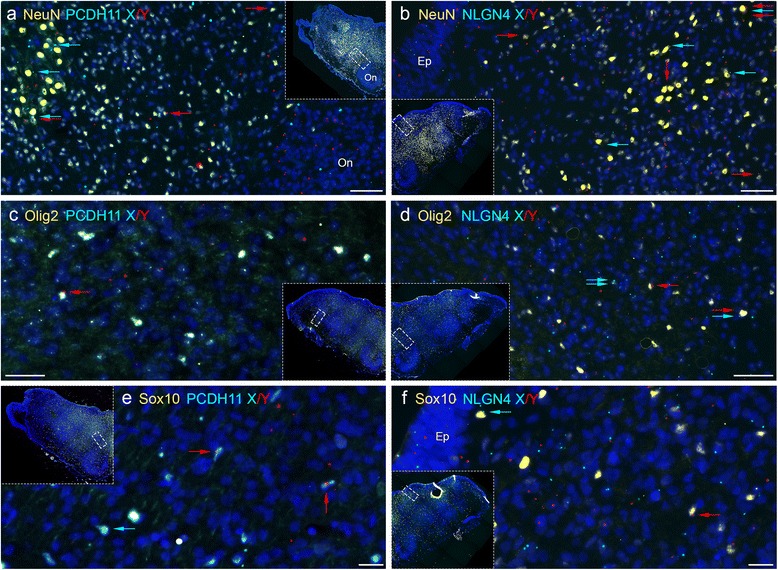
Results: We found that the X- and Y-encoded genes are expressed in specific and heterogeneous cellular sub-populations of both glial and neuronal origins. More importantly, we found differential distribution patterns of X and Y homologs in the male developing central nervous system.

Conclusions: This study has visualized the spatial distribution of PCDH11X/Y and NLGN4X/Y in human developing nervous tissue. The observed spatial distribution patterns suggest the existence of an additional layer of complexity in the development of the male CNS.

Keywords: Brain; Cortex; Female; Gene expression; Human embryo development; ISLET1; Male; Medulla oblongata; NLGN4X; NLGN4Y; NeuN; Neuroligin; OLIG2; PCDH11X; PCDH11Y; Protocadherin; Rolling circle amplification; SOX10; Sex differences; Spinal cord; X chromosome; Y chromosome.


Figures

Fig. 1
Fig. 1
Quantification of expression levels using RNA sequencing. Staple bars show the average RPKM for both total RNA and polyA+ sequencing of female and male MO and midbrain for PCDH11X/Y (a), NLGN4X/Y (b) and ZFX/Y (c). Only ZFX showed significant expression differences between females and males in both tissues, and NLGN4X presented a non-significant increase in females
Fig. 2
Fig. 2
Padlock probe hybridization can distinguish between expression of X and Y homolog genes for PCDH11 and NLGN4. a, b Schematic representation of an embryo modified from Gasser [47] and the CNS of an embryo at 12 weeks of gestation modified from His [48]. The boxes in red mark the approximate position of the coronal sections shown in the rest of the figure. c Female medulla oblongata (MO) section hybridized with padlock probes for PCDH11X and Y. X signals in cyan and Y signals in red for all subfigures. d Male MO section hybridized with padlock probes for PCDH11X and Y. e Female MO section hybridized with padlock probes for NLGNX and Y. f Male MO section hybridized with padlock probes for NLGNX and Y. g Female spinal cord (SC) section hybridized with padlock probes PCDH11X and Y. h Male SC section hybridized with padlock probes for PCDH11X and Y. i Female SC section hybridized with padlock probes NLGNX and Y. j Male SC section hybridized with padlock probes for NLGNX and Y. All signals from females and males were detected using a Zeiss Axio Imager.Z2 epi-fluorescence microscope. The images were produced using the Zen software and enhanced to 15–20-pixel dots to allow visualization in ×20 magnification pictures. Drg dorsal root ganglia
Fig. 3
Fig. 3
Quantification of padlock hybridization signals in SC and MO. The figure shows the average amount of signals per 1000 cells, identified by the image analysis software CellProfiler in the original microscopy images, for female and male SC, MO and midbrain. Standard errors are included for both females and males. The number of sections and the total number of cells analysed are indicated under each staple bar. a. PCDH11X/Y. b NLGN4X/Y. The clamps on top of the bars indicate the significance (or not) of the comparison between X gene expression between females and males
Fig. 4
Fig. 4
Padlock hybridization with ACTB, PCDH11X/Y and NLGN4X/Y. a, b. Male MO sections simultaneously hybridized with one padlock probe for ACTB, five probes for PCDH11X and five for PCDH11Y. a, b The same region of the section with staining for nuclei and ACTB (a) and PCDH11X (cyan) and PCDH11Y (red) (b). Most stained cells express either PCDH11X or PCDH11Y. Rarely, some cells express both X and Y transcripts (marked with arrows). c, d Male MO section simultaneously hybridized with one padlock probe for ACTB, four probes for NLGN4X and four for NLGN4Y. Nuclei and ACTB staining are shown in c, and NLGN4X (cyan) and NLGN4Y (red) staining in d. e Male SC section simultaneously hybridized with five probes for PCDH11X (cyan), five for PCDH11Y (blue), four probes for NLGN4X (red) and four for NLGN4Y (purple)
Fig. 5
Fig. 5
Signal density maps in the spinal cord and medulla oblongata sections from female and male embryos hybridized with PCDH11X/Y and NLGNX/Y. The distributions of Y and X signals in different tissue sections are displayed as kernel density estimation plots where Y signal density is displayed in red and X signal density in cyan. The intensity of the colour reflects the density of the signal. Overlap in signal densities results in a mixed colour, whereas equal proportion of Y and X results in white colour. The outline of the tissue is indicated by a dashed white line. Orientation of the SC tissues is ventral down and dorsal up. The signal density in the female spinal cord is displayed in a for PCDH11X and in b for NLGN4X. c, d Signal density in the female medulla oblongata for PCDH11X and NLGN4X, respectively. e Signal density of PCDH11X/Y in the male spinal cord is shown individually for the two homologs as well as a plot of the two transcript densities combined. NLGN4X/Y is displayed in the same way on f. Signal densities in the male medulla oblongata are shown in g and h for PCDH11X/Y and NLGN4X/Y
Fig. 6
Fig. 6
Comparison of the observed spatial signal distribution to randomized signal distributions in male MO for NLGN4X/Y. The frequency of pixels of varying intensity ratios of X and Y for NLGN4X/Y in male SC (E32_S84) are displayed in the histogram in a. A cutoff of 80 % colour purity was set to classify pixels as X dominant and Y dominant, displayed in the histogram as a blue field and a pink field, respectively. Pixels deviating more than 3 SD are shown as yellow dots on the blue line and then plotted in b visualize the location of the pixels over-represented in the sample tissue compared to the randomized data set. The proportions of X-dominant, Y-dominant and mixed pixels in the analysed samples are shown for all samples next to their respective randomized data set in c for NLGN4X/Y and in d for PCDH11X/Y. Relative pixel frequency from the random distributions for all samples is shown in c and d.
Fig. 7
Fig. 7
Combined padlock hybridization and immunohistochemistry for PCDH11X/Y and NLGNX/Y in MO samples from human male embryos. a, b Padlock probe hybridizations with probes for PCDH11X and PCDH11Y (a) or NLGN4X and NLGN4Y (b) were combined with immunohistochemistry using NeuN antibodies. NeuN-positive cells are stained in yellow, PCDH11X signals in sky blue and PCDH11Y in red. DAPI staining in dark blue allows visualization of nuclei. Each subfigure is an enlargement of the MO tissue showed in each inset picture. Some NeuN+ cells contain signals for PCDH11X (marked with blue arrows), PCDH11Y (red arrows) or both X and Y transcripts (blue and red arrows). c, d Padlock probe hybridization with probes for PCDH11X/Y (a) or NLGN4X/Y (b) was combined with immunohistochemistry using Olig2 antibodies. d, f Padlock probe hybridization with probes for PCDH11X/Y (a) or NLGN4X/Y (b) was combined with immunohistochemistry using Sox10 antibodies. Ep ependymal layer

Similar articles

Cited by

References

    1. McCarthy MM, Arnold AP. Reframing sexual differentiation of the brain. Nat Neurosci. 2011;14(6):677–83. doi: 10.1038/nn.2834. - DOI - PMC - PubMed
    1. Jazin E, Cahill L. Sex differences in molecular neuroscience: from fruit flies to humans. Nat Rev Neurosci. 2010;11(1):9–17. doi: 10.1038/nrn2754. - DOI - PubMed
    1. Cahill L. Why sex matters for neuroscience. Nat Rev Neurosci. 2006;7(6):477–84. doi: 10.1038/nrn1909. - DOI - PubMed
    1. Kopsida E, Stergiakouli E, Lynn PM, Wilkinson LS, Davies W. The role of the Y chromosome in brain function. Open Neuroimaging J. 2009;2:20–30. - PMC - PubMed
    1. Ross JL, Tartaglia N, Merry DE, Dalva M, Zinn AR. Behavioral phenotypes in males with XYY and possible role of increased NLGN4Y expression in autism features. Genes Brain Behav. 2015;14(2):137–44. doi: 10.1111/gbb.12200. - DOI - PMC - PubMed

LinkOut - more resources