. 2016 Jan 13;12(1):e1005771.
doi: 10.1371/journal.pgen.1005771. eCollection 2016 Jan.

Arabidopsis Flower and Embryo Developmental Genes are Repressed in Seedlings by Different Combinations of Polycomb Group Proteins in Association with Distinct Sets of Cis-regulatory Elements

Affiliations

Arabidopsis Flower and Embryo Developmental Genes are Repressed in Seedlings by Different Combinations of Polycomb Group Proteins in Association with Distinct Sets of Cis-regulatory Elements

Hua Wang et al. PLoS Genet. .

Erratum in

Abstract

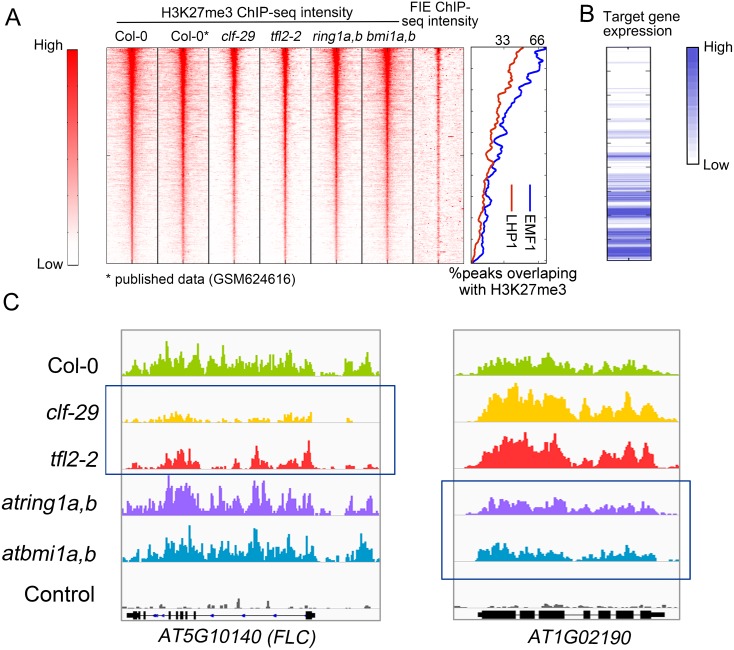
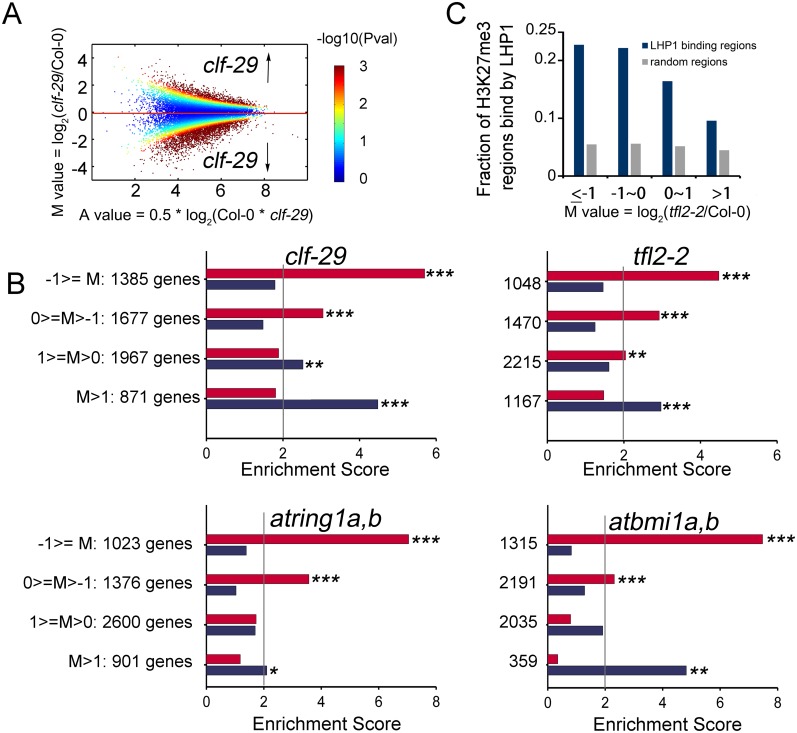
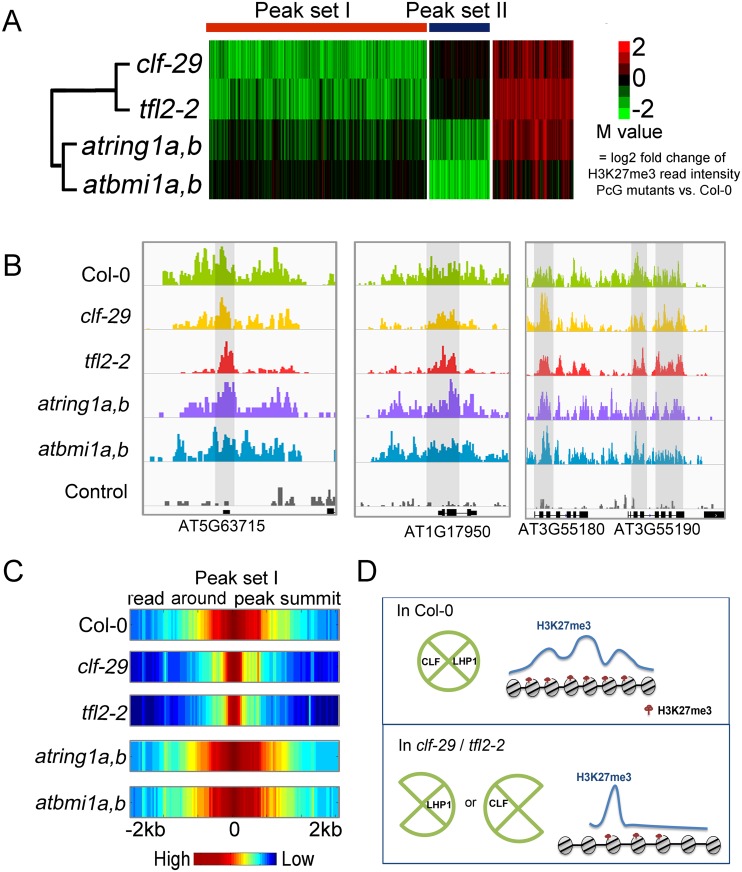
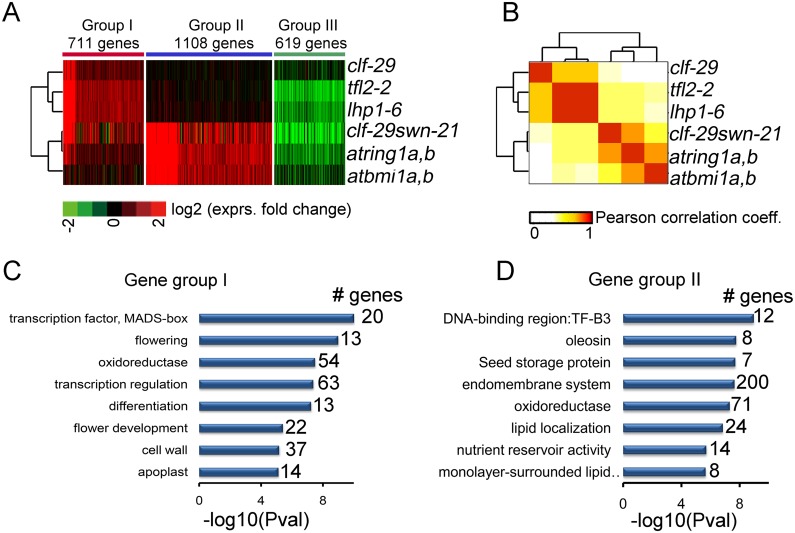
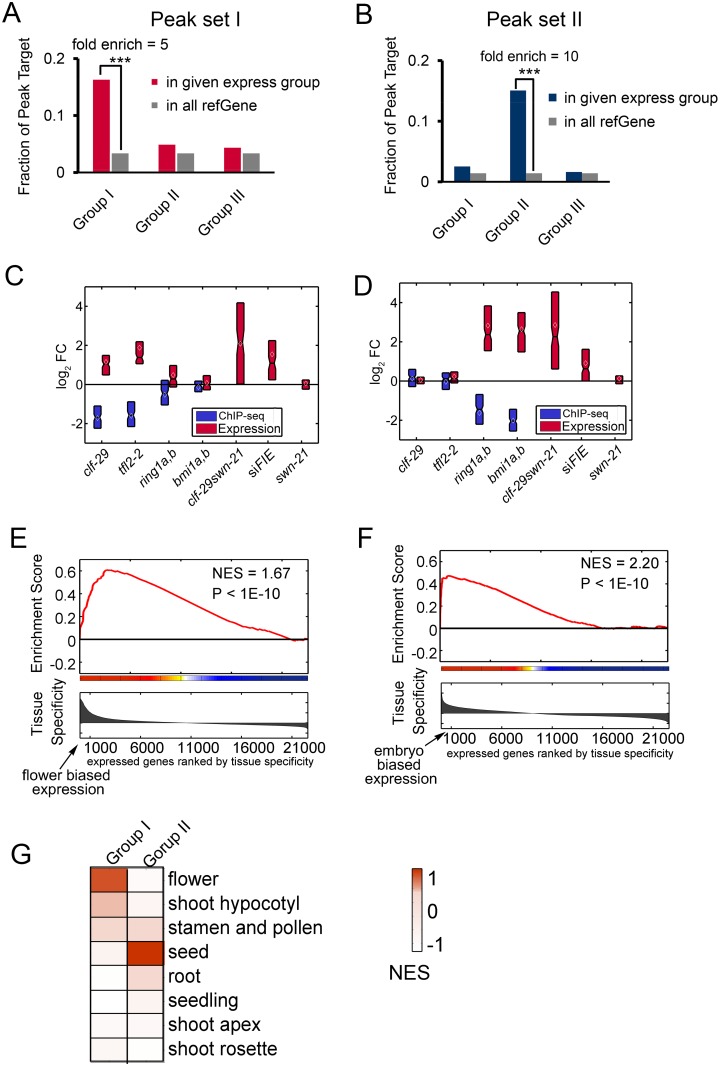
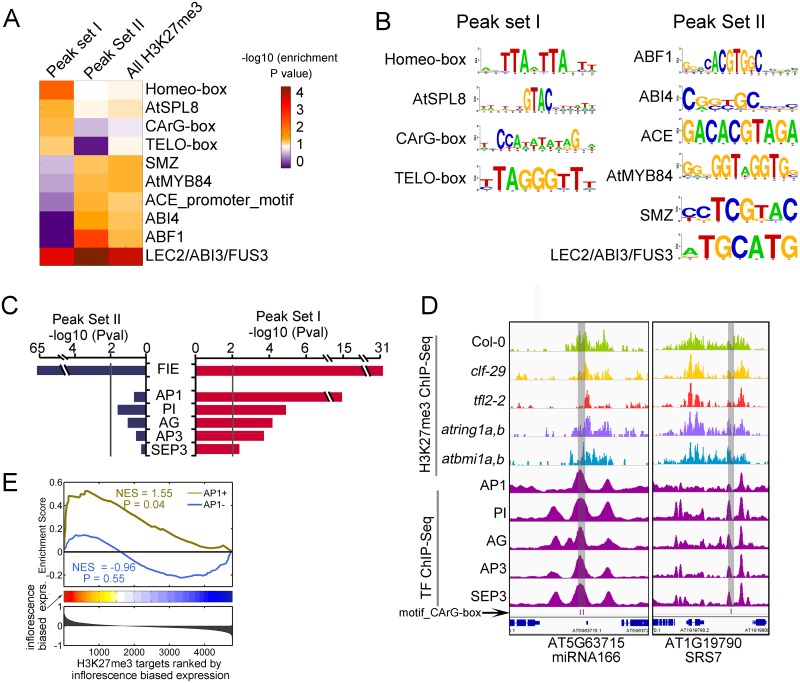
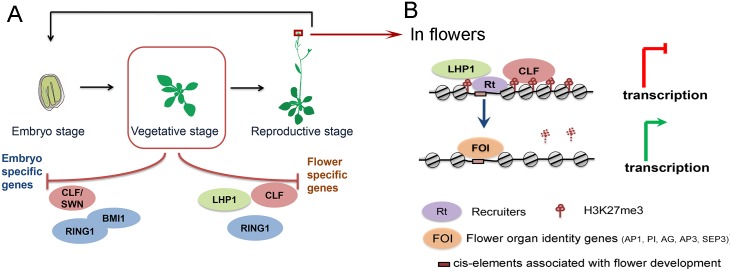
Polycomb repressive complexes (PRCs) play crucial roles in transcriptional repression and developmental regulation in both plants and animals. In plants, depletion of different members of PRCs causes both overlapping and unique phenotypic defects. However, the underlying molecular mechanism determining the target specificity and functional diversity is not sufficiently characterized. Here, we quantitatively compared changes of tri-methylation at H3K27 in Arabidopsis mutants deprived of various key PRC components. We show that CURLY LEAF (CLF), a major catalytic subunit of PRC2, coordinates with different members of PRC1 in suppression of distinct plant developmental programs. We found that expression of flower development genes is repressed in seedlings preferentially via non-redundant role of CLF, which specifically associated with LIKE HETEROCHROMATIN PROTEIN1 (LHP1). In contrast, expression of embryo development genes is repressed by PRC1-catalytic core subunits AtBMI1 and AtRING1 in common with PRC2-catalytic enzymes CLF or SWINGER (SWN). This context-dependent role of CLF corresponds well with the change in H3K27me3 profiles, and is remarkably associated with differential co-occupancy of binding motifs of transcription factors (TFs), including MADS box and ABA-related factors. We propose that different combinations of PRC members distinctively regulate different developmental programs, and their target specificity is modulated by specific TFs.


Conflict of interest statement

The authors have declared that no competing interests exist.

Figures

Fig 1
Fig 1. Local difference of H3K27me3 marks in mutants of PcG components.
(A) ChIP-seq density heatmaps in Col-0 and PcG mutants, ranked by H3K27me3 read intensity within ±500 bp of peak summits in Col-0. The Pearson correlation coefficient between H3K27me3 intensity in Col-0 and FIE binding within ±50 bp of peak summits is 0.52. ChIP-seq data of H3K27me3 in panel II and FIE binding in panel VII were published previously [40,41]. To compare H3K27me3 level with the bindings of LHP1 and EMF1 based on published ChIP-chip data [15,32], the fraction of EMF1 peaks (blue) or LHP1 peaks (red) Col-0 overlapped with Col-0 H3K27me3 peaks were plotted. (B) RNA-seq intensity heatmap for the targets of H3K27me3 peaks in Col-0 with the same order as in (A). The expression intensity is measured by Reads Per Kilobase per Million of mapped reads (RPKM). (C) (C) IGV screen shots showing the distribution of H3K27me3 mark intensity in Col-0 and different mutants of PcG components. Negative control is Col-0 sample immunoprecipitated with beads but without antibody. Regions showing quantitative reduction of H3K27me3 marks are highlighted by blue box.
Fig 2
Fig 2. Quantitative difference of H3K27me3 marks are inversely correlated with the change of target gene expression in PcG mutants.
(A) MA plot of all peaks from comparison of clf-29 and Col-0 after normalization by MAnorm. Each dot represents a peak. X-axis is the A value, which represents the average intensity. Y-axis is the M value, which represents the difference of the intensity. Here, positive M value indicates higher H3K27me3 level in clf-29 as compared to that in Col-0, and negative M value represents lower H3K27me3 level in clf-29. The color range represents -log10 P value associated with normalized peaks. (B) Enrichment of H3K27me3 peak targets with different M values in gene sets whose expression are regulated by different PcGs. The target genes were grouped by the M values of nearby peaks. For each group, the overlap with differentially expressed genes in a given PcG mutant was compared to the expected overlap at random; x-axis represents enrichment score. Fishers’ exact test was used to test the significance of overlap. *, P value <5e-2; **, P value <1e-2; ***, P value <1e-3. (C) Bar plot showing the percentage of H3K27me3 peaks with different M values in tlf2-2 overlapped with LHP1 binding sites.
Fig 3
Fig 3. clf-29 and tfl2-2 show coordinated H3K27me3 change profiles distinct from those in atring1a,b and atbmi1a,b.
K-means clustering of M values characterizing the quantitative change of H3K27me3 in PcG mutants. Definition of H3K27me3 quantitative change regions were based on combined criteria |M|>1 and P value <1e-3. Green and red colors represent lower and higher H3K27me3 levels in PcG mutants compared to that in Col-0. IGV screenshots support CLF and LHP1 participate in H3K27me3 elongation. Grey areas represent regions where significant H3K27me3 reductions happen mainly in surrounding regions but not in summit regions in tfl2-2 and clf-29 compared to Col-0. It’s worth noting that no smooth should be applied while preparing data for IGV screenshots, or else the difference between Col and clf-29 or tfl-2 would not be as obvious as the raw data. (C) Visualization of the profile of average read intensity around peak summits. All regions from peak set I were aligned such that peak summit is in the center of each region. Next, average read intensities were calculated and plotted for each consecutive 50 bp. (D) The diagram illustrates the finding based on H3K27me3 ChIP-seq data comparisons that LHP1 and CLF participate in elongation of H3K27me3 mark.
Fig 4
Fig 4. The profile of transcriptome change reveals two distinct combinations of PcGs with different functions.
Three groups of genes showing distinct expression change profiles across mutants of PcG components. Green and red colors represent lower and higher expression in PcG mutants. Heatmap including another 1,290 genes whose expression affected only in clf-29swn-21 is shown in S5A Fig. RNA-seq data sets were clustered via unsupervised hierarchical clustering based on Pearson correlation coefficients of log2 expression fold-change across samples. (C-D) Functional terms enriched in genes from group 1 (C) and group 2 (D) as shown in (A).
Fig 5
Fig 5. Targets of different combinations of PcGs and their expression bias.
(A) Enrichment analysis of peak set I targets in three expression groups shown in Fig 4A. ***, Fishers’ exact test P value < 1e-3. (B) Enrichment analysis of peak set II targets in three expression groups shown in Fig 4A. ***, Fishers’ exact test P value < 1e-3. (C-D) Box plot showing the distribution of expression changes and H3K27me3 changes for 108 genes (C) and 164 genes (D) in PcG mutants. (E-F) Gene Set Enrichment Analysis (GSEA) showing a significant normalized enrichment score (NES) for flower biased expression of 108 genes (E) and embryo biased expression of 164 genes (F). The x axis represents all expressed genes ranked by tissue specificity as determined by expression profile, y axis presents the running enrichment score. (G) Heatmap showing NES calculated by GSEA for 108 genes and 164 genes in different gene sets with distinct tissue biased expressions.
Fig 6
Fig 6. TF binding motifs and TFs whose bindings enriched in peak set I and peak set II.
(A) Heatmap showing enriched motifs (P value < 0.01) in either peak set I or peak set II. Their enrichment in H3K27me3 peaks in Col-0 are also shown. (B) Sequence LOGOs of motifs enriched in peak set I and peak set II. (C) Enrichment of the binding sites of FIE and TFs in peak set I. (D) IGV screen shots showing examples of co-occupancy between H3K27me3 in seedlings and the bindings of MADS-box TFs in inflorescence. The motif sites of MADS box TFs are indicated by pink and blue bars at bottom of the screen shots, and are highlighted by grey area. (E) GSEA showing the common target genes of peak set I and AP1 binding peaks are preferentially expressed in inflorescence.
Fig 7
Fig 7. Working model for specific regulation of plant development by PcG components.
(A) In seedlings, CLF and LHP1 work concertedly to repress flower specific genes, and some targets are also regulated by RING1. While repression of embryonic development requires cooperative regulation of AtBMI1, AtRING1, and the redundant role of CLF and SWN. (B) In inflorescence, significant parts of CLF and LHP1 target sites in seedlings are occupied by inflorescence specific TFs, which participate in de-repression of the common target genes.

References

    1. Bemer M, Grossniklaus U (2012) Dynamic regulation of Polycomb group activity during plant development. Curr Opin Plant Biol 15: 523–529. 10.1016/j.pbi.2012.09.006 - DOI - PubMed
    1. Mozgova I, Hennig L (2015) The Polycomb Group Protein Regulatory Network. Annu Rev Plant Biol. - PubMed
    1. Grossniklaus U, Paro R (2014) Transcriptional silencing by polycomb-group proteins. Cold Spring Harb Perspect Biol 6: a019331 10.1101/cshperspect.a019331 - DOI - PMC - PubMed
    1. Xiao J, Wagner D (2015) Polycomb repression in the regulation of growth and development in Arabidopsis. Curr Opin Plant Biol 23C: 15–24. - PubMed
    1. Goodrich J, Puangsomlee P, Martin M, Long D, Meyerowitz EM, et al. (1997) A Polycomb-group gene regulates homeotic gene expression in Arabidopsis. Nature 386: 44–51. - PubMed

Publication types

MeSH terms