. 2016 Jan 21;529(7586):358-363.
doi: 10.1038/nature16509. Epub 2016 Jan 13.

Codon influence on protein expression in E. coli correlates with mRNA levels

Affiliations

Codon influence on protein expression in E. coli correlates with mRNA levels

Grégory Boël et al. Nature. .

Abstract

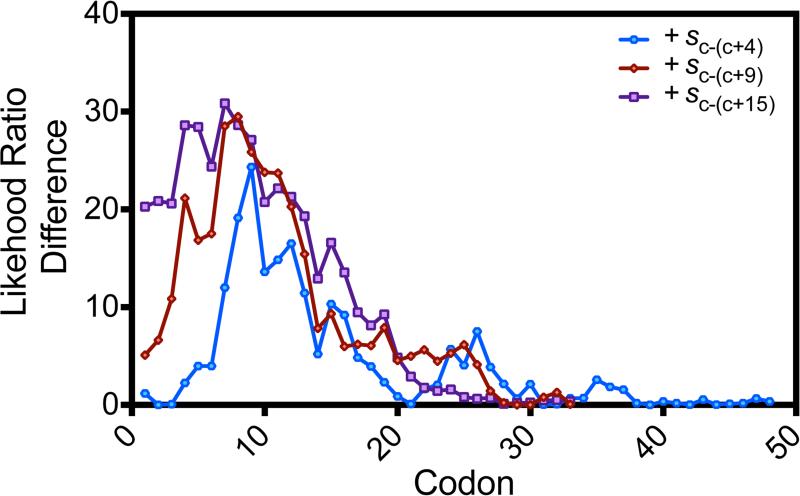
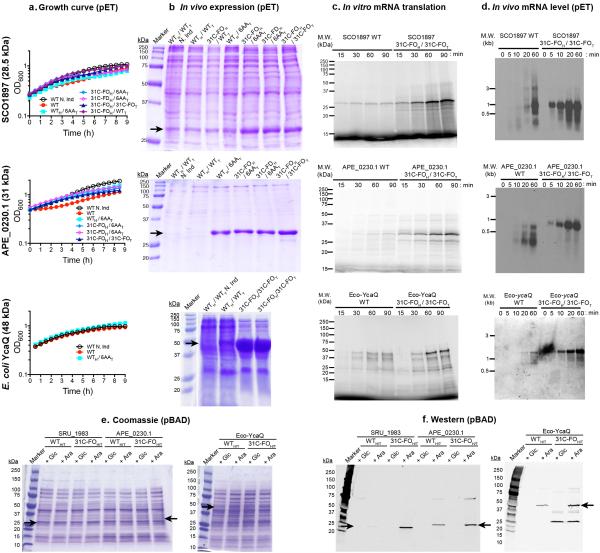
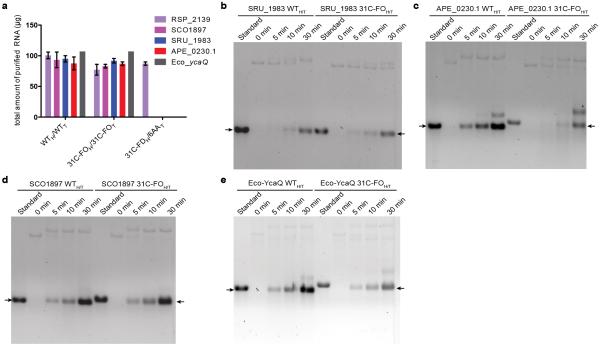
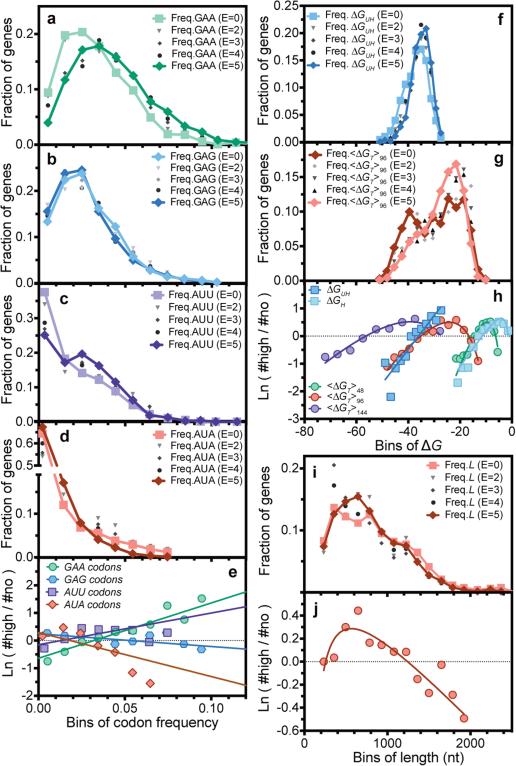
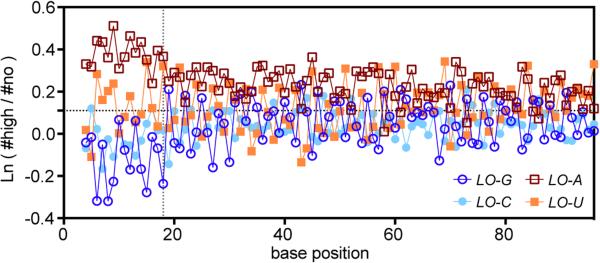
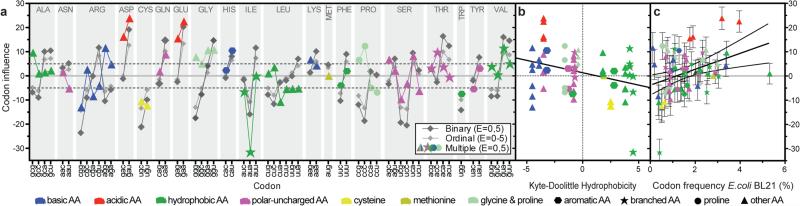
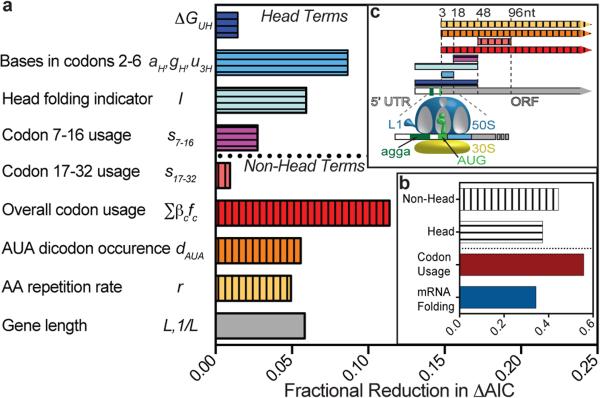
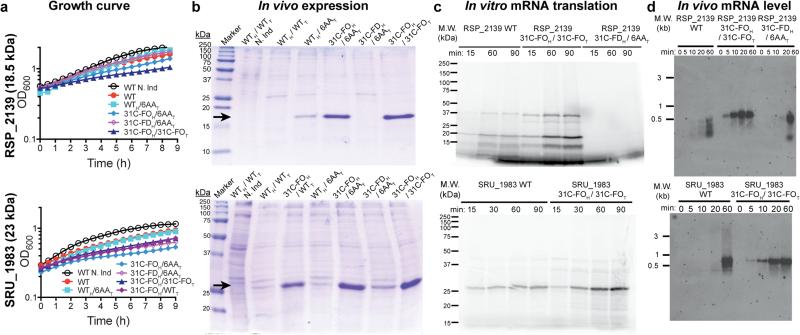
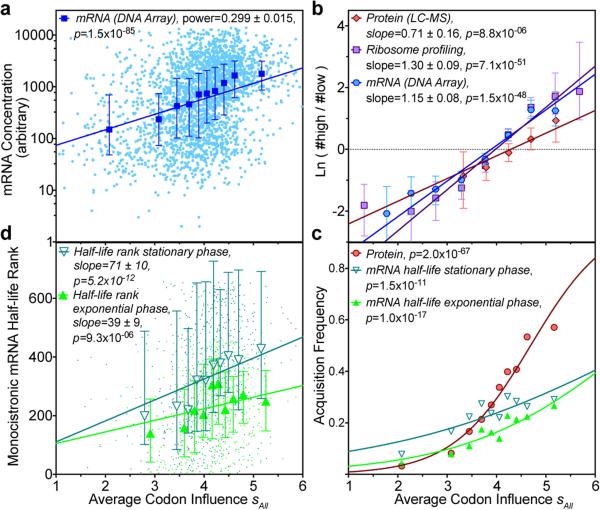
Degeneracy in the genetic code, which enables a single protein to be encoded by a multitude of synonymous gene sequences, has an important role in regulating protein expression, but substantial uncertainty exists concerning the details of this phenomenon. Here we analyse the sequence features influencing protein expression levels in 6,348 experiments using bacteriophage T7 polymerase to synthesize messenger RNA in Escherichia coli. Logistic regression yields a new codon-influence metric that correlates only weakly with genomic codon-usage frequency, but strongly with global physiological protein concentrations and also mRNA concentrations and lifetimes in vivo. Overall, the codon content influences protein expression more strongly than mRNA-folding parameters, although the latter dominate in the initial ~16 codons. Genes redesigned based on our analyses are transcribed with unaltered efficiency but translated with higher efficiency in vitro. The less efficiently translated native sequences show greatly reduced mRNA levels in vivo. Our results suggest that codon content modulates a kinetic competition between protein elongation and mRNA degradation that is a central feature of the physiology and also possibly the regulation of translation in E. coli.


Figures

Extended Data Figure 1
Extended Data Figure 1. Phylogenic distribution of the proteins in the large-scale protein expression data set
The colors in the cladogram encode the number of proteins from each organism, as indicated by the legend. The data set includes 47 from eukaryotes (45 from humans and 2 from mouse), 809 from archaebacteria, and 96 from E. coli, with the remainder coming from other eubacteria. The organism contributing the largest number of proteins to the data set is the eubacterium Bacteroides thetaiotaomicron (150 proteins).
Extended Data Figure 2
Extended Data Figure 2. Relationships between additional mRNA sequence parameters and results in the large-scale protein expression data set
a, i, k, Histograms showing for each expression score the distribution of the overall G+C frequency (a), the frequency in all reading frames of the AGGA core sequence of the Shine–Dalgarno ribosome-binding sequence (i), and the amino acid repetition rate r (k; see Methods for definition). The parameter distributions in the E = 5 and E = 0 categories (n = 3,727) are shown in a in dark and light blue, respectively, and in i and k in red and black, respectively. The symbols used for the histograms for the intermediate expression scores (n = 2,621) are indicated in the legend for each panel. bh, j, lo, Plots showing the logarithm of the ratio of the number of proteins with E = 5 versus E = 0 scores as a function of parameter value. b, Data for the overall frequencies of the four individual nucleotide bases as well as the combined G+C frequency (labeled GC). ce, The equivalent data separately for the first (c), second (d) and third (e) positions in the codons in the genes. f, Data for genes either not containing or containing at least one occurrence of the ATA–ATA di-codon (P = 2 × 10⁻³²). The error bars in this panel represent 95% confidence limits calculated from bootstrapping; the error bars for the genes without any occurrence of this di-codon are smaller than the size of the symbol. g, h, Data for the codon adaptation index (g) and tRNA adaptation index (h). j, Data for the frequency in all reading frames of the sequence AGGA. l, m, Data for the amino acid repetition rate r (l) and the codon repetition rate (m). n, o, Data for the statistical entropy of the amino acid (n) and codon sequences (o). The data in ae, i and k are binned in equal ranges of the parameter value, while the data in g, h, j and lo are binned in deciles containing equal populations.
Extended Data Figure 3
Extended Data Figure 3. Correlations between sequence parameters in the genes included in the large-scale protein expression data set
ac, Corrgrams representing the signed Pearson correlations coefficients between different mRNA sequence parameters in the genes in the E = 0 and E = 5 categories in the data set (n = 3,727). The color-coding is defined schematically on the left in a, with blue being used for positively correlated variables, red for negatively correlated variables, and white for uncorrelated variables. In a, E represents the expression score in the binary categories (0, 5), sAll represents the mean value of our new codon-influence metric (colored symbols in Fig. 3a) over the entire gene (without the LEHHHHH tag), s7–16 and s17–32 represent the mean values of this metric for codons 7–16 and 17–32, respectively, ΔGUH represents the predicted free energy of mRNA folding for the 5′-UTR from the pET21 expression vector plus the first 48 nucleotides in the gene, <ΔGT>96 represents the mean value in the remainder of the gene of the predicted free energy of folding in 50% overlapping windows of 96 nucleotides, I represents an indicator variable that assumes a value of 0 or 1 if (ΔGUH < −39 kcal mol−1) and (%GC2–6 > 0.65), dAUA assumes a value of 0 or 1 if there is at least one occurrence of the ATA–ATA di-codon, r represents the codon repetition rate (see Methods), and %GC represents the percentage content of G plus C bases in the gene. The variables aH, aH2, gH2 and u3H represent monomial functions of the fractional content of A, G and U bases in codons 2–6; the correlation coefficient for these nucleotide-composition terms was calculated using their sum weighted by their optimized coefficients from model M (Fig. 4 and Extended Data Table 1a), as given in the equation in the main text. b, Data for the frequencies of the codons positively correlated with E. c, Data for the frequencies of the codons positively correlated with E. dg, Two-dimensional histograms illustrating the dependence of results in the large-scale protein-expression data set on pairs of sequence parameters. The colors encode the fractional excess of proteins with E = 5 versus E = 0 scores (that is, (#E5 − #E0)/(#E5 + #E0)), as calibrated by the scale bar on the right. The area of each square is proportional to the number of proteins in that bin in the two-dimensional parameter space. The variables sAll, s7–16 and stail represent, respectively, the mean values of our new codon-influence metric for the entire gene, for codons 7–16, and for all of the remaining codons downstream in the gene. ΔGUH represents the predicted free energy of mRNA folding for the 5′-UTR from the pET21 expression vector plus the first 48 nucleotides in the gene, <ΔGT>96 represents the mean value in the remainder of the gene of the predicted free energy of folding in 50% overlapping windows of 96 nucleotides, and r represents the amino acid repetition rate (as defined in Methods).
Extended Data Figure 4
Extended Data Figure 4. Relationship of the new codon-influence metric to parameters assumed to influence translation efficiency in previous literature
a, Average frequency of each non-stop codon in the genes in just the E = 0 and E = 5 categories (dark grey) or in the E = 0 to E = 5 categories (light grey), with error bars representing the s.d. of the frequency among the genes in each set. b, Codon slopes from single-variable binary logistic regressions (dark grey symbols in Fig. 3a) segregated according to the identity of the nucleotide at each of the three positions in the codon. These slopes come from regressions that were performed separately for each of the individual 61 non-stop codons. c, Codon slopes from the simultaneous multi-parameter binary logistic regression model M (Extended Data Table 1a and colored symbols in Fig. 3a) segregated according to the identity of the nucleotide at each of the three positions in the codon. dh, The codon slopes from model M plotted versus the relative synonymous codon usage (RSCU) in E. coli BL21 (e), the codon adaptation index in E. coli K12 (f), the codon sensitivity in E. coli K12 (d), the tRNA adaptation index in E. coli K12 (g), and the concentration of exactly cognate tRNAs in E. coli K12 (h). The shapes and color-coding of the symbols in bh, which are the same as in Fig. 3, encode structural and qualitative chemical characteristics of the amino acids.
Extended Data Figure 5
Extended Data Figure 5. Variation in codon influence as a function of position in the coding sequence
Plots showing the reduction in the deviance of the computational model resulting from adding a term representing the average value of the codon slope (colored symbols in Fig. 3a) in a window 5, 10 or 16 codons wide starting at the position indicated on the abscissa (that is, c-(c+4) in blue, c-(c+9) in red, or c-(c+15) in purple, respectively). The reduction in deviance was calculated relative to a base model containing codon frequencies in the entire coding sequence, head nucleotide composition terms (and aH, aH2, u3H and gH2), the predicted free energy of RNA folding in the head plus the 5′-UTR (ΔGUH), the binary indicator variable for head folding effects I, the binary variable indicating the occurrence of an AUAAUA di-codon dAUA, and the codon repetition rate r (n = 3,727). The mean slope of codons 2–6 presumably does not improve the model because the head-composition terms rather than codon content dominate the influence of this region on protein-expression level. This effect also probably accounts for the peaks in the sc-(c+9) and sc-(c+15) plots for windows starting at codon 7. For reference, adding s7–16 and s16–32 terms to model M contributes 29.7 points (P = 5 × 10⁻⁸) and 12 points (P = 5 × 10⁻⁴) of model deviance, respectively (Extended Data Table 1 and Fig. 4a). Dropping out terms to measure their influence (Fig. 4a) shows every codon contributes on average (423.7/270) = 1.6 deviance units, while codons 7–16 each contribute on average an additional (29.6/10) = 3.0 deviance units. Therefore, individual codons at positions 7–16 are approximately three times more influential than those in the tail of the gene.
Extended Data Figure 6
Extended Data Figure 6. Further experiments on synthetic genes designed to enhance protein expression
ad, Data for three additional proteins equivalent to that presented in Fig. 5. The in vivo and in vitro expression properties from pET vectors are compared for inefficiently translated native (WT) genes and synonymous genes redesigned in the head or the tail or both using the 6AA, 31C-FO or 31C-FD methods. The type of sequence in the head (H) is indicated separately from that in the tail (T), and the name of the target protein is indicated on the left on each row. a, E. coli BL21(DE3) host cell growth curves at room temperature after induction of the target gene at time zero in chemically defined MJ9 medium. b, Coomassie-blue-stained SDS–PAGE gels of whole cells after overnight induction at 18 °C, with the amount loaded in each lane normalized to the A600 nm of the culture at the time of harvest. Black arrow indicates the migration position of the target protein. c, Autoradiographs of SDS–PAGE gels of in vitro translation reactions using fully purified translation components in the presence of [35S]methionine. Each reaction contained an equal amount of purified mRNA that was transcribed in vitro using T7 RNA polymerase. d, Northern blot analyses of the mRNA for the target protein after induction of expression in vivo. An equal amount of total RNA was loaded in each lane, and blots were hybridized with a probe matching the 5′-UTR. e, f, Coomassie blue stained SDS–PAGE gels (e) and anti-tetrahistidine western blots (f) showing that gene optimization has equivalent effects at physiological protein expression levels. Pairs of synonymous native and codon-optimized 31C-FOH/T genes with C-terminal hexahistidine tags were re-cloned under control of the arabinose-inducible promoter in a pBAD vector, and the concentration of arabinose in the growth medium was adjusted so the 31C-FOH/T genes yeilded protein expression in the physiological range as assessed from Coomassie blue stained SDS-PAGE gels of whole cell extracts. Black arrows indicate locations of the induced target proteins. Substantially lower protein expression from the WT genes compared to the synonymous 31C-FOH/T genes in these experiments demonstrates that equivalent codon-usage effects are observed when proteins are overexpressed using a pET vector or expressed at roughly phyiological level using a pBAD vector, despite changes explained in the Online Methods in the polymerase used to transcribe the genes, the medium used to grow the cells, and the timescale and temperature of the protein-induction process.The constitutively expressed ~25-kDa protein that reacts with the anti-tetrahistidine antibody in the cells containing the 31C-FOH/T gene for YcaQ is probably an amino-terminally truncated protein synthesized from a 5′-truncated mRNA transcribed from an internal promoter sequence fortuitously introduced into this synthetic gene. Uncropped scans of the gels shown here are included in Supplementary Fig. 1.
Extended Data Figure 7
Extended Data Figure 7. In vivo expression of synthetic genes with sequences optimized using the 31C-FO method
a, Coomassie-blue-stained SDS–PAGE gels of whole-cell extracts after overnight induction at 18 °C of synthetic genes designed using the 31C-FOH method for 17 different proteins. All genes were cloned in-frame with a C-terminal hexa-histidine tag in the same pET21 plasmid derivative used to generate our large-scale protein-expression data set. Equal volumes of induced cultures were loaded in all lanes. b, Coomassie-blue-stained SDS–PAGE gels of whole-cell extracts (top) and the corresponding soluble fractions (bottom) after overnight induction at 18 °C of 14 of the same synthetic genes fused in-frame at the C terminus of the gene for the E. coli maltose-binding protein (MBP). The protein sequences come from the following source organisms: LCABL_04230 from Lactobacillus casei BL23; VIPARP466_2889 from Vibrio parahaemolyticus; AM1_4824 from Acaryochloris marina MBIC11017; CLO_0718 from Clostridium botulinum E1; ESAG_04692 from Escherichia sp. 3_2_53FAA; FTCG_00666 and FTCG_01175 from Francisella tularensis subsp. novicida GA99-3549; FTE_1275, FTE_1608, FTE_0420 and FTE_1020 from Francisella tularensis subsp. novicida FTE; FRANO wbtG and A1DS62_FRANO from Francisella novicidal; FTBG_00988 and A7JEH2_FRATL from Francisella tularensis subsp. tularensis FSC033; FTN_1238 from Francisella tularensis subsp. novicida U112; O1O_09285 from Pseudomonas aeruginosa MPAO1/P1; Sthe_2331 from Sphaerobacter thermophilus DSM20745/S6022; SEVCU126_0606 from Staphylococcus epidermidis VCU126; and Y007_20720 from Salmonella enterica subsp. enterica serovar Montevideo 507440-20.
Extended Data Figure 8
Extended Data Figure 8. Yield of mRNA from in vitro transcription using purified T7 RNA polymerase
a, Final yield of mRNA purified from reactions conducted under identical conditions, as described in the Methods. The yields were calculated from the optical density at 260 nm. be, Kinetic analyses of in vitro transcription reactions using formaldehyde-agarose gel electrophoresis. Samples were taken at 0, 5, 10 and 30 min. The gels were stained with ethidium bromide. The ‘standard’ lane contains 1 μg of the same mRNA after purification to enable calibration for differences in the sensitivity of the molecules to staining. Reactions were started by addition of the wild-type or 31C-FOH/31C-FOT (31C-FOH/T) linearized plasmids encoding SRU_1983 (b), APE_0230.1 (c), SCO1897 (d),or Eco-YcaQ (e).
Figure 1
Figure 1. Distributions of representative RNA sequence parameters in protein-expression categories in the large-scale dataset
(a-d, f, g and i) Histograms showing frequencies of GAA (panel a) and GAG (panel b) codons for Glu, AUU (panel c) and AUA (panel d) codons for Ile, partition-function free energy of folding of the 5’-UTR plus initial 16 codons or “Head” of each gene (ΔGUH, panel f), average partition-function free energy of folding in the remainder or “Tail” of each gene in 50% overlapping windows with width w (<ΔGT>w, panel g), and number of nucleotides in the protein-coding sequences (nts, panel i). Light colors, dark colors, and shades of gray show distributions in the E = 0, E = 5, and E = 1-4 categories, respectively. (e, h and j) Corresponding “log-odds” plots showing the logarithm of the ratio of the number of proteins in the E5 vs. E0 categories. Solid lines show single-variable binary generalized linear logistic regressions, i.e., fitting of log-odds ratio using a combination of the first and second powers and inverse of each individual parameter. Codon regressions were performed using exclusively the first power of frequency, yielding the dark gray codon slopes in Fig. 3a. P-values for regressions shown here other than GAA frequency are 3-45 orders of magnitude below the Bonferroni-corrected 5% confidence threshold of 2 × 10⁻⁴ (Supplementary File Boel2015LogisticRegressions.xlsx).
Figure 2
Figure 2. Log-odds ratio for E5 vs. E0 categories for proteins encoded by each nucleotide base at positions 4-96
The gray dotted line approximates the region protected by the ribosome in the 70S initiation complex. Position 1 is A in the AUG initiation codon.
Figure 3
Figure 3. Codon influence on protein expression in the large-scale dataset
(a) Slopes for every non-stop codon from single parameter binary logistic regression analyses of the E = 0 vs. E = 5 categories (dark gray), single parameter ordinal logistic regression analyses of the E = 0-5 categories (light gray), and simultaneous multi-parameter binary logistic regression analysis of the E = 0 vs. E = 5 categories (Model M in Table S1, colored symbols). Shapes and colors encode the structures and qualitative chemical characteristics of the sidechains, respectively. (b-c) Codon slopes from the multi-parameter binary logistic regression plotted against Kyte-Doolittle amino-acid hydrophobicity (panel b) or E. coli BL21 codon-usage frequency (panel c).
Figure 4
Figure 4. Contributions of physicochemical factors and regions of the coding sequence to protein-expression level
(a-b) Bar graphs showing the fractional reduction in the magnitude of ΔAIC when omitting individual (panel a) or combinations (panel b) of terms prior to re-optimizing the remaining terms in Model M (Table S1). ΔAIC, the change in the Akaike Information Criterion, quantifies the predictive power of the model compared to random expectation. (c) Schematic illustrating the region of the protein-coding sequence included when calculating the term represented by the same color. Numbering starts at the first nucleotide (nt) in the start codon. Terms related to mRNA folding are shown in blue and cyan. Those related to codon usage are shown in red, orange, yellow, and magenta.
Figure 5
Figure 5. Analyses of synthetic genes designed to enhance protein expression
Synonymous variants of inefficiently translated native (WT) genes were redesigned in the head or tail or both using the 6AA, 31C folding optimized (31C-FO), or 31C folding deoptimized (31C-FD) methods. The type of sequence in the head (subscript H) and tail (subscript T) is indicated separately. “N. Ind.” indicates non-induced control. (a) Growth curves at room temperature after induction at time zero in E. coli BL21(DE3). (b) Coomasie Blue stained SDS-PAGE gels of cells induced overnight at 18° C, with loads normalized to final OD600. Black arrows indicate the target proteins. (c) Autoradiographs of SDS-PAGE gels of in vitro translation reactions in the presence of [35S]-methionine using fully purified components to translate an equal amount of purified mRNA transcribed in vitro by T7 RNA polymerase. Higher molecular weight bands represent SDS-resistant oligomers. (d) Northern blots of equal amounts of total RNA isolated at the indicated times after induction, hybridized with a probe matching the 5’UTR.
Figure 6
Figure 6. Codon influence on protein expression correlates with endogenous E. coli protein levels and mRNA levels and lifetimes
(a) Logarithm of mRNA level of predicted cytoplasmic proteins plotted vs. sAll, the average of our codon-influence metric (colored symbols in Fig. 3a). Cyan dots show individual genes in a microarray analysis. Blue symbols/bars show the corresponding decile plot (i.e., median/25th-75th percentiles in bins with equal population). P-value is from linear regression. (b) Log-odds plot of predicted cytoplasmic genes/proteins in top vs. bottom 30% of the population in genome-scale in vivo profiles of exponentially growing cells in defined medium. Cyan, red, and magenta represent data from, respectively, the microarray data (panel a, n = 2,817), a mass spectrometric analysis of protein concentration (n = 825), and a deep-sequencing analysis of ribosome distribution on mRNAs (n = 2,597). Bins contain equal numbers of genes/proteins in each dataset. Error bars show 95% bootstrapping confidence limits. P-values are from binary logistic regression. (c) Decile plot showing fraction of all predicted cytosolic genes/proteins acquired in the mass spectrometric analysis of protein concentration (red) and in deep-sequencing analyses of mRNA lifetimes in exponential (green) or early stationary (teal) phase in LB. P-values are from binary logistic regressions. (d) Decile plot showing rank-order of mRNA lifetimes as a function of sAll in the proper reading frame. P-values are from Spearman correlation analysis; equivalent analyses in frames +1/+2 give p-values of 0.9/0.007 and 0.6/0.4 for exponential and stationary phases, respectively.

References

    1. Chen GT, Inouye M. Role of the AGA/AGG codons, the rarest codons in global gene expression in Escherichia coli. Genes Dev. 1994;8:2641–2652. - PubMed
    1. Deana A, Ehrlich R, Reiss C. Synonymous codon selection controls in vivo turnover and amount of mRNA in Escherichia coli bla and ompA genes. J Bacteriol. 1996;178:2718–2720. - PMC - PubMed
    1. Kudla G, Murray AW, Tollervey D, Plotkin JB. Coding-sequence determinants of gene expression in Escherichia coli. Science. 2009;324:255–258. - PMC - PubMed
    1. Tuller T, Waldman YY, Kupiec M, Ruppin E. Translation efficiency is determined by both codon bias and folding energy. Proc Natl Acad Sci U S A. 2010;107:3645–3650. - PMC - PubMed
    1. Goodman DB, Church GM, Kosuri S. Causes and Effects of N-Terminal Codon Bias in Bacterial Genes. Science. 2013 - PubMed

Publication types

MeSH terms

Associated data