. 2016 Jan 21;529(7586):351-7.
doi: 10.1038/nature16478. Epub 2016 Jan 13.

Divergent clonal selection dominates medulloblastoma at recurrence

A Sorana Morrissy  1   2 Livia Garzia  1   2 David J H Shih  1   2   3 Scott Zuyderduyn  4 Xi Huang  1 Patryk Skowron  1   2   3 Marc Remke  5 Florence M G Cavalli  1   2 Vijay Ramaswamy  1   2   3   6 Patricia E Lindsay  7   8 Salomeh Jelveh  8 Laura K Donovan  1   2 Xin Wang  1   2   3 Betty Luu  1   2 Kory Zayne  1   2 Yisu Li  9 Chelsea Mayoh  9 Nina Thiessen  9 Eloi Mercier  9 Karen L Mungall  9 Yusanne Ma  9 Kane Tse  9 Thomas Zeng  9 Karey Shumansky  10 Andrew J L Roth  10 Sohrab Shah  10 Hamza Farooq  1   2 Noriyuki Kijima  1   2 Borja L Holgado  1   2 John J Y Lee  1   2   3 Stuart Matan-Lithwick  1   2 Jessica Liu  1   2 Stephen C Mack  1   2   11 Alex Manno  1   2 K A Michealraj  1   2 Carolina Nor  1   2 John Peacock  1   2   3 Lei Qin  1   2 Juri Reimand  2   4 Adi Rolider  1   2 Yuan Y Thompson  1   2   3 Xiaochong Wu  1   2 Trevor Pugh  12 Adrian Ally  9 Mikhail Bilenky  9 Yaron S N Butterfield  9 Rebecca Carlsen  9 Young Cheng  9 Eric Chuah  9 Richard D Corbett  9 Noreen Dhalla  9 An He  9 Darlene Lee  9 Haiyan I Li  9 William Long  9 Michael Mayo  9 Patrick Plettner  9 Jenny Q Qian  9 Jacqueline E Schein  9 Angela Tam  9 Tina Wong  9 Inanc Birol  9   13   14 Yongjun Zhao  9 Claudia C Faria  15 José Pimentel  16 Sofia Nunes  17 Tarek Shalaby  18 Michael Grotzer  18 Ian F Pollack  19 Ronald L Hamilton  20 Xiao-Nan Li  21 Anne E Bendel  22 Daniel W Fults  23 Andrew W Walter  24 Toshihiro Kumabe  25 Teiji Tominaga  26 V Peter Collins  27 Yoon-Jae Cho  28 Caitlin Hoffman  6 David Lyden  29 Jeffrey H Wisoff  30 James H Garvin Jr  31 Duncan S Stearns  32 Luca Massimi  33 Ulrich Schüller  34 Jaroslav Sterba  35 Karel Zitterbart  35 Stephanie Puget  36 Olivier Ayrault  37 Sandra E Dunn  38 Daniela P C Tirapelli  39 Carlos G Carlotti  39 Helen Wheeler  40 Andrew R Hallahan  41   42 Wendy Ingram  41   43 Tobey J MacDonald  44 Jeffrey J Olson  45 Erwin G Van Meir  46 Ji-Yeoun Lee  47 Kyu-Chang Wang  47 Seung-Ki Kim  47 Byung-Kyu Cho  47 Torsten Pietsch  48 Gudrun Fleischhack  49 Stephan Tippelt  49 Young Shin Ra  50 Simon Bailey  51 Janet C Lindsey  51 Steven C Clifford  51 Charles G Eberhart  52 Michael K Cooper  53 Roger J Packer  54 Maura Massimino  55 Maria Luisa Garre  56 Ute Bartels  57 Uri Tabori  2   57 Cynthia E Hawkins  2   58 Peter Dirks  2   6 Eric Bouffet  2   57 James T Rutka  2   3   6 Robert J Wechsler-Reya  59 William A Weiss  60 Lara S Collier  61 Adam J Dupuy  62 Andrey Korshunov  63 David T W Jones  64 Marcel Kool  64 Paul A Northcott  64 Stefan M Pfister  64   65 David A Largaespada  66 Andrew J Mungall  9 Richard A Moore  9 Nada Jabado  67 Gary D Bader  4   68 Steven J M Jones  9   13   69 David Malkin  57   70 Marco A Marra  9   13 Michael D Taylor  1   2   3   6
Affiliations

Divergent clonal selection dominates medulloblastoma at recurrence

A Sorana Morrissy et al. Nature. .

Abstract

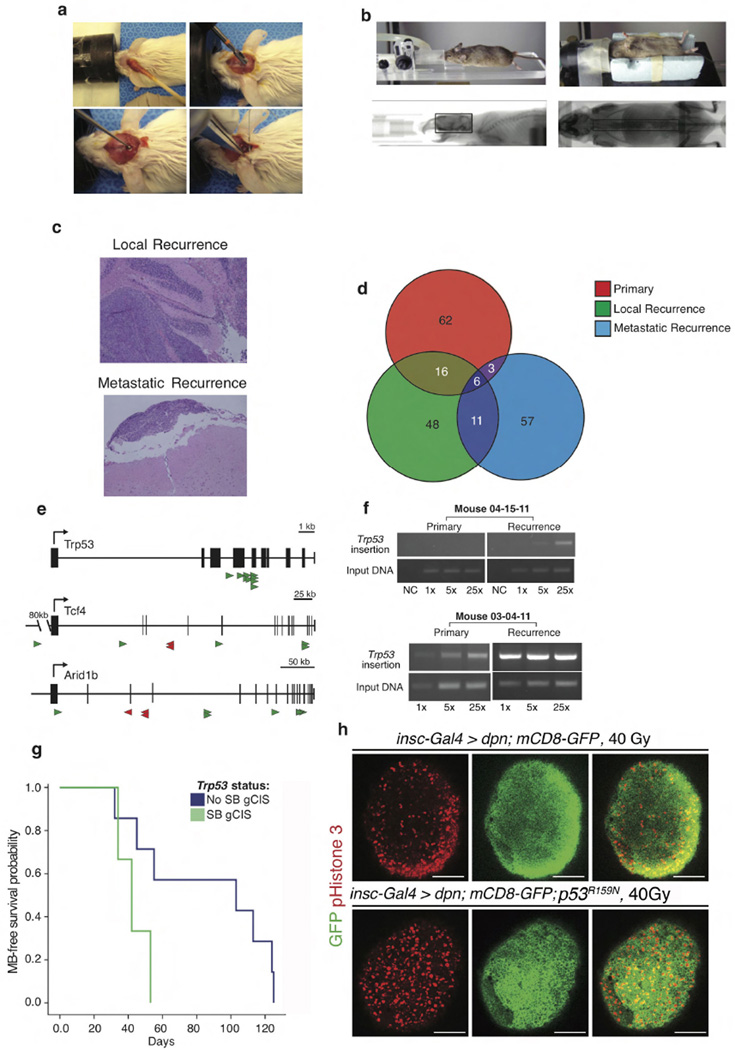
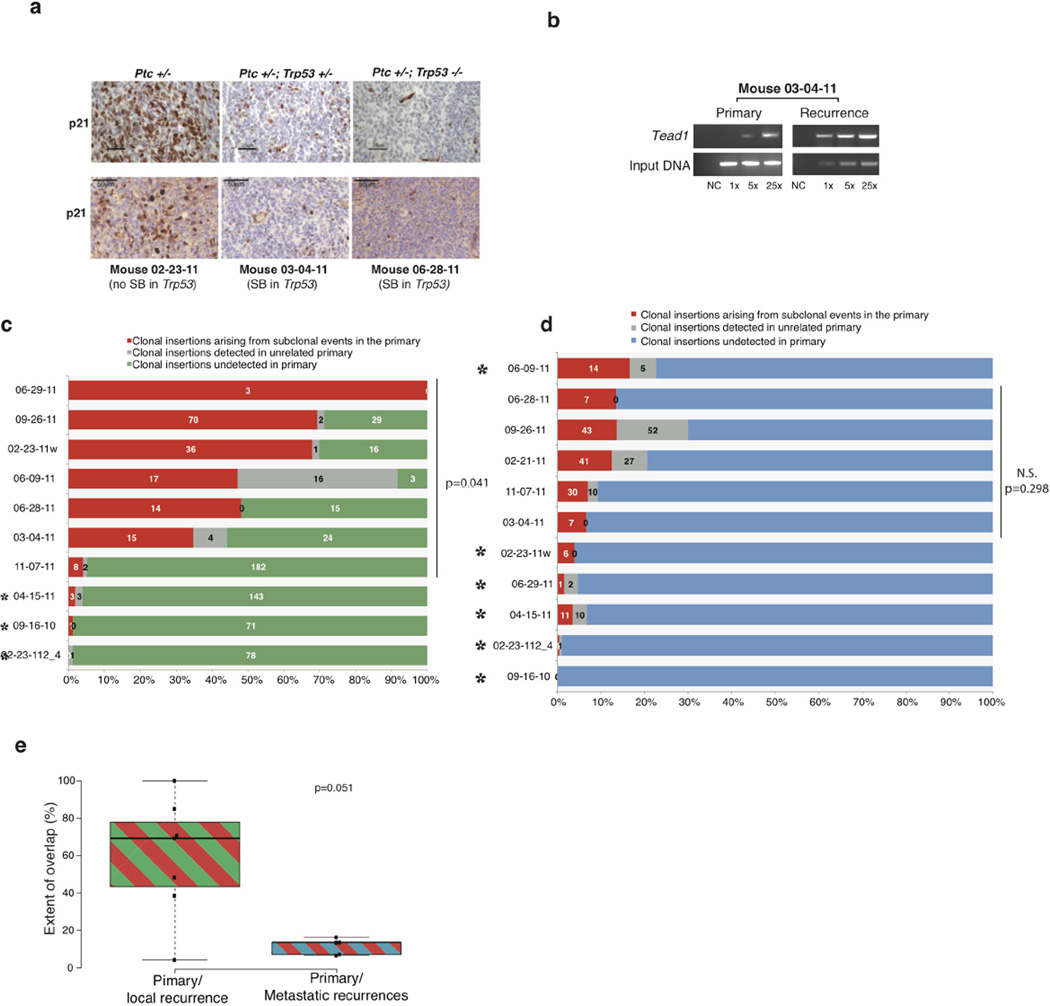
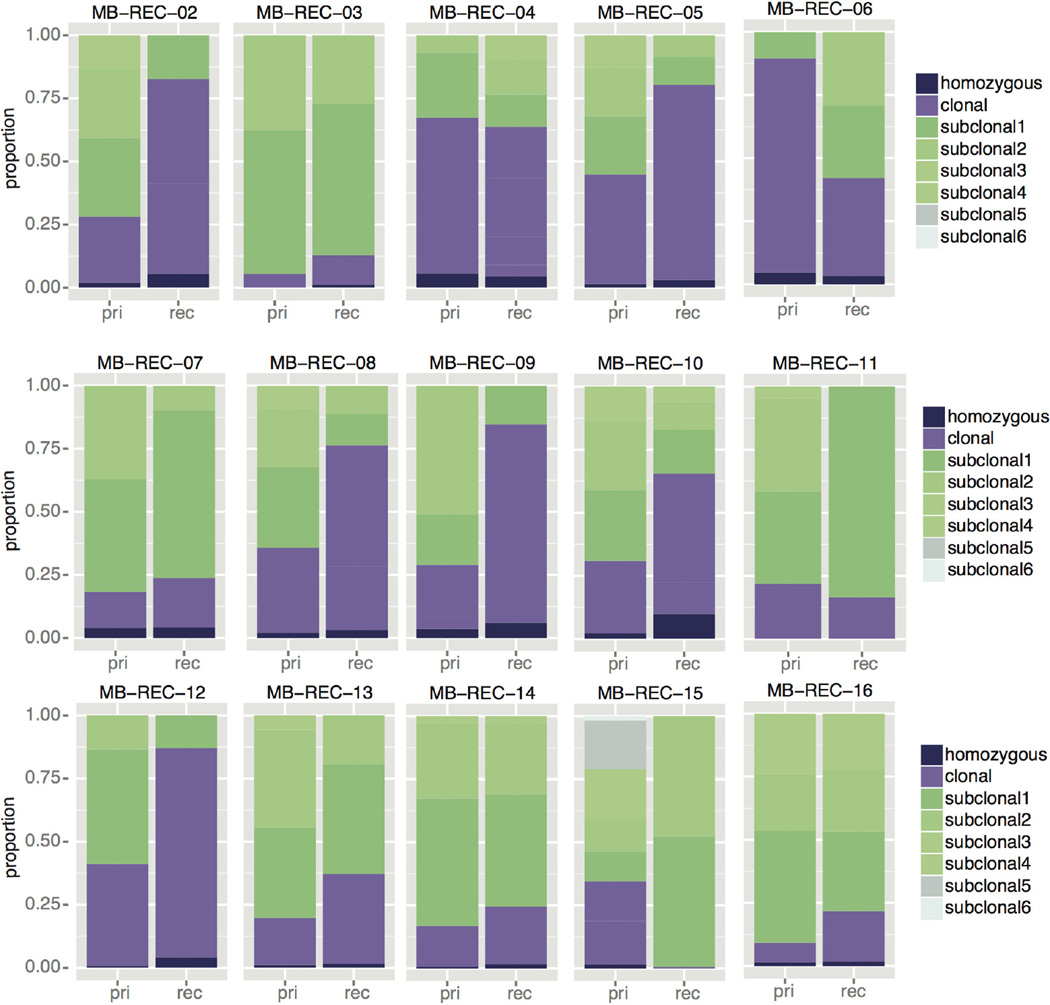
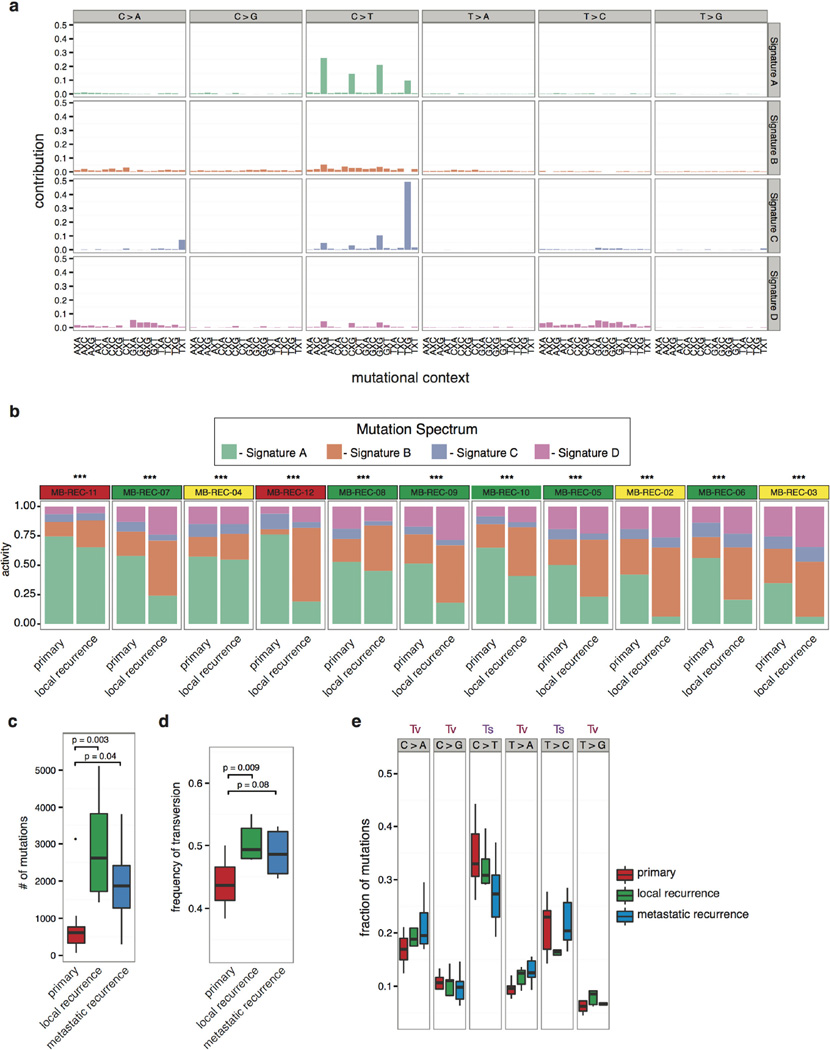
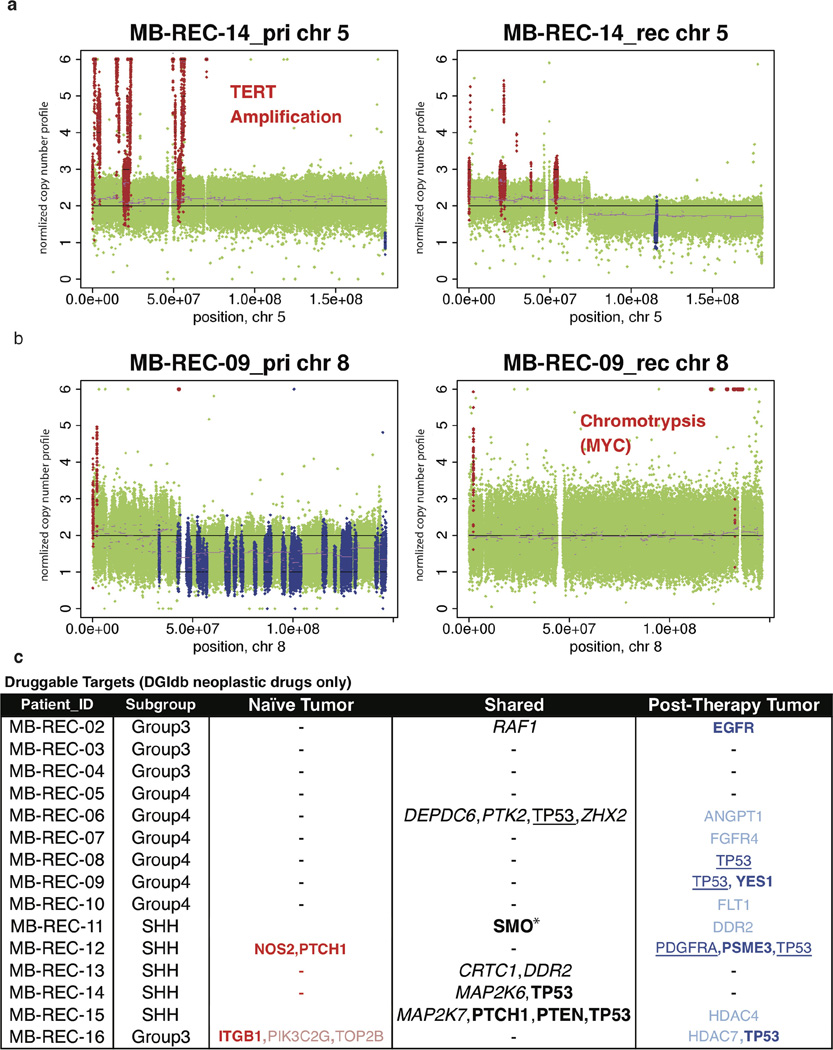
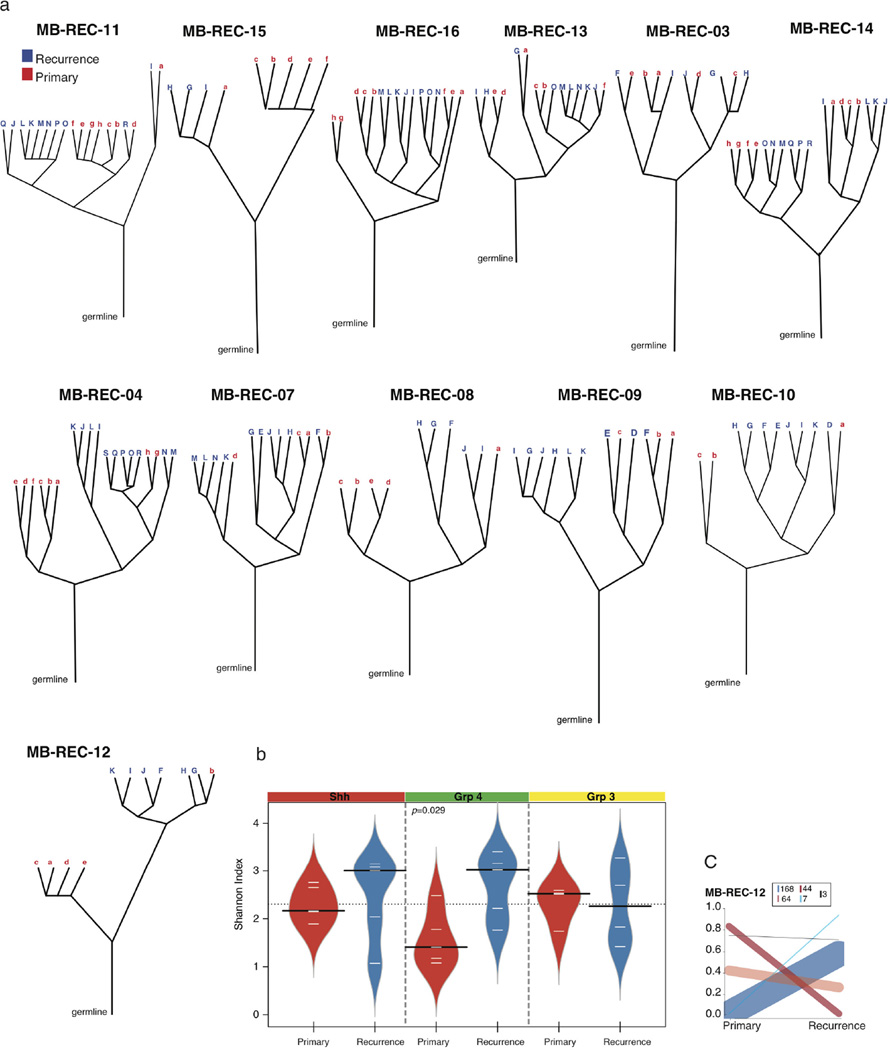
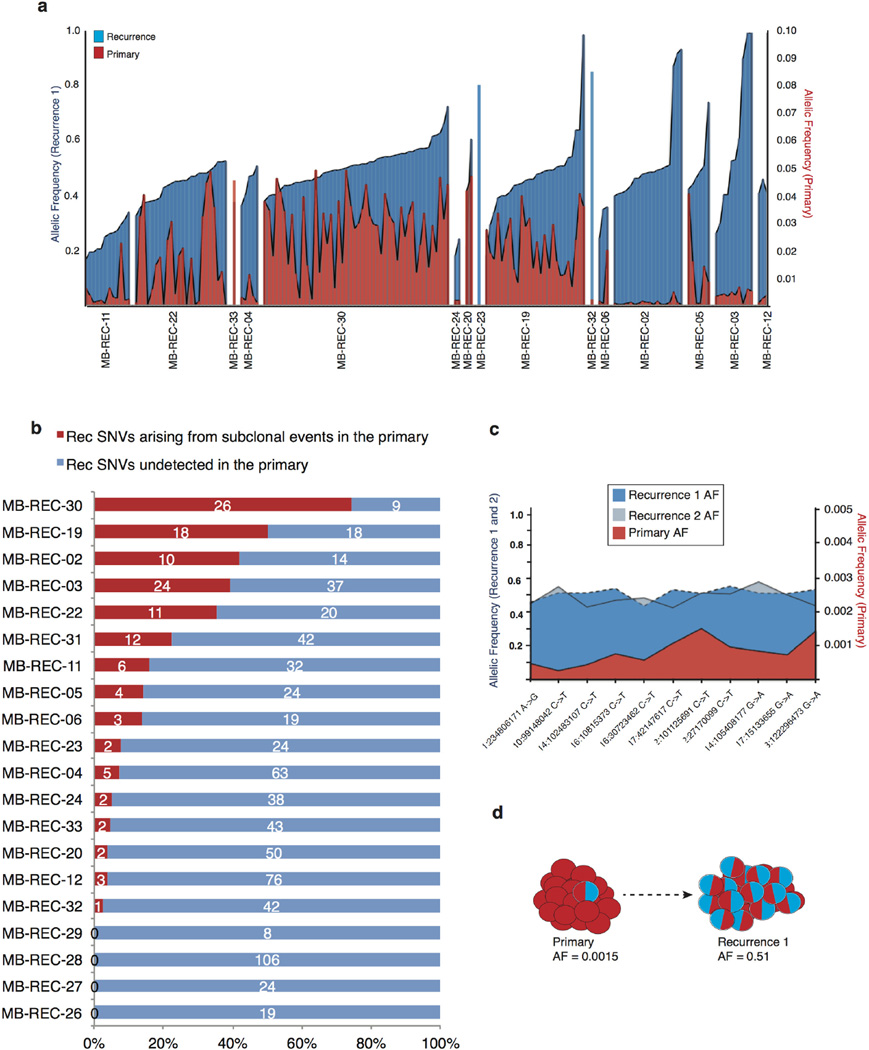
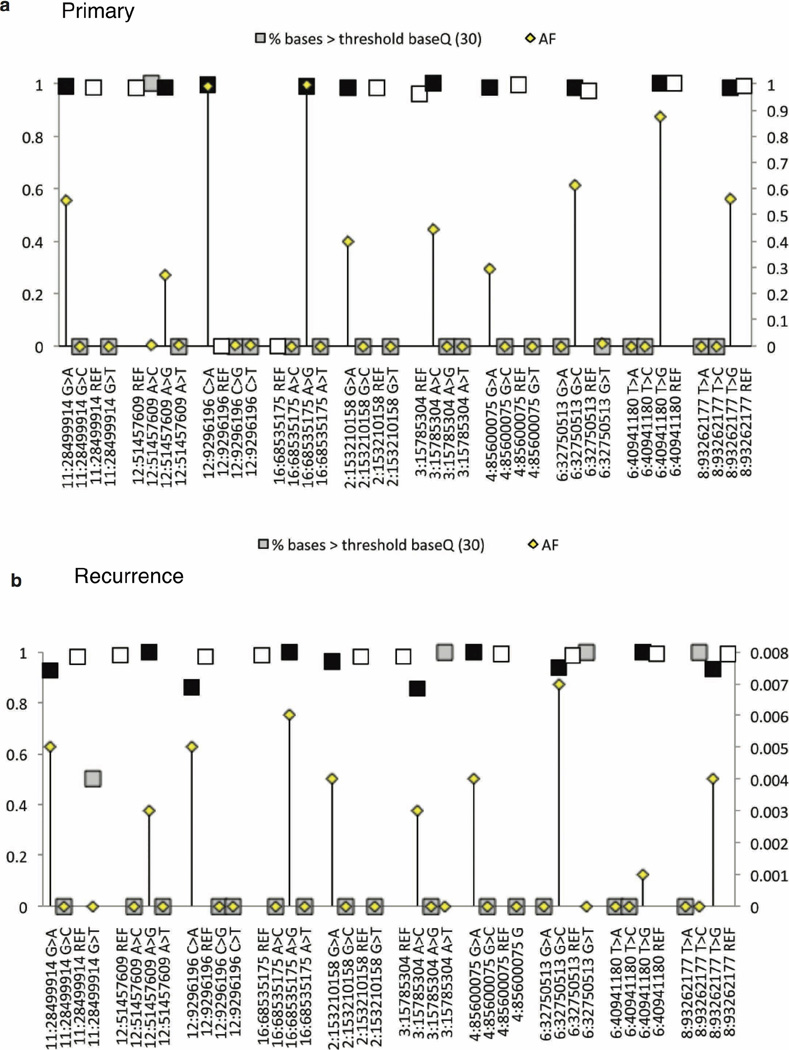
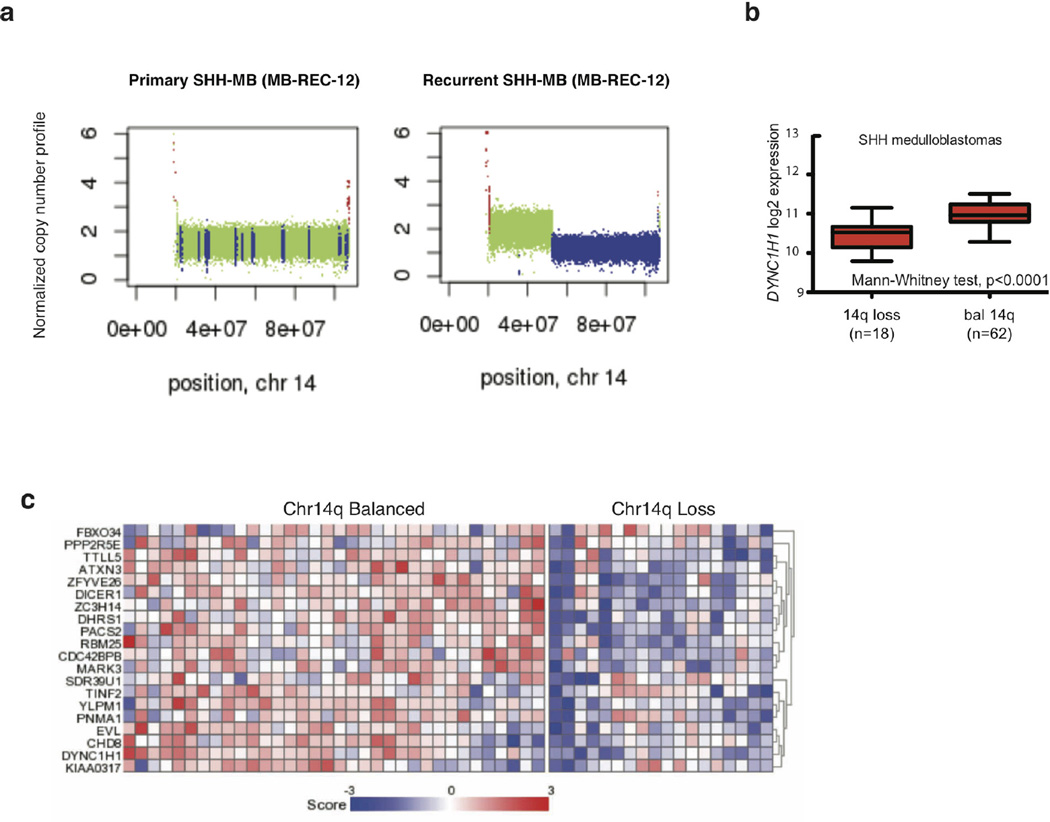
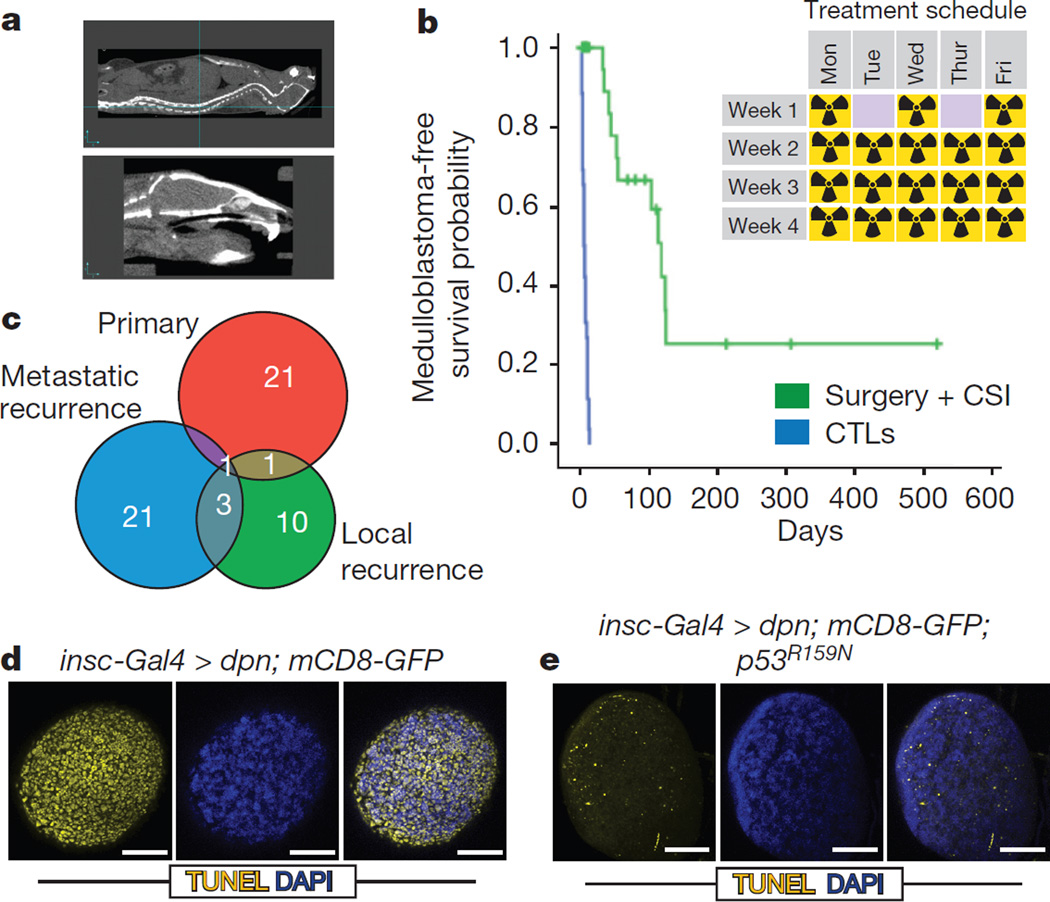
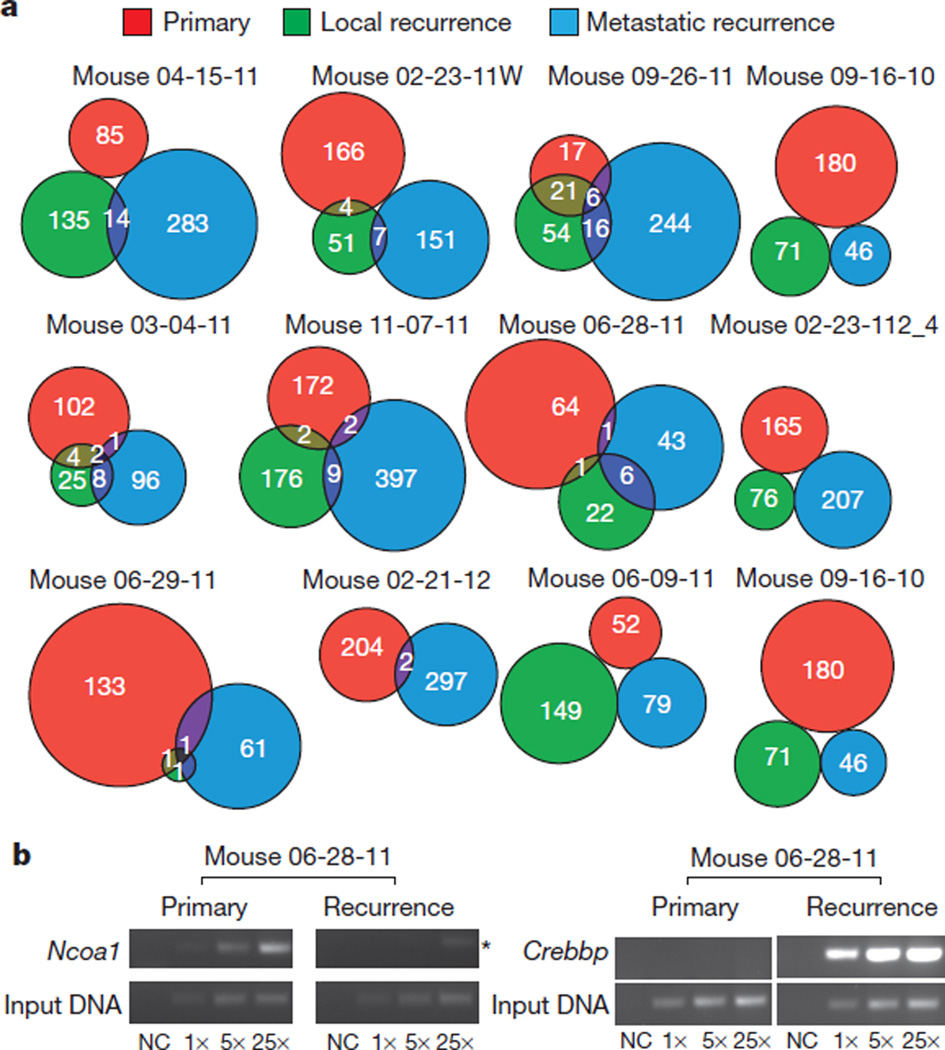
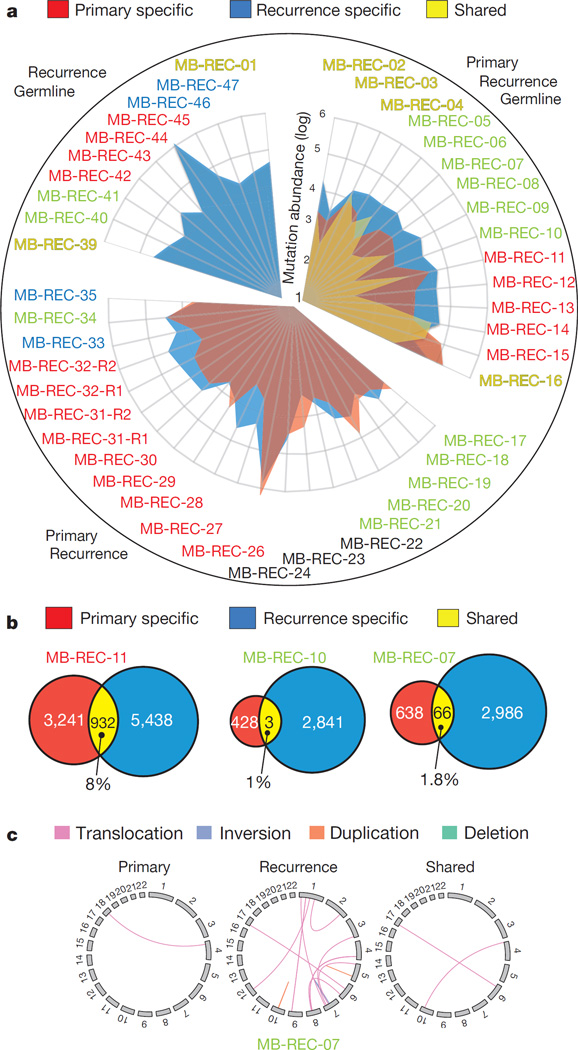
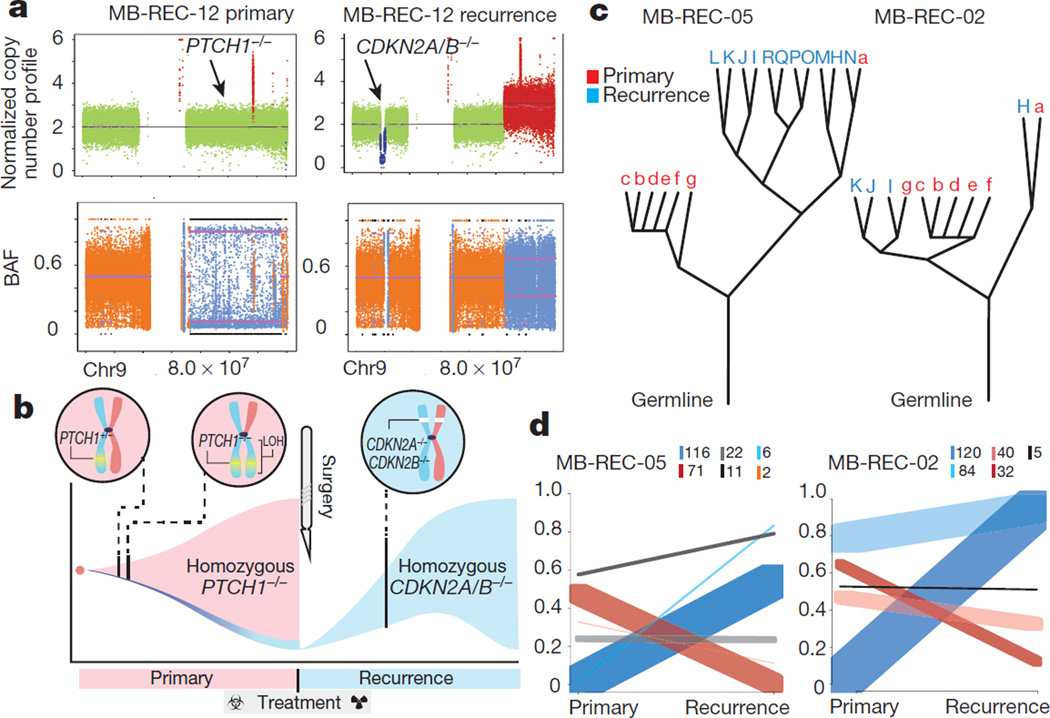
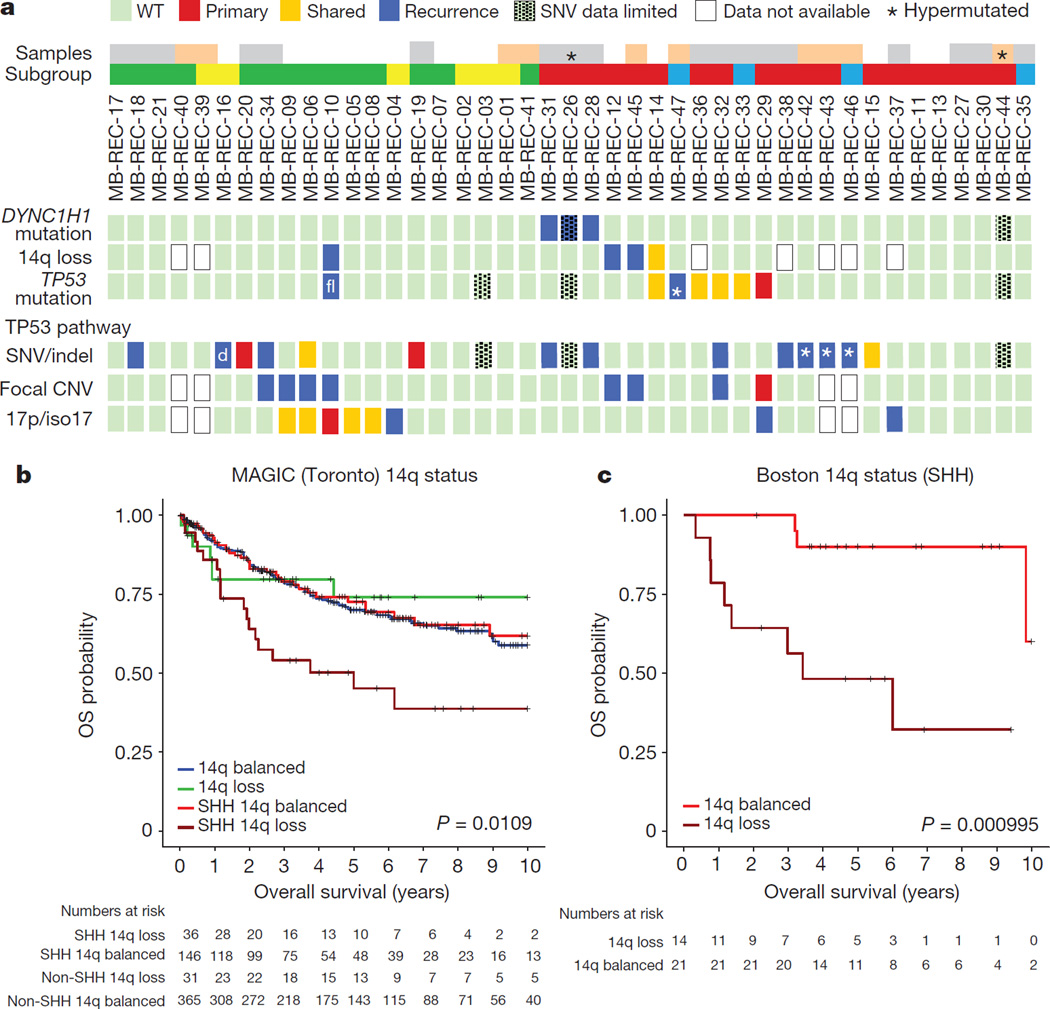
The development of targeted anti-cancer therapies through the study of cancer genomes is intended to increase survival rates and decrease treatment-related toxicity. We treated a transposon-driven, functional genomic mouse model of medulloblastoma with 'humanized' in vivo therapy (microneurosurgical tumour resection followed by multi-fractionated, image-guided radiotherapy). Genetic events in recurrent murine medulloblastoma exhibit a very poor overlap with those in matched murine diagnostic samples (<5%). Whole-genome sequencing of 33 pairs of human diagnostic and post-therapy medulloblastomas demonstrated substantial genetic divergence of the dominant clone after therapy (<12% diagnostic events were retained at recurrence). In both mice and humans, the dominant clone at recurrence arose through clonal selection of a pre-existing minor clone present at diagnosis. Targeted therapy is unlikely to be effective in the absence of the target, therefore our results offer a simple, proximal, and remediable explanation for the failure of prior clinical trials of targeted therapy.


Figures

Extended Data Figure 1
Extended Data Figure 1. Microneurosurgical resection and CT guided multi-fractionated craniospinal radiotherapy in a Shh mousemodel of medulloblastoma
a, Under general anaesthesia, Ptch+/−/Math1-SB11/T2Onc mice with symptomatic medulloblastoma underwent microneurosurgical posterior fossa craniotomy and subtotal tumour removal (n = 38), followed by post-operative care and monitoring. b, Subsequently, post-operative mice are recurrently anaesthetized, and receive multi-fractionated cranial and spinal cord irradiation in 18 fractions for a total of 36 Gy over a period of four weeks. Radiation is delivered under computed tomography (CT) guidance using custom-made mouse beds and collimators in order to precisely target the entire craniospinal axis. c, Mice that completed the entire course of craniospinal radiation were cured of disease in 39% of cases (7/18), while the remainder had to be euthanized as they recurred locally and/or with leptomeningeal metastases (61%, 11/18). Histology (haematoxylin and eosin staining) at the time of autopsy is shown. d, Extent of overlap of primary, local recurrences and metastatic recurrences initiator genes as predicted by a per-mouse driver modelling approach. e, Clonal transposon insertions in Trp53, Tcf4 and Arid1b disrupt the coding sequence of the gene. Sense orientation insertions are illustrated in green, antisense insertions in red. f, Insertion-site end-point PCR demonstrates Trp53 insertions that are clonal in the recurrence, but present only in a subclone of the matched primary tumour or completely absent. Three levels of input DNA were used for each sample (1×, 5× and 25×). g, Mice treated with microneurosurgical resection and craniospinal radiation, whose tumours show Trp53 gCIS insertions in the local recurrence show a trend for a shorter survival than similarly treated mice without Trp53 insertions (log-rank test; P = 0.054; n = 10). h, Drosophila brain tumours are induced by expressing dpn in the neural stem cell lineage using insc-Gal4. In response to a systemic 40 Gy irradiation at late third instar stage, overexpressing a dominant negative form of Drosophila p53, p53R159N, resulted in moderately increased mitosis in tumour cells labelled by the membrane GFP (mCD8–GFP), scale bar, 50 µm.
Extended Data Figure 2
Extended Data Figure 2. Subclonal events in primary mouse tumours become clonal at recurrence
a, Naive tumours from Ptch+/−, Ptch+/−/Trp53+/− or Ptch+/−/Trp53−/− germline mutant mice were analysed by immunohistochemical staining for nuclear p21 (upper panels), demonstrating decreased nuclear p21 expression due to Trp53 pathway dysfunction. Tumours with Trp53 damaging gCIS insertions at recurrence (03-04-11 and 06-28-11) also show decreased immunohistochemical staining for nuclear p21 staining (lower panels), when compared to a recurrent tumour without gCIS Trp53 insertions (02-23-11w) (scale bars, 25 µm and 50 µm as indicated). b, Relative dominance of driver events is shown in one individual tumour where Tead1 is detectable in both primary tumour sample and at recurrence. c, d, Clonal insertions in the local and metastatic recurrences that were found at a subclonal level in the matching primary tumours are shown by mouse. In each case, the number of insertions with evidence for expansion from a subclone of the primary is shown as a proportion (red bar) of the total number of considered events. Green and blue bars depict the proportion of the total number of considered events that were found in local and metastatic recurrences, respectively. The grey bar indicates the proportion of insertions that are also found in an unrelated Sleeping Beauty library of similar depth. We narrowed the analysis on matching primary recurrences with at least 1 clonal insertion in common. This excluded 3 local recurrence cases and 6 metastatic recurrence cases that had no overlap between clonal insertions in the primary and clonal insertions in the matching local recurrences (black stars). c, Local recurrences display statistical support for subclonal derivation from the primary tumours (P = 0.041; n = 7; Mann–Whitney U-test). d, Metastatic recurrences instead show a limited extent of overlap with the matching primaries that does not reach statistical significance (P = 0.298; n = 5; Mann–Whitney U-test). e, Box plot comparing the extent of overlap between primary/local recurrences versus primary/metastatic recurrences, local recurrences (with at least 1 clonal insertion in common with the primary) show a trend for higher evidence of subclonal derivation from their matched primaries than metastatic recurrences (P = 0.051, Mann–Whitney U-test, centre lines show the medians; box limits indicate the 25th and 75th percentiles; whiskers extend 1.5 times the interquartile range from the 25th and 75th percentiles, samples are represented by dots. n = 7 and 5 sample points).
Extended Data Figure 3
Extended Data Figure 3. Subclonal events in primary human tumours become clonal at recurrence
The proportion of somatic SNVs in the primary and recurrent disease compartments of 15 patients with matched germline is shown as a function of clonality. Black indicates homozygous events, purple indicates clonal SNVs, and subclonal SNVs are shown in green, where lighter shades correspond to less abundant subpopulations. On average, we observe a 1.9-fold increase in the proportion of clonal and homozygous events across the cohort (Student’s t-test; P value = 8.7 × 10⁻³, n = 15).
Extended Data Figure 4
Extended Data Figure 4. Altered spectra of somatic SNVs when comparing therapy-naive to recurrent tumours
a, Mutations in each tumour sample (n = 15) were classified based on their sequence context, and clustered into signatures that represent four known mutational processes. Signature A is the age-related signature observed in most tumour types (deamination of methyl-C). Signature B is characterized by C > A and C > T mutations without a strict context requirement. Signatures C and D respectively resemble the MSI-L and MSI-H signatures that correlate with low (MSI-L) or high (MSI-H) microsatellite instability. b, The contribution of each mutational process to each primary and recurrent tumour is summarized by patient. Recurrent tumours show a shift away from signature A, and an increased prevalence of signature B and signature D. *** P < 0.001, chi-squared test denotes significantly different distributions; NS denotes not significant. All tumours shifted mutational signatures at the time of recurrence, for a and b, n = 15. c, d, The number c, and frequency d, of transversion mutations is summarized in therapy-naive and recurrent samples. Significant increases in the number and frequency of transversions is most strongly observed in local recurrences, and to a lesser extent in metastatic recurrences. P < 0.05, Wilcoxon rank-sum test. e, Breakdown of transversion (Tv) and transition (Ts) mutations in therapy-naive and recurrent samples does not show a significant trend in specific nucleotide changes. Centre lines show the medians; box limits indicate the 25th and 75th percentiles; whiskers extend up to 1.5 times the interquartile range (from the 25th to the 75th percentiles), and data points beyond the whiskers are outliers represented by dots. For c, d and e, n = 13, n = 7 and n = 6, respectively.
Extended Data Figure 5
Extended Data Figure 5. Compartment-specific driver and druggable events in human tumours
a, High-level TERT amplification in the primary tumour of patient MB-REC-14 is absent in the recurrent sample. b, Chromothripsis involving the MYC locus is specific to the recurrent tumour on patient MB-REC-09 (P value = 3.97 × 10⁻⁷). c, Genes with defined interactions to neoplastic drugs (DGIdb http://dgidb.genome.wustl.edu/). The majority of patients (n = 15; with matched or parental germline) have distinct druggable targets in the naive versus post-therapy tumour samples. Bolded gene names indicate the presence of damaging mutations that are clonal (versus subclonal events in lighter colours), underlined gene names indicate copy number aberrations (for example, loss at the TP53 locus), and italicized gene names indicate structural rearrangements.
Extended Data Figure 6
Extended Data Figure 6. Clonal lineage evolution post-therapy in human tumours
a, Subpopulations of cells in each primary and recurrent tumour were identified using the EXPANDS algorithm, based on somatic SNVs and copy number gains and losses in each sample. Each subpopulation is thus distinguished by (1) a unique combination of somatic aberrations, which are (2) present in a particular subset of cells. Phylogenetic relationships between the primary (lowercase red letter labels) and recurrent (uppercase blue letter labels) tumour subpopulations indicate that in a majority of cases the recurrent tumour lineages are derived from only one lineage in the primary tumour, while only a small proportion of recurrent tumours had a more intermediate similarity to the primary tumour. b, The Shannon Index (SI) of each tumour is calculated using the cellular prevalence of the subpopulations defined by EXPANDS. Increasing values between the primary versus recurrent compartments indicate an increase in tumour heterogeneity (two tailed, paired t-test; P value = 0.029, Black lines show the medians; white lines represent individual data points; polygons represent the estimated density of the data). c, Clonal evolution between therapy-naive and matched recurrent tumours was assayed through ultra-deep sequencing (> 1,500×) of somatic mutations, and analysed using PyClone. Cellular frequencies of clones (y axis) are scaled by the number of mutations in each clone. Ancestral high-frequency clones present in both compartments indicate a common cell of origin in every case. Lower-frequency mutation clusters in the primary tumour indicate clones that subsequently expand to dominance in the recurrent tumour (blue lines). Higher frequency clusters in the primary tumour that are absent or extremely subclonal at the time of recurrence (red lines) indicate therapy-sensitive clones. The number of mutations studied that support each type of event are indicated in the inset box.
Extended Data Figure 7
Extended Data Figure 7. Subclonal expansion of rare (<5%) SNVs in the primary tumour to clonal dominance in the recurrent compartment
a, Deep amplicon sequencing was used to profile 20 patients with clonal SNVs restricted to their recurrent tumours as determined by 30× WGS data. Many ‘recurrence specific’ SNVs (blue) were found in a very minor subclone (< 5%) of the primary tumour (red) when studied by deep amplicon sequencing. Clonal SNVs (allele frequency >15%) in recurrent tumours that had >1 read supporting an alternate base in the primary tumour are shown by patient. In each case, the number of events with evidence for expansion from a clone present at <5% is shown as a proportion (red bar) of the total number of considered events (blue bar). b, Evidence for clonal expansion at recurrence of clones present at <5% in the untreated tumour was observed in 16/20 patients, indicating that clonal selection is common after therapy for medulloblastoma. The extent of clonal selection (blue > red) varies across medulloblastoma cases, with prominent clonal selection in some cases (MB-REC-30), and more extreme divergence in others (MB-REC-23). c, d, Deep amplicon sequencing of clonal SNVs from both a first recurrence (dark blue), and a subsequent second recurrence (light blue) of patient MB-REC-31 reveals that clonal SNVs present at recurrence but absent from a 30× WGS profile of the untreated tumour (red) were indeed present at very low prevalence (~1/1,000) in the primary sample, indicating striking clonal expansion after initial treatment of the untreated tumour (c; AF, allele frequency; NA, not available). This is illustrated in panel d, which depicts the allelic frequency of a very low-prevalence PIK3CA mutation in the primary tumour that reaches clonal levels post-therapy.
Extended Data Figure 8
Extended Data Figure 8. Base quality assessment of reference and alternate alleles at SNVs with clonal or rare allelic frequencies
a, b, To determine whether low-frequency (<5%) base calls were SNVs or sequencing errors, we analysed the distribution of base quality (baseQ) values for each alternate base called. This plot shows the allele frequencies (AF; secondary y axis) and the proportion of supporting reads with baseQ values >30 (primary y axis) for a subset of SNVs in the recurrent tumour of MB-REC-03 (x axis). At all positions, and in both the recurrent (a), and primary (b), tumours, we observe a high proportion (~100%) of reads with baseQ >30 at both the mutant (black square) and wild-type allele (white squares). Grey squares indicate alleles categorized as sequencing errors. Errors have low allelic frequencies (in many cases are just one read) and a much smaller proportion of reads with baseQ values >30. In the primary tumour, the baseQ and AF values match the pattern observed in the recurrent tumour, indicating that these calls represent true SNVs present at very low frequencies. Sequencing errors in the primary sample have the same base distribution as sequencing errors in the recurrent tumour sample.
Extended Data Figure 9
Extended Data Figure 9. Pathway enrichment results for genes recurrently aberrant in the primary tumour or recurrent tumour cohorts
Pathway enrichment analysis of gene lists derived from the integrative analysis of CNVs (gain or loss of 2 or more copies), SNVs, indels, and structural variants specific to the primary or recurrent tumours of each patient was performed using g:Cocoa.
Extended Data Figure 10
Extended Data Figure 10. Genetic events in recurrent human medulloblastoma converge on specific signalling pathways
a, Copy number profile of MB-REC-12 therapy-naive (WT, green, left panel) and recurrent tumour (loss, blue, lower panel), showing recurrence-specific loss of chr14q. b, DYNC1H1 expression is reduced in Shh patients with chr14q loss (n = 18/80, Mann–Whitney test, P < 0.0001, centre lines show the medians; box limits indicate the 25th and 75th percentiles; whiskers extend 1.5 times the interquartile range from the 25th and 75th percentiles). c, Expression of the chr14 signature genes discriminating between chr14q balanced (n = 34) and chr14q loss (n = 18) in the Boston cohort of Shh medulloblastoma samples.
Figure 1
Figure 1. A novel functional genomic mouse model of recurrent Shh medulloblastoma using microneurosurgical resection and computed-tomography-guided multi-fractionated craniospinal radiotherapy
a, Ptch+/−/Math1-SB11/T2Onc mice with medulloblastoma underwent subtotal tumour removal (n = 38) and received multi-fractionated CSI post-operatively. Radiation was delivered under computed tomography (CT) guidance. b, Microneurosurgery and CSI strikingly improves tumour-free survival as compared to untreated controls (P = 0.0001, log-rank test, n = 64). Inset schematic indicates the fractionation schedule. c, Venn diagrams demonstrate the paucity of overlap in the gCISs between primary tumours and their recurrences. d, Drosophila brain tumours harbouring wild-type P53 displayed massive apoptosis in response to 40 Gy irradiation. e, Dominant negative P53 (p53R159N) essentially abrogated the radiation-dependent cell death. Scale bar, 50 µm.
Figure 2
Figure 2. Paucity of shared genetic events between therapy-naive and recurrent tumours in individual mice treated with microneurosurgery and CT-guided multifractionated craniospinal radiation
a, Venn diagrams demonstrate the paucity of clonal insertions shared between therapy-naive primary tumours and their matched local and metastatic recurrences. Matched recurrences share only very few clonal transposon insertions with the paired primary tumour. b, End-point PCR demonstrates examples of highly clonal insertions that are restricted to the untreated primary (Ncoa1) and the recurrence (Crebbp), (asterisk indicates non-specific amplification). Three levels of input DNA were used for each sample 1×, 5× and 25×; NC, negative control.
Figure 3
Figure 3. Major genetic divergence of human untreated medulloblastoma and patient-matched recurrences determined by whole-genome sequencing
a, Somatic mutation burden in 45 tumours (43 patients) was increased fivefold in matched post-treatment (blue) versus therapy-naive (red) tumours (Student’s t-test; P value = 2.7 × 10⁻⁴). On average, 11.8% of mutations are shared somatic events (n = 15 cases with germline). Hypermutated samples stand out by two orders of magnitude (MB-REC-26/44). Patient subgroup is indicated by the label (blue, Wnt; red, Shh; yellow, Group 3; green, Group 4; black, undetermined). b, Venn diagrams of three representative patients reveal a minimal overlap in genetic events between therapy-naive (red) and recurrent (blue) tumours. c, Circos plot in a representative patient illustrates compartment-specific somatic structural variations.
Figure 4
Figure 4. Genetic divergence of recurrent medulloblastoma is driven by clonal selection
a, Copy-neutral LOH PTCH1−/− driver status reverts to wild type post-therapy in medulloblastoma-REC-12, with homozygous CDKN2A/B loss. b, The evolutionary progression of medulloblastoma-REC-12 is illustrated by (pink) PTCH1+/− lineage expansion, copy-neutral LOH, clonal eradication during treatment, and (blue) subsequent expansion of an ancestral clone with CDKN2A/B−/−. c, Phylogenetic relationships between primary (red) and recurrent (blue) tumours show that recurrences often represent a single rather than multiple primary tumour lineages (for example, medulloblastoma-REC-05/12 compared with medulloblastoma-REC-02). d, Ultra-deep sequencing shows post-treatment expansion of low-frequency or de novo primary clones (blue), and eradication/reduction of therapy-sensitive lineages (red). Inset box indicates number of mutations per cluster.
Figure 5
Figure 5. Signalling pathways in recurrent medulloblastoma
a, Compartment-specific deleterious events in the TP53 gene (n = 6/23), genes from the TP53 pathway (n = 12/23), DYNC1H1 (n = 3/23), and chr14q loss (3/18). Asterisk indicates mutations in patients with missing diagnostic samples; ‘d’ indicates different events in pre- and post-therapy samples; white, patients with diagnostic, post-therapy, and germline samples; grey, no germline; pink, no matched diagnostic sample; blue, Wnt; red, Shh; yellow, Group 3; green, Group 4. b, Overall survival decreases in Shh patients with a chr14q-loss gene expression signature (versus balanced, log-rank test, n = 578, P = 0.0109); not significant in non-Shh tumours. c, Prognostic differences are replicated in an independent cohort (log-rank test, n = 35, P = 0.000995).

Comment in

  • Genetics: Divergence shapes recurrence.
    Romero D. Romero D. Nat Rev Clin Oncol. 2016 Mar;13(3):136. doi: 10.1038/nrclinonc.2016.14. Epub 2016 Feb 2. Nat Rev Clin Oncol. 2016. PMID: 26831182 No abstract available.

References

    1. Hovestadt V, et al. Decoding the regulatory landscape of medulloblastoma using DNA methylation sequencing. Nature. 2014;510:537–541. - PubMed
    1. Jones DT, et al. Dissecting the genomic complexity underlying medulloblastoma. Nature. 2012;488:100–105. - PMC - PubMed
    1. Kool M, et al. Genome sequencing of SHH medulloblastoma predicts genotype-related response to smoothened inhibition. Cancer Cell. 2014;25:393–405. - PMC - PubMed
    1. Northcott PA, et al. Enhancer hijacking activates GFI1 family oncogenes in medulloblastoma. Nature. 2014;511:428–434. - PMC - PubMed
    1. Northcott PA, et al. Subgroup-specific structural variation across 1,000 medulloblastoma genomes. Nature. 2012;488:49–56. - PMC - PubMed

Publication types

MeSH terms