. 2016 Mar:85:1-29.
doi: 10.1016/j.cogpsych.2015.11.002. Epub 2016 Jan 4.

A new framework for modeling decisions about changing information: The Piecewise Linear Ballistic Accumulator model

Affiliations

A new framework for modeling decisions about changing information: The Piecewise Linear Ballistic Accumulator model

William R Holmes et al. Cogn Psychol. 2016 Mar.

Abstract

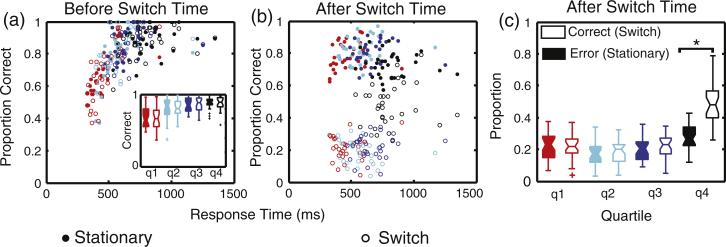
In the real world, decision making processes must be able to integrate non-stationary information that changes systematically while the decision is in progress. Although theories of decision making have traditionally been applied to paradigms with stationary information, non-stationary stimuli are now of increasing theoretical interest. We use a random-dot motion paradigm along with cognitive modeling to investigate how the decision process is updated when a stimulus changes. Participants viewed a cloud of moving dots, where the motion switched directions midway through some trials, and were asked to determine the direction of motion. Behavioral results revealed a strong delay effect: after presentation of the initial motion direction there is a substantial time delay before the changed motion information is integrated into the decision process. To further investigate the underlying changes in the decision process, we developed a Piecewise Linear Ballistic Accumulator model (PLBA). The PLBA is efficient to simulate, enabling it to be fit to participant choice and response-time distribution data in a hierarchal modeling framework using a non-parametric approximate Bayesian algorithm. Consistent with behavioral results, PLBA fits confirmed the presence of a long delay between presentation and integration of new stimulus information, but did not support increased response caution in reaction to the change. We also found the decision process was not veridical, as symmetric stimulus change had an asymmetric effect on the rate of evidence accumulation. Thus, the perceptual decision process was slow to react to, and underestimated, new contrary motion information.

Keywords: Evidence accumulation models; Hierarchal Bayesian inference; Non-stationary stimuli; Random-dot motion.


Figures

Fig. B.1
Fig. B.1
Visual assessment of samples: Values of 9 randomly selected chains for the stated parameter in Model 1f. These results indicate good chain mixing at both the individual and hyper parameter levels. The participant presented was chosen at random.
Fig. 1
Fig. 1
Piecewise Linear Ballistic Accumulator (PLBA) Model Schematic: Evidence for two choice alternatives (i.e., pre-switch correct choice, C1, and the pre-switch correct choice, C2, left and right, respectively) accumulate in time starting at randomly and independently sampled initial evidence levels. At the time denoted “Stimulus Change” the experimental stimulus changes, leading to a change in accumulation drift rates after a delay (“Rate Delay”), and a change in threshold after a separate delay (“Threshold Delay”). In the trial depicted, the post-switch correct choice (C2 or right) is made (i.e., a correct response corresponding to the changed motion direction).
Fig. 2
Fig. 2
Behavioral Results: (a) For each participant, the proportion of correct responses for stationary (filled circles and boxes) and switch (unfilled circles and boxes) trials before the switch time. Trials were divided based on RT quartiles – q1 (red), q2 (light blue), q3 (dark blue), and q4 (black) and average accuracy within each quantile plotted as a function of average RT within each quantile. The insert shows the median, upper, and lower quartiles of accuracy scores over participants for each RT quartile. (b) For each participant, the proportion of correct responses after the switch time for stationary and switch trials by RT quartiles. Note that “correct” was defined relative to the second direction of motion for switch trials. (c) The median, upper, and lower quartiles of the proportion of correct responses over participants for switch trials and error responses for stationary trials. * p < .05 (Tukey test). (For interpretation of the references to color in this figure legend, the reader is referred to the web version of this article.)
Fig. 3
Fig. 3
Hyper mean posterior: Posterior distributions for the hyper mean parameters for Model 1f (Panel a) and Model 2f (Panel b). For each panel, the posterior for the relevant hyper mean is presented (e.g., threshold parameters in the first row). The drift rate distributions before and after the switch are shown in the middle panels. Horizontal bars indicate the differential drift rate between the accumulators for the pre-switch correct (C1) and post-switch correct (C2) choices, and the mean value of this differential is quoted in the respective title line.
Fig. 4
Fig. 4
Quality of Fit for Model Variant 1f Fit:. Panel (a) For each participant, the choice probabilities are compute for each of the 15 blocks (4–18) in the direction determination task. Also, the mean of the individual level parameters for each participant are drawn from the posterior, and the predicted choice probabilities are separately computed for each of the 15 blocks, with the switch times taken from the experimental data for that individual participant. The computed and actual choice probabilities are plotted against each other with black (respectively gray) representing the probability of choosing the pre-switch correct choice (C1) (respectively post-switch correct choice, C2). Panels (b–d) Comparison of experimental and computed response time distributions for three separate participants. For each participant, data over all 15 blocks is aggregated. Black and gray respectively show the response time distributions for choices C1 and C2 respectively. See “Quality of model fit” for further details on the aggregation. Panel (e) Comparison of participant quartile accuracy with model predictions on stationary trials. Here, quartiles are computed from the full RT distribution for each participant for only stationary trials. Panel (f) Comparison of participant quartile accuracy and model predictions on non-stationary trials. Here, quartiles are derived from non-stationary trials where responses occur after the change of information.
Fig. 5
Fig. 5
Individual participant parameter correlations: Correlations between lower level parameters for Model 1f, for an individual participant. The lower triangle depicts correlations between the chain values for the given parameters, the diagonals show the posterior in histogram form, and the upper triangle provides the numeric correlations.
Fig. 6
Fig. 6
Population distribution estimates: The histograms are based on 100,000 samples, where for each sample a random participant then a random parameter vector from that participant's posterior was chosen and the rate delay (left panel) and rate asymmetry (right panel) measures obtained.

References

    1. Anstis S, Verstraten FA, Mather G. The motion aftereffect. Trends in Cognitive Sciences. 1998;2(3):111–117. - PubMed
    1. Apgar JF, Witmer DK, White FM, Tidor B. Sloppy models, parameter uncertainty, and the role of experimental design. Molecular BioSystems. 2010;6(10):1890–1900. - PMC - PubMed
    1. Atkinson KA. An introduction to numerical analysis. 2nd ed. John Wiley & Sons; 1989.
    1. Ball K, Sekuler R. A specific and enduring improvement in visual motion discrimination. Science. 1982;218(4573):697–698. - PubMed
    1. Botvinick MM, Braver TS, Barch DM, Carter CS, Cohen JD. Conflict monitoring and cognitive control. Psychological Review. 2001;108:624–652. - PubMed