. 2016;12(3):484-98.
doi: 10.1080/15548627.2015.1134081.

Drosophila Mitf regulates the V-ATPase and the lysosomal-autophagic pathway

Affiliations

Drosophila Mitf regulates the V-ATPase and the lysosomal-autophagic pathway

Valentina Bouché et al. Autophagy. 2016.

Abstract

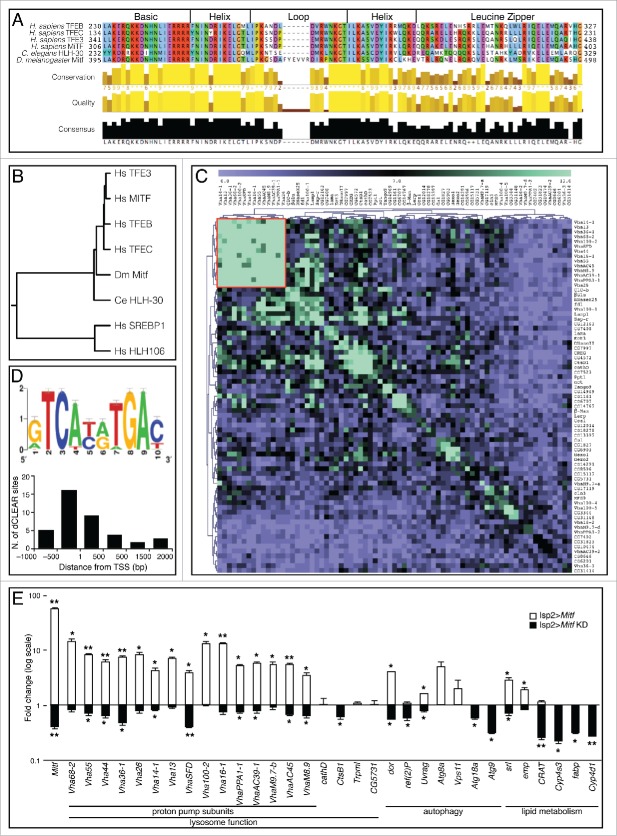
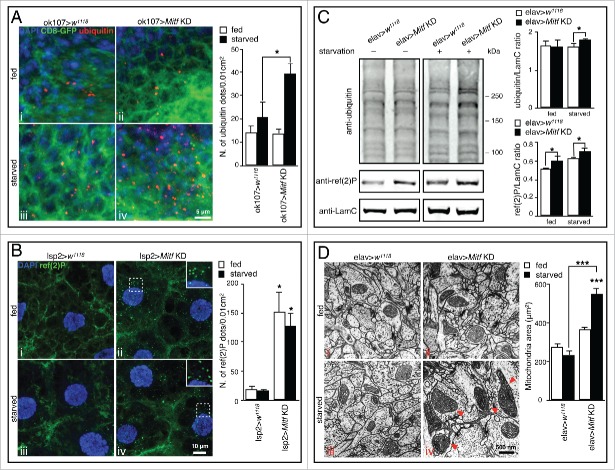
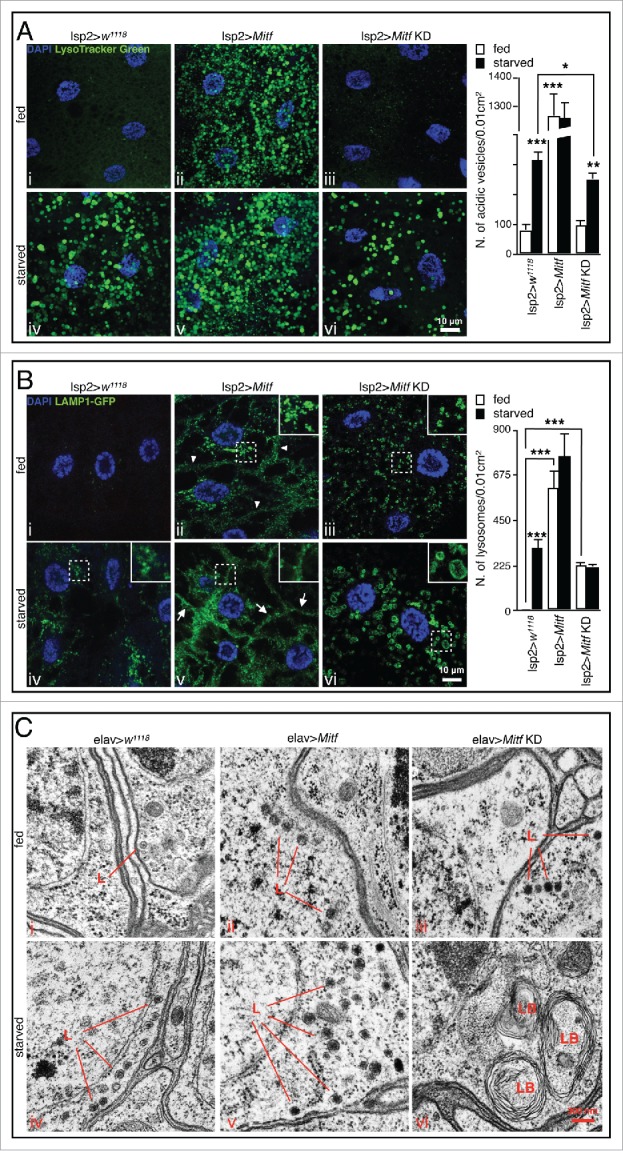
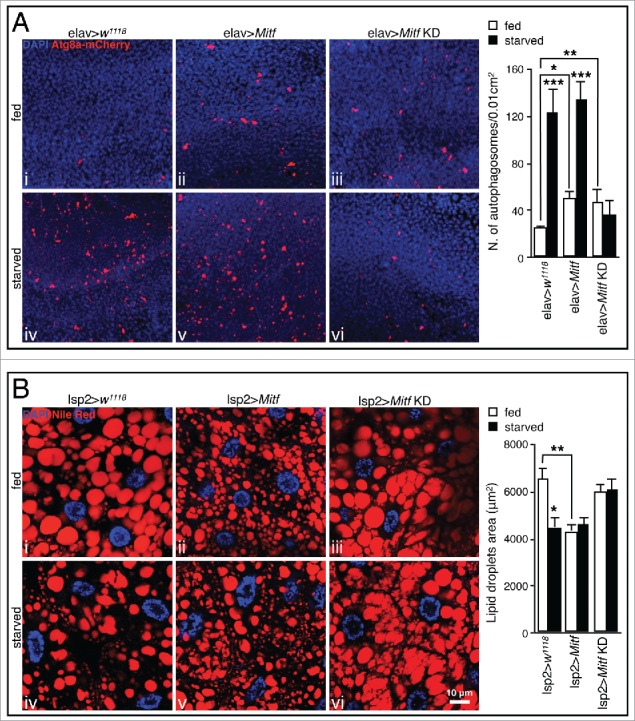
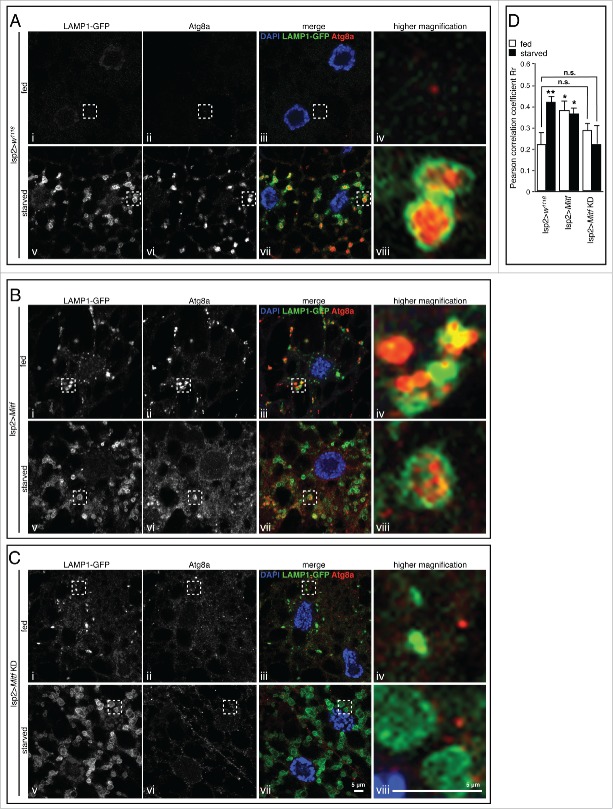
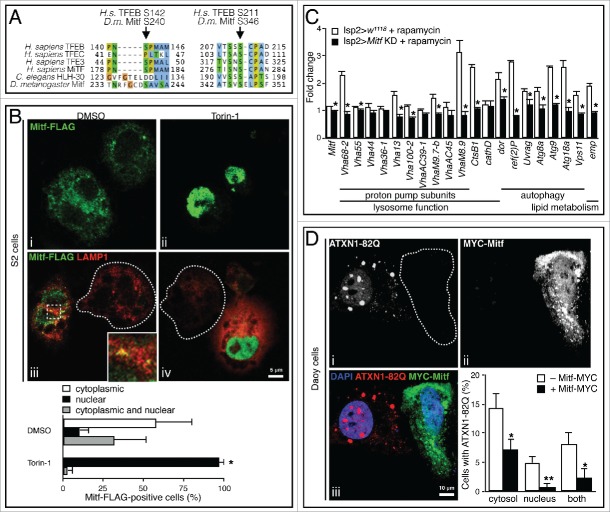
An evolutionarily conserved gene network regulates the expression of genes involved in lysosome biogenesis, autophagy, and lipid metabolism. In mammals, TFEB and other members of the MiTF-TFE family of transcription factors control this network. Here we report that the lysosomal-autophagy pathway is controlled by Mitf gene in Drosophila melanogaster. Mitf is the single MiTF-TFE family member in Drosophila and prior to this work was known only for its function in eye development. We show that Mitf regulates the expression of genes encoding V-ATPase subunits as well as many additional genes involved in the lysosomal-autophagy pathway. Reduction of Mitf function leads to abnormal lysosomes and impairs autophagosome fusion and lipid breakdown during the response to starvation. In contrast, elevated Mitf levels increase the number of lysosomes, autophagosomes and autolysosomes, and decrease the size of lipid droplets. Inhibition of Drosophila MTORC1 induces Mitf translocation to the nucleus, underscoring conserved regulatory mechanisms between Drosophila and mammalian systems. Furthermore, we show Mitf-mediated clearance of cytosolic and nuclear expanded ATXN1 (ataxin 1) in a cellular model of spinocerebellar ataxia type 1 (SCA1). This remarkable observation illustrates the potential of the lysosomal-autophagy system to prevent toxic protein aggregation in both the cytoplasmic and nuclear compartments. We anticipate that the genetics of the Drosophila model and the absence of redundant MIT transcription factors will be exploited to investigate the regulation and function of the lysosomal-autophagy gene network.

Keywords: MTORC1; Mitf; TFEB; V-ATPase; autophagy; lipid metabolism; lysosome; proton pump.


Figures

Figure 1.
Figure 1.
Drosophila Mitf shows sequence similarity to other MiTF-TFE family members and regulates the expression of V-ATPase and other target genes. (A) Amino acid sequence alignment of bHLH-Zip functional domains of human TFEB, TFEC, TFE3, MITF, C. elegans HLH-30, and D. melanogaster Mitf. Amino acids are color-coded based on side chain properties. (B) Phylogenetic tree depicting the distance between human members of MiTF-TFE family, C. elegans HLH-30 and D. melanogaster Mitf; 2 other human bHLH transcription factors are also shown as controls. (C) Heat map of the scores associated with the coexpression analysis of Drosophila lysosomal genes. A cluster of genes encoding V-ATPase subunits with strongly associated expressions is indicated (red box). (D) Logo representation of the dCLEAR element. The height of nucleotide symbols at each position is proportional to the conservation of nucleotides at that position. Graph shows the distribution of dCLEAR sites at the promoters of analyzed genes. (E) qRT-PCR analysis of gene expression of TFEB-network homologs in fat body samples isolated from larvae in which Mitf was overexpressed or silenced (Mitf KD) using the fat body driver (lsp2-GAL4). White bars show the fold change of the mRNA levels of target genes in Mitf-overexpressing versus control larvae. Black bars show the fold change of mRNA levels in Mitf-silenced larvae vs. control larvae. Gene expression was normalized relative to Act5C gene. Data are mean of replicates (n=3) ± SEM. *, P < 0.05; **, P < 0.005 by the Student t test.
Figure 2.
Figure 2.
Cellular phenotypes induced by Mitf knockdown. (A) Orthogonal projection of z-stacks confocal microscopy images of adult brain from fed and starved control flies or from flies in which Mitf was silenced using the mushroom body specific driver (ok107-GAL4). Tissues were stained with a polyubiquitin antibody (red) and mounted in DAPI (blue); CD8-GFP (green) labels cell membranes. Graph shows means of number of polyubiquitinated dots per 0.01 cm2 area. (B) Orthogonal projection of z-stacks confocal microscopy images of fat body from fed and starved control larvae or from larvae in which Mitf was silenced using the fat body specific driver (lsp2-GAL4). Tissues were stained with a ref(2)P antibody (green) and mounted in DAPI (blue). The regions within the dotted box are magnified in the insets (7x). Graph shows means of number of ref(2)P dots per 0.01 cm2 area. (C) Immunoblot against polyubiquitin and ref(2)P in fed and starved head extracts taken from control flies and from flies in which Mitf was silenced using the pan-neuronal driver (elav-GAL4). LamC was used as a loading control. Graph shows ubiquitin/LamC and ref(2)P/LamC quantification ratios. Experiments were performed in triplicate and band intensities were quantified using ImageJ software. (D) TEM images of fed and starved adult brains from control flies, and from flies in which Mitf was silenced using the pan-neuronal driver (elav-GAL4). Arrowheads show giant mitochondria detected in starved Mitf-knockdown animals. Graph shows the mean area of mitochondria. Measurement of mitochondrial area was performed using ImageJ software and at least 100 mitochondria/group were analyzed. Experiments were performed in triplicate and error bars represent SEM. *, P < 0.05; ***, P < 0.0005 by the Student t test.
Figure 3.
Figure 3.
Mitf regulates starvation-induced lysosomal biogenesis. (A) Orthogonal projection of z-stacks confocal microscopy images of LysoTracker Green staining (green) and DAPI (blue) on fed and starved fat body isolated from control larvae and larvae in which Mitf is either overexpressed or downregulated using the fat body driver (lsp2-GAL4). Graph shows means of number of vesicles per 0.01 cm2 area. (B) Confocal microscopy images of LAMP1-GFP (green) and DAPI (blue) in fed and starved fat body isolated from control larvae and larvae in which Mitf is either overexpressed or downregulated using the fat body driver (lsp2-GAL4). The regions within the dotted box are magnified in the insets (7x). Graph shows means of number of lysosomes per 0.01 cm2 area. (C) TEM images of adult brains from fed and starved control flies and flies in which Mitf is either overexpressed or downregulated using the pan-neuronal driver (elav-GAL4). Lysosomes (L) and lamellar bodies (LB) are indicated. Animals were raised at 23°C. Experiments were performed in triplicate and error bars represent SEM. *, P < 0.05; **, P < 0.005; ***, P < 0.0005 by the Student t test.
Figure 4.
Figure 4.
Mitf regulates autophagy activation and lipid breakdown. (A) Orthogonal projection of z-stacks confocal microscopy images of UAS-Atg8a-mcherry (red) and DAPI (blue) in fed and starved adult brain isolated from control flies and flies in which Mitf is either overexpressed or downregulated using the pan-neuronal driver (elav-GAL4). Graph shows means of number of autophagosomes per 0.01 cm2 area. (B) Confocal microscopy images of Nile red staining (red) and DAPI (blue) on fat body tissue isolated from fed and starved control larvae and larvae in which Mitf is either overexpressed or downregulated using the fat body driver (lsp2-GAL4). Graph shows means of lipid droplet areas. Experiments were performed in triplicate and error bars represent SEM. *, P < 0.05; **, P < 0.005; ***, P < 0.0005 by the Student t test.
Figure 5.
Figure 5.
Mitf is required for starvation-induced fusion of lysosomes and autophagosomes. Confocal microscopy images of LAMP1-GFP (green), Atg8a (red) in fed and starved fat body isolated from control larvae (A) and larvae in which Mitf is either overexpressed (B) or downregulated (C) using the fat body driver (lsp2-GAL4). Tissues were stained with an Atg8a antibody (red) and mounted in DAPI (blue). The regions within the dotted boxes are magnified in the right column (5x). Autolysosomes are identified as enlarged Atg8a-positive vesicles decorated by a LAMP1-GFP-positive ring. (D) Graph shows quantification of LAMP1-GFP and Atg8 colocalization using ImageJ software to determine Pearson correlation coefficient Rr; at least 10 images/group were analyzed. Animals were raised at 25°C. Experiments were performed in triplicate and error bars represent SEM. *, P < 0.05; **, P < 0.005 by Student t test. Nonsignificant data are indicated (n.s.).
Figure 6.
Figure 6.
Mitf regulation by MTORC1 and clearance of expanded ATXN1. (A) Amino acid sequence alignment of region containing MTORC1 target serines of human TFEB, TFEC, TFE3 and MITF, C. elegans HLH-30, and D. melanogaster Mitf. Amino acids are color-coded based on side chain properties. Arrows indicate target serine residues. (B) Confocal microscopy images of S2 Drosophila cells treated for 1 h with Torin-1 (250 nM) or DMSO and stained with anti-FLAG (green) to label Mitf-FLAG, anti-LAMP1 (red) to label lysosomes. The region within the dotted box is magnified in the inset. Dashed lines indicate nontransfected cells. The region within the dotted box is magnified in the inset (9x). Graph shows percentage of Mitf-FLAG-positive cells displaying Mitf localization in the cytoplasm, in the nucleus or in both compartments. Error bars represent SEM of 3 different experiments, at least 50 cells/group were counted. (C) qRT-PCR analysis of target gene expression in fat body samples isolated from control larvae and from larvae in which Mitf was silenced using the fat body driver (lsp2-GAL4). Animals were treated with rapamycin (1 μM) or with DMSO only. The graph shows the relative increased expression in the treated versus the corresponding untreated samples. White bars show the fold change of the mRNA levels of target genes in treated vs. untreated control larvae. Black bars show the fold change of mRNA levels in treated vs. untreated Mitf-silenced larvae. Gene expression was normalized relative to Act5C gene. Data are mean of replicates (n=3) ± SEM. (D) Confocal microscopy images of mammalian Daoy cells stably expressing mRFP-ATXN1-82Q and transfected with MYC-Mitf construct. ˜65% of total cells showed aggregates. Dashed lines indicate transfected cells. Graph shows percentage of cells with aggregates in the cytosol, or in the nucleus, or in both. Error bars represent SEM of 3 different experiments, at least 100 cells/experiment were counted. *, P < 0.05; **, P < 0.005 by Student t test.

Similar articles

Cited by

References

    1. Eskelinen EL, Saftig P. Autophagy: a lysosomal degradation pathway with a central role in health and disease. Biochim Biophys Acta 2009; 1793: 664–73; PMID:18706940; http://dx.doi.org/10.1016/j.bbamcr.2008.07.014 - DOI - PubMed
    1. Hale AN, Ledbetter DJ, Gawriluk TR, Rucker EB 3rd. Autophagy: regulation and role in development. Autophagy 2013; 9:951–72; PMID:24121596; http://dx.doi.org/10.4161/auto.24273 - DOI - PMC - PubMed
    1. Klionsky DJ, Emr SD. Autophagy as a regulated pathway of cellular degradation. Science 2000; 290:1717–21; PMID:11099404; http://dx.doi.org/10.1126/science.290.5497.1717 - DOI - PMC - PubMed
    1. Sardiello M, Palmieri M, di Ronza A, Medina DL, Valenza M, Gennarino VA, Di Malta C, Donaudy F, Embrione V, Polishchuk RS, et al.. A gene network regulating lysosomal biogenesis and function. Science 2009; 325:473–77; PMID:19556463 - PubMed
    1. Settembre C, Di Malta C, Polito VA, Garcia Arencibia M, Vetrini F, Erdin S, Erdin SU, Huynh T, Medina D, Colella P, et al.. TFEB links autophagy to lysosomal biogenesis. Science 2011; 332:1429–33; PMID:21617040; http://dx.doi.org/10.1126/science.1204592 - DOI - PMC - PubMed

Publication types

MeSH terms

Substances