

Enhancement of HIV-1 infection and intestinal CD4+ T cell depletion ex vivo by gut microbes altered during chronic HIV-1 infection
- PMID: 26762145
- PMCID: PMC4712466
- DOI: 10.1186/s12977-016-0237-1
Enhancement of HIV-1 infection and intestinal CD4+ T cell depletion ex vivo by gut microbes altered during chronic HIV-1 infection
Abstract
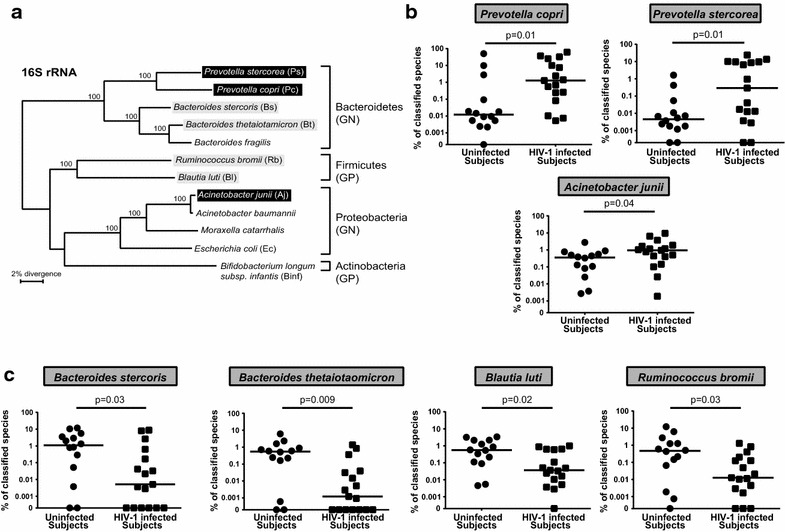
Background: Early HIV-1 infection is characterized by high levels of HIV-1 replication and substantial CD4 T cell depletion in the intestinal mucosa, intestinal epithelial barrier breakdown, and microbial translocation. HIV-1-induced disruption of intestinal homeostasis has also been associated with changes in the intestinal microbiome that are linked to mucosal and systemic immune activation. In this study, we investigated the impact of representative bacterial species that were altered in the colonic mucosa of viremic HIV-1 infected individuals (HIV-altered mucosal bacteria; HAMB) on intestinal CD4 T cell function, infection by HIV-1, and survival in vitro. Lamina propria (LP) mononuclear cells were infected with CCR5-tropic HIV-1BaL or mock infected, exposed to high (3 gram-negative) or low (2 gram-positive) abundance HAMB or control gram-negative Escherichia coli and levels of productive HIV-1 infection and CD4 T cell depletion assessed. HAMB-associated changes in LP CD4 T cell activation, proliferation and HIV-1 co-receptor expression were also evaluated.
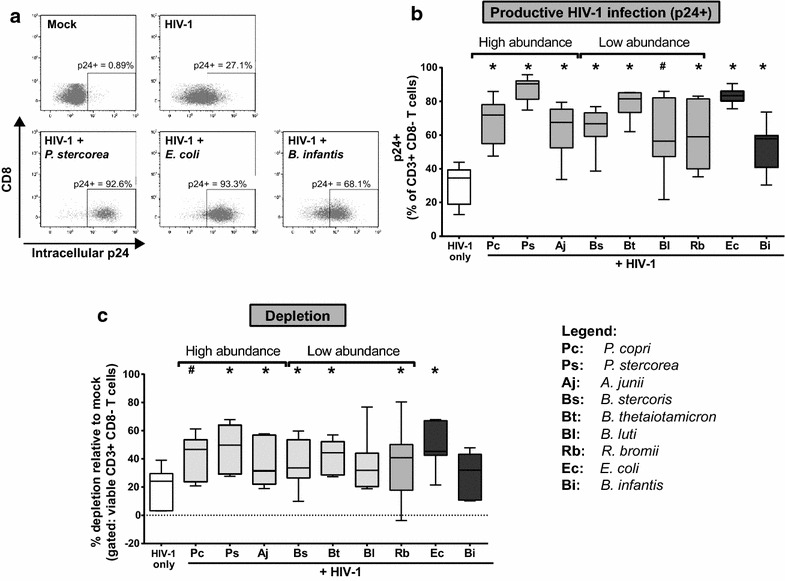
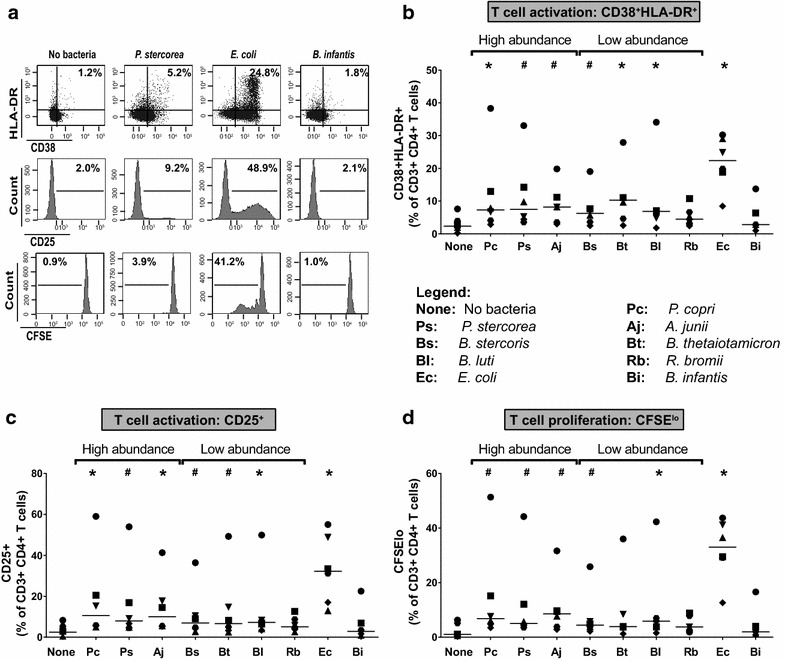
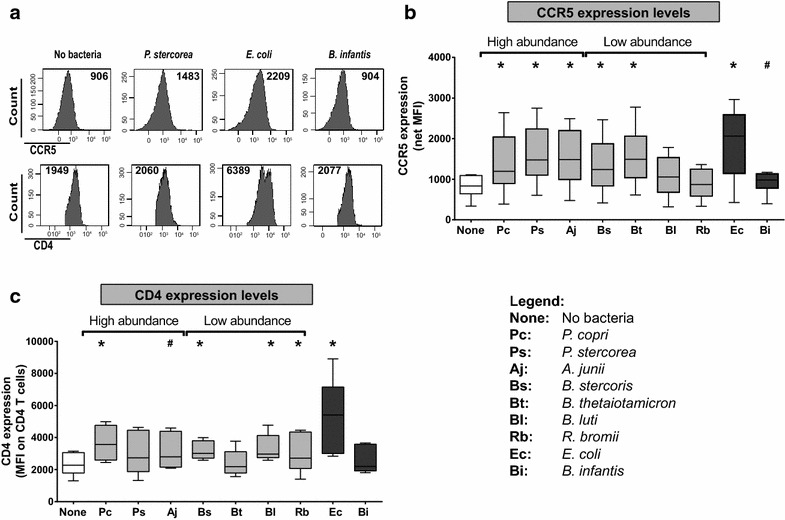
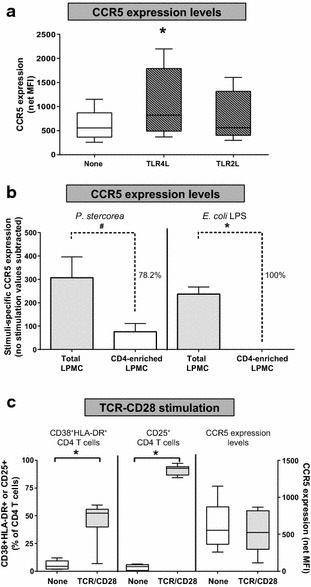
Results: The majority of HAMB increased HIV-1 infection and depletion of LP CD4 T cells, but gram-negative HAMB enhanced CD4 T cell infection to a greater degree than gram-positive HAMB. Most gram-negative HAMB enhanced T cell infection to levels similar to that induced by gram-negative E. coli despite lower induction of T cell activation and proliferation by HAMB. Both gram-negative HAMB and E. coli significantly increased expression of HIV-1 co-receptor CCR5 on LP CD4 T cells. Lipopolysaccharide, a gram-negative bacteria cell wall component, up-regulated CCR5 expression on LP CD4 T cells whereas gram-positive cell wall lipoteichoic acid did not. Upregulation of CCR5 by gram-negative HAMB was largely abrogated in CD4 T cell-enriched cultures suggesting an indirect mode of stimulation.
Conclusions: Gram-negative commensal bacteria that are altered in abundance in the colonic mucosa of HIV-1 infected individuals have the capacity to enhance CCR5-tropic HIV-1 productive infection and depletion of LP CD4 T cells in vitro. Enhanced infection appears to be primarily mediated indirectly through increased expression of CCR5 on LP CD4 T cells without concomitant large scale T cell activation. This represents a novel mechanism potentially linking intestinal dysbiosis to HIV-1 mucosal pathogenesis.
Figures
Similar articles
-
HIV-1 infection of human intestinal lamina propria CD4+ T cells in vitro is enhanced by exposure to commensal Escherichia coli.J Immunol. 2012 Jul 15;189(2):885-96. doi: 10.4049/jimmunol.1200681. Epub 2012 Jun 11. J Immunol. 2012. PMID: 22689879 Free PMC article.
-
Low abundance of colonic butyrate-producing bacteria in HIV infection is associated with microbial translocation and immune activation.AIDS. 2017 Feb 20;31(4):511-521. doi: 10.1097/QAD.0000000000001366. AIDS. 2017. PMID: 28002063 Free PMC article.
-
Microbial exposure alters HIV-1-induced mucosal CD4+ T cell death pathways Ex vivo.Retrovirology. 2014 Feb 4;11:14. doi: 10.1186/1742-4690-11-14. Retrovirology. 2014. PMID: 24495380 Free PMC article.
-
Gut Microbiome Homeostasis and the CD4 T- Follicular Helper Cell IgA Axis in Human Immunodeficiency Virus Infection.Front Immunol. 2021 Mar 19;12:657679. doi: 10.3389/fimmu.2021.657679. eCollection 2021. Front Immunol. 2021. PMID: 33815419 Free PMC article. Review.
-
The Bacterium Akkermansia muciniphila: A Sentinel for Gut Permeability and Its Relevance to HIV-Related Inflammation.Front Immunol. 2020 Apr 9;11:645. doi: 10.3389/fimmu.2020.00645. eCollection 2020. Front Immunol. 2020. PMID: 32328074 Free PMC article. Review.
Cited by
-
The gut microbiome and frailty.Transl Res. 2020 Jul;221:23-43. doi: 10.1016/j.trsl.2020.03.012. Epub 2020 May 1. Transl Res. 2020. PMID: 32360945 Free PMC article. Review.
-
Commensal and Pathogenic Bacteria Indirectly Induce IL-22 but Not IFNγ Production From Human Colonic ILC3s via Multiple Mechanisms.Front Immunol. 2019 Mar 29;10:649. doi: 10.3389/fimmu.2019.00649. eCollection 2019. Front Immunol. 2019. PMID: 30984202 Free PMC article.
-
Brief Report: Inflammatory Colonic Innate Lymphoid Cells Are Increased During Untreated HIV-1 Infection and Associated With Markers of Gut Dysbiosis and Mucosal Immune Activation.J Acquir Immune Defic Syndr. 2017 Dec 1;76(4):431-437. doi: 10.1097/QAI.0000000000001523. J Acquir Immune Defic Syndr. 2017. PMID: 28825942 Free PMC article.
-
Microbial Translocation and Inflammation Occur in Hyperacute Immunodeficiency Virus Infection and Compromise Host Control of Virus Replication.PLoS Pathog. 2016 Dec 7;12(12):e1006048. doi: 10.1371/journal.ppat.1006048. eCollection 2016 Dec. PLoS Pathog. 2016. PMID: 27926931 Free PMC article.
-
The Potential of Clostridium butyricum to Preserve Gut Health, and to Mitigate Non-AIDS Comorbidities in People Living with HIV.Probiotics Antimicrob Proteins. 2024 Aug;16(4):1465-1482. doi: 10.1007/s12602-024-10227-1. Epub 2024 Feb 9. Probiotics Antimicrob Proteins. 2024. PMID: 38336953 Review.
References
-
- Smit-McBride Z, Mattapallil JJ, McChesney M, Ferrick D, Dandekar S. Gastrointestinal T lymphocytes retain high potential for cytokine responses but have severe CD4(+) T-cell depletion at all stages of simian immunodeficiency virus infection compared to peripheral lymphocytes. J Virol. 1998;72(8):6646–6656. - PMC - PubMed
Publication types
MeSH terms
Grants and funding
LinkOut - more resources
Full Text Sources
Other Literature Sources
Medical
Molecular Biology Databases
Research Materials
