

3D Quantitative tumour burden analysis in patients with hepatocellular carcinoma before TACE: comparing single-lesion vs. multi-lesion imaging biomarkers as predictors of patient survival
- PMID: 26762942
- PMCID: PMC4942412
- DOI: 10.1007/s00330-015-4168-3
3D Quantitative tumour burden analysis in patients with hepatocellular carcinoma before TACE: comparing single-lesion vs. multi-lesion imaging biomarkers as predictors of patient survival
Abstract
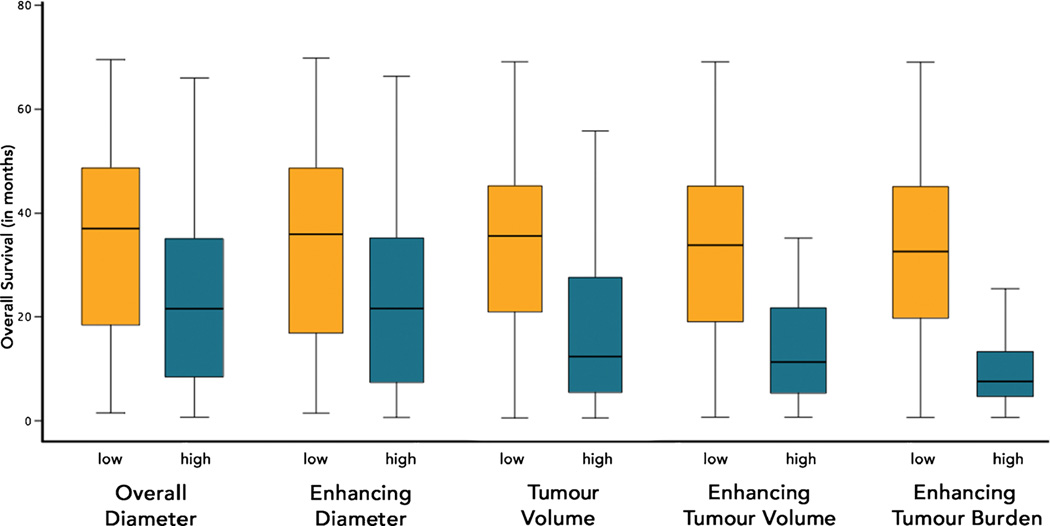
Objectives: To compare the ability of single- vs. multi-lesion assessment on baseline MRI using 1D- and 3D-based measurements to predict overall survival (OS) in patients with hepatocellular carcinoma (HCC) before transarterial chemoembolization (TACE).
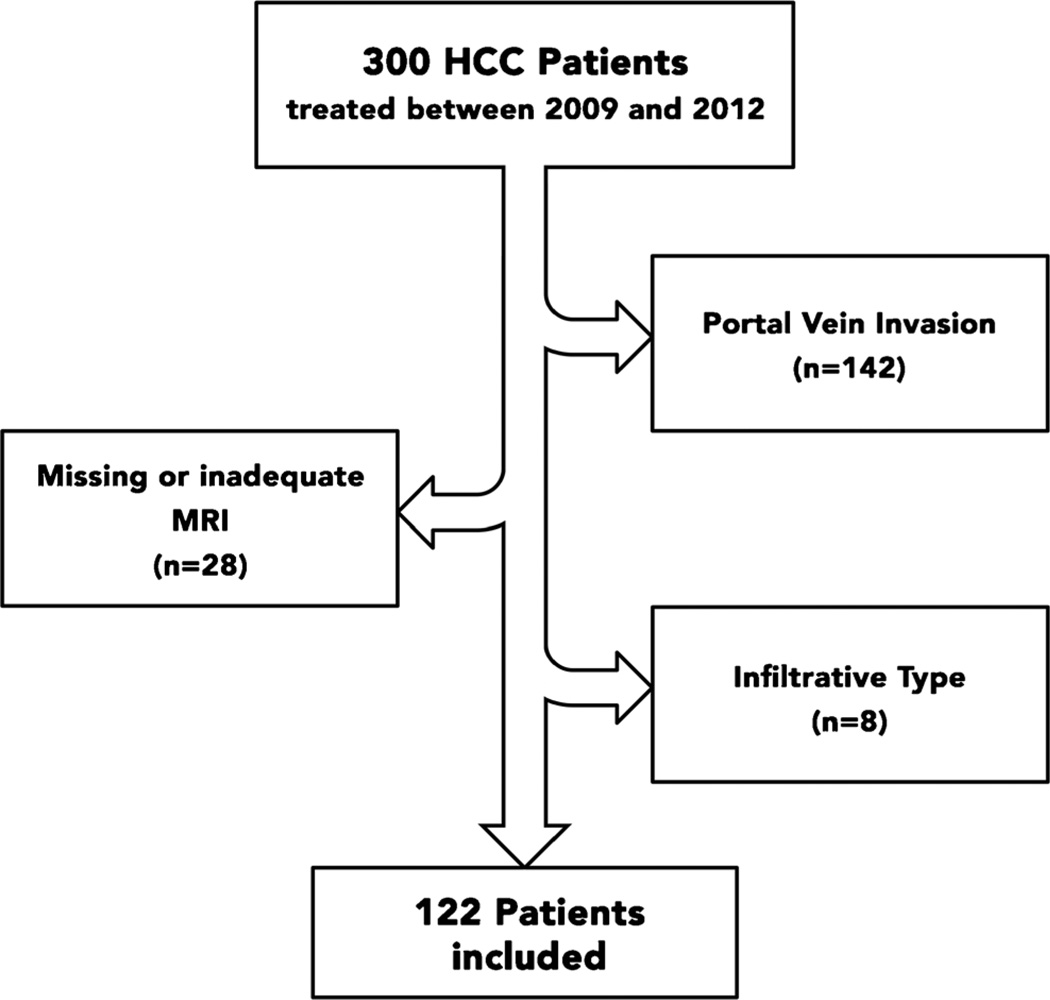
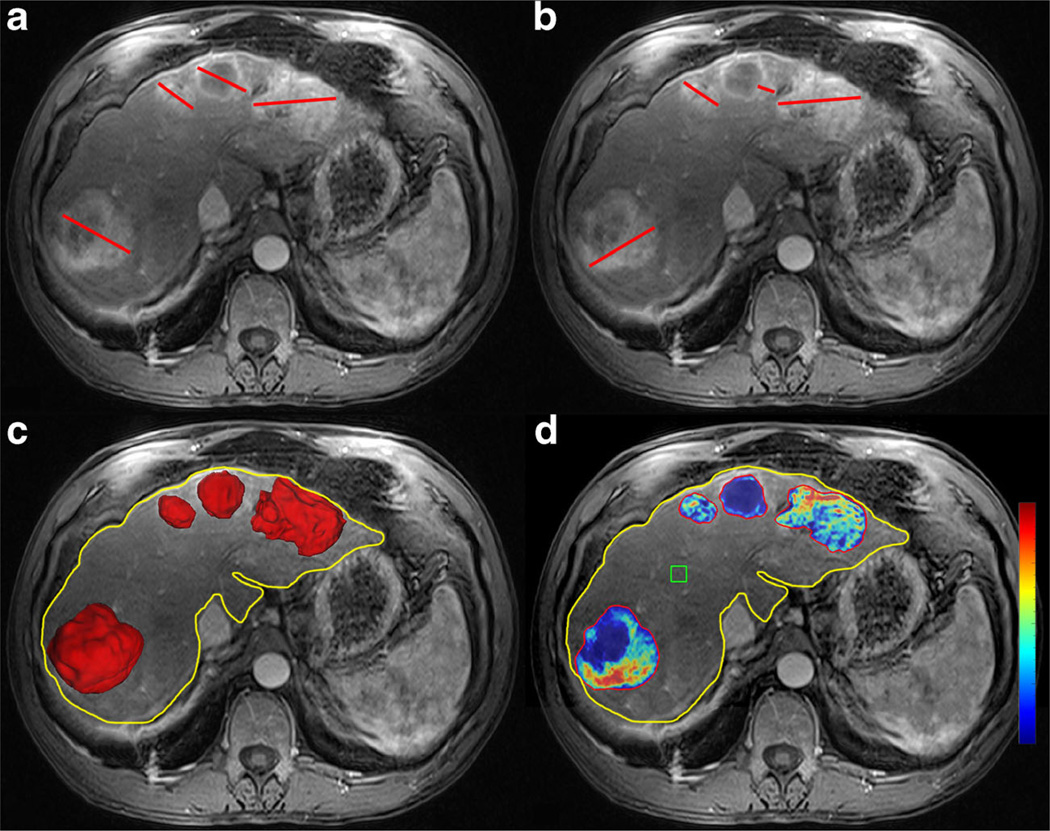
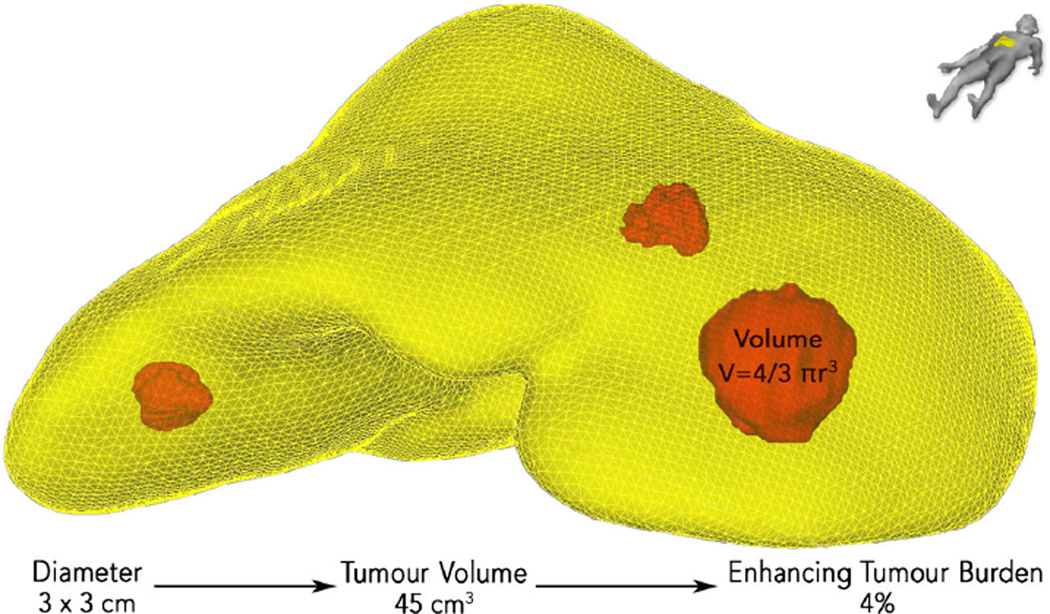
Methods: This retrospective analysis included 122 patients. A quantitative 3D analysis was performed on baseline MRI to calculate enhancing tumour volume (ETV [cm(3)]) and enhancing tumour burden (ETB [%]) (ratio between ETV [cm(3)] and liver volume). Furthermore, enhancing and overall tumour diameters were measured. Patients were stratified into two groups using thresholds derived from the BCLC staging system. Statistical analysis included Kaplan-Meier plots, uni- and multivariate cox proportional hazard ratios (HR) and concordances.
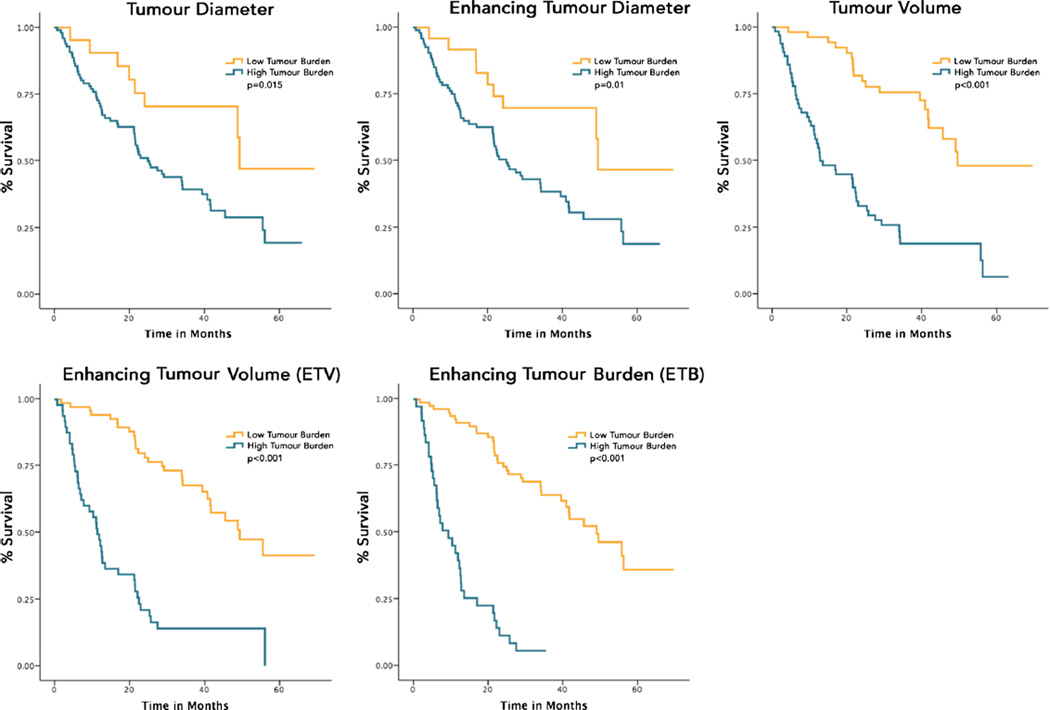
Results: All methods achieved good separation of the survival curves (p < 0.05). Multivariate analysis showed an HR of 5.2 (95 % CI 3.1-8.8, p < 0.001) for ETV [cm(3)] and HR 6.6 (95 % CI 3.7-11.5, p < 0.001) for ETB [%] vs. HR 2.6 (95 % CI 1.2-5.6, p = 0.012) for overall diameter and HR 3.0 (95 % CI 1.5-6.3, p = 0.003) for enhancing diameter. Concordances were highest for ETB [%], with no added predictive power for multi-lesion assessment (difference between concordances not significant).
Conclusion: 3D quantitative assessment is a stronger predictor of survival as compared to diameter-based measurements. Assessing multiple lesions provides no substantial improvement in predicting OS than evaluating the dominant lesion alone.
Key points: • 3D quantitative tumour assessment on baseline MRI predicts survival in HCC patients. • 3D quantitative tumour assessment predicts survival better than any current radiological method. • Multiple lesion assessment provides no improvement than evaluating the dominant lesion alone. • Measuring enhancing tumour volume in proportion to liver volume reflects tumour burden.
Keywords: 3D; HCC; Segmentation; TACE; Tumour burden.
Figures
Similar articles
-
Optimization of the BCLC Staging System for Locoregional Therapy for Hepatocellular Carcinoma by Using Quantitative Tumor Burden Imaging Biomarkers at MRI.Radiology. 2022 Jul;304(1):228-237. doi: 10.1148/radiol.212426. Epub 2022 Apr 12. Radiology. 2022. PMID: 35412368 Free PMC article.
-
Identifying Staging Markers for Hepatocellular Carcinoma before Transarterial Chemoembolization: Comparison of Three-dimensional Quantitative versus Non-three-dimensional Imaging Markers.Radiology. 2015 May;275(2):438-47. doi: 10.1148/radiol.14141180. Epub 2014 Dec 19. Radiology. 2015. PMID: 25531387 Free PMC article.
-
Identifying enhancement-based staging markers on baseline MRI in patients with colorectal cancer liver metastases undergoing intra-arterial tumor therapy.Eur Radiol. 2021 Dec;31(12):8858-8867. doi: 10.1007/s00330-021-08058-7. Epub 2021 Jun 1. Eur Radiol. 2021. PMID: 34061209 Free PMC article.
-
Early survival prediction after intra-arterial therapies: a 3D quantitative MRI assessment of tumour response after TACE or radioembolization of colorectal cancer metastases to the liver.Eur Radiol. 2015 Jul;25(7):1993-2003. doi: 10.1007/s00330-015-3595-5. Epub 2015 Jan 31. Eur Radiol. 2015. PMID: 25636420 Free PMC article.
-
Transarterial chemoembolization versus hepatic resection in hepatocellular carcinoma treatment: a meta-analysis.Drug Des Devel Ther. 2015 Aug 10;9:4431-40. doi: 10.2147/DDDT.S86629. eCollection 2015. Drug Des Devel Ther. 2015. PMID: 26309396 Free PMC article. Review.
Cited by
-
Deep learning-based 3D quantitative total tumor burden predicts early recurrence of BCLC A and B HCC after resection.Eur Radiol. 2025 Jan;35(1):127-139. doi: 10.1007/s00330-024-10941-y. Epub 2024 Jul 19. Eur Radiol. 2025. PMID: 39028376 Free PMC article.
-
Predicting Infiltrative Hepatocellular Carcinoma Patient Outcome Post-TACE: MR Bias Field Correction Effect on 3D-quantitative Image Analysis.J Clin Transl Hepatol. 2020 Sep 28;8(3):292-298. doi: 10.14218/JCTH.2020.00054. Epub 2020 Aug 18. J Clin Transl Hepatol. 2020. PMID: 33083252 Free PMC article.
-
Optimization of the BCLC Staging System for Locoregional Therapy for Hepatocellular Carcinoma by Using Quantitative Tumor Burden Imaging Biomarkers at MRI.Radiology. 2022 Jul;304(1):228-237. doi: 10.1148/radiol.212426. Epub 2022 Apr 12. Radiology. 2022. PMID: 35412368 Free PMC article.
-
Predicting survival of patients with advanced hepatocellular carcinoma receiving combination targeted immunotherapy: an evaluation of volumetric imaging parameters.Abdom Radiol (NY). 2024 Aug;49(8):2595-2605. doi: 10.1007/s00261-024-04257-0. Epub 2024 Mar 28. Abdom Radiol (NY). 2024. PMID: 38546828
-
Comparison of quantitative volumetric analysis and linear measurement for predicting the survival of Barcelona Clinic Liver Cancer 0- and A stage hepatocellular carcinoma after radiofrequency ablation.Diagn Interv Radiol. 2023 May 31;29(3):450-459. doi: 10.4274/dir.2023.222055. Epub 2023 May 8. Diagn Interv Radiol. 2023. PMID: 37154818 Free PMC article.
References
-
- European Association for the Study of the Liver, European Organisation for Research and Treatment of Cancer. EASL-EORTC clinical practice guidelines: management of hepatocellular carcinoma. J Hepatol. 2012;56:908–943. - PubMed
-
- Ferlay J, Soerjomataram I, Dikshit R, et al. Cancer incidence and mortality worldwide: sources, methods and major patterns in GLOBOCAN 2012. Int J Cancer. 2015;136:E359–E386. - PubMed
-
- WHO International Agency for Research on Cancer. Global battle against cancer won’t be won with treatment alone: effective prevention measures urgently needed to prevent cancer crisis. Lyon/London: The International Agency for Research on Cancer; 2014. - PubMed
-
- Bruix J, Llovet JM. Prognostic prediction and treatment strategy in hepatocellular carcinoma. Hepatology. 2002;35:519–524. - PubMed
-
- Yuen MF, Cheng CC, Lauder IJ, Lam SK, Ooi CG, Lai CL. Early detection of hepatocellular carcinoma increases the chance of treatment: Hong Kong experience. Hepatology. 2000;31:330–335. - PubMed
Publication types
MeSH terms
Substances
Grants and funding
LinkOut - more resources
Full Text Sources
Other Literature Sources
Medical
Miscellaneous
