. 2016 Jan;6(1):150223.
doi: 10.1098/rsob.150223.

Overlap of copper and iron uptake systems in mitochondria in Saccharomyces cerevisiae

Affiliations

Overlap of copper and iron uptake systems in mitochondria in Saccharomyces cerevisiae

Katherine E Vest et al. Open Biol. 2016 Jan.

Abstract

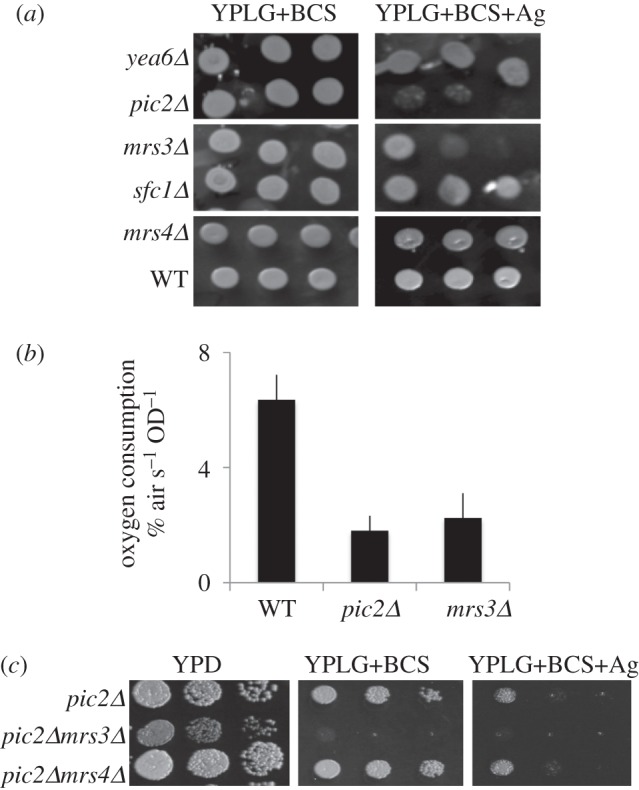
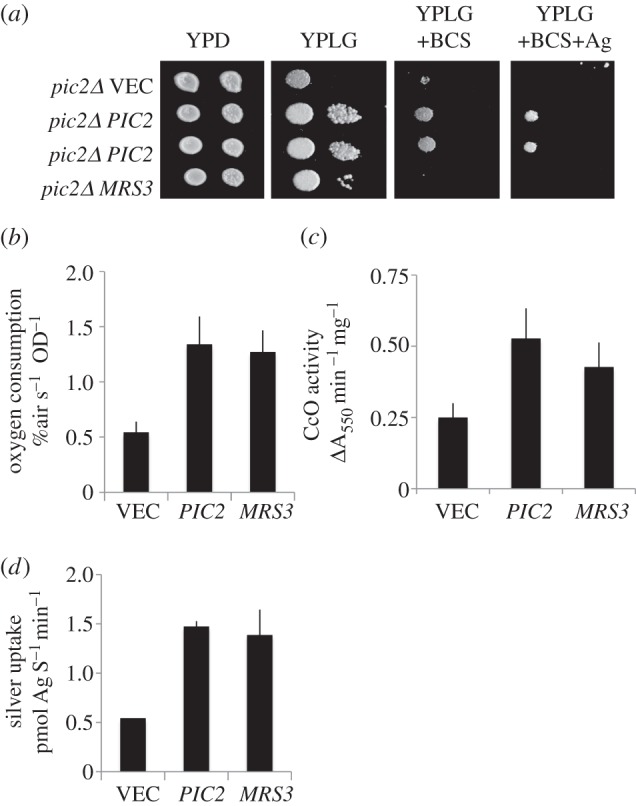
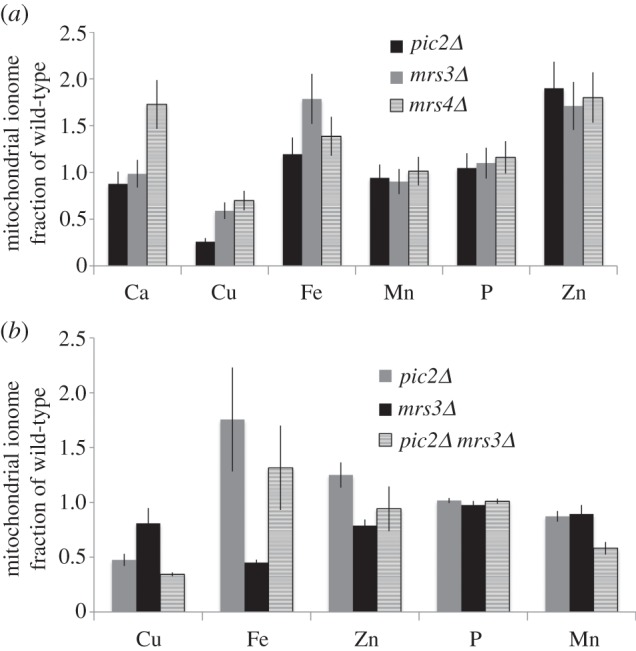
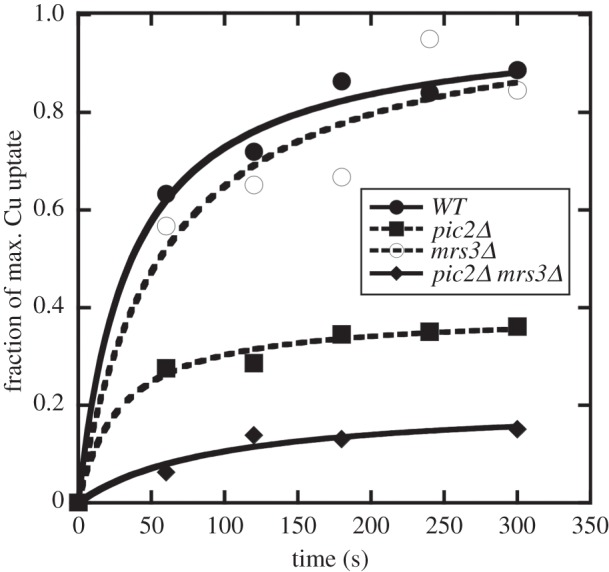
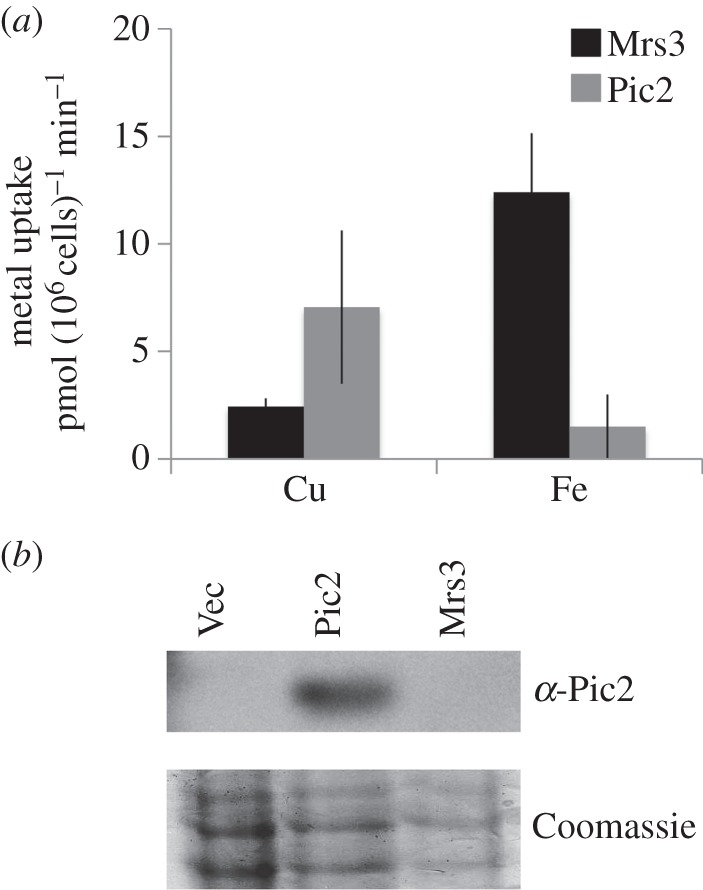
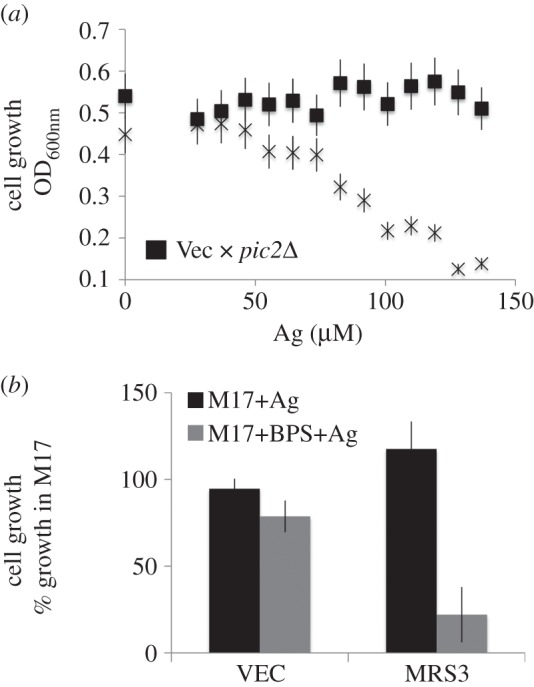
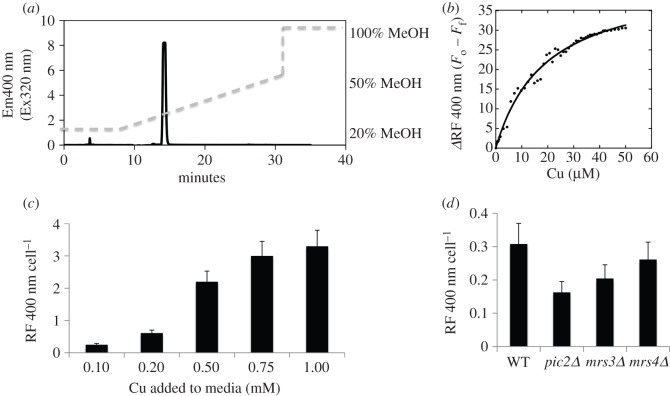
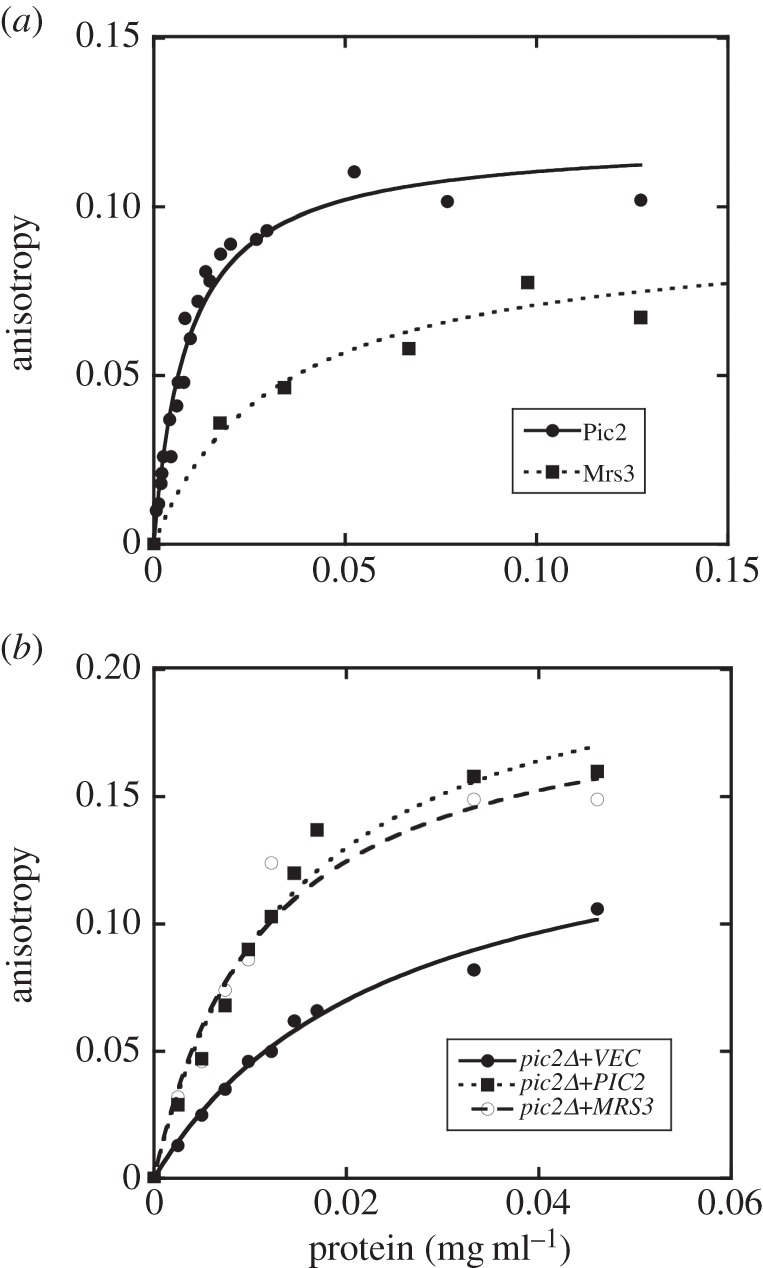
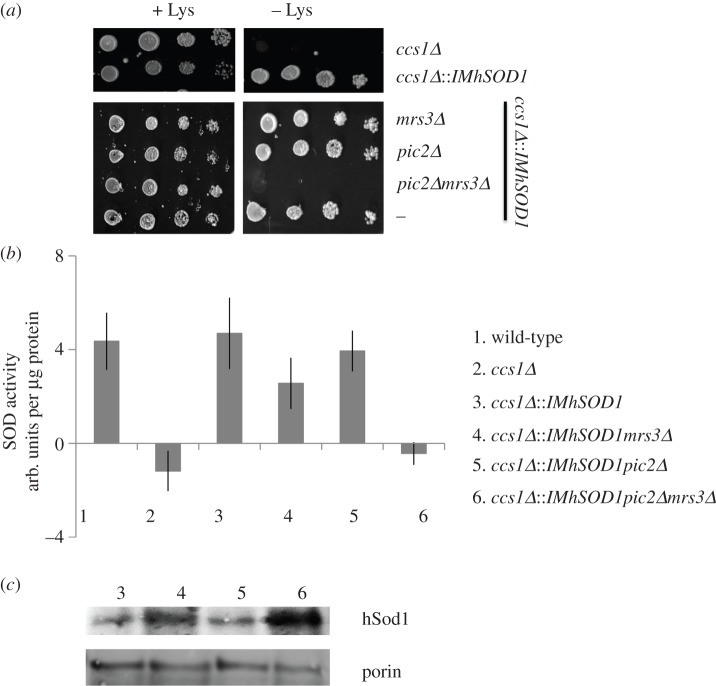
In Saccharomyces cerevisiae, the mitochondrial carrier family protein Pic2 imports copper into the matrix. Deletion of PIC2 causes defects in mitochondrial copper uptake and copper-dependent growth phenotypes owing to decreased cytochrome c oxidase activity. However, copper import is not completely eliminated in this mutant, so alternative transport systems must exist. Deletion of MRS3, a component of the iron import machinery, also causes a copper-dependent growth defect on non-fermentable carbon. Deletion of both PIC2 and MRS3 led to a more severe respiratory growth defect than either individual mutant. In addition, MRS3 expressed from a high copy number vector was able to suppress the oxygen consumption and copper uptake defects of a strain lacking PIC2. When expressed in Lactococcus lactis, Mrs3 mediated copper and iron import. Finally, a PIC2 and MRS3 double mutant prevented the copper-dependent activation of a heterologously expressed copper sensor in the mitochondrial intermembrane space. Taken together, these data support a role for the iron transporter Mrs3 in copper import into the mitochondrial matrix.

Keywords: copper; cytochrome c oxidase; iron; mitochondrial carrier family.


Figures

Figure 1.
Figure 1.
Copper-related growth phenotypes in pic2Δmrs3Δ. (a) Serial dilutions of BY4741 (wild-type; WT) and single MCF deletion strains grown on rich medium with a non-fermentable carbon source (lactate–glycerol) in the presence of the cell-impermeable copper chelator bathocuproine sulfonate (YPLG+BCS) or the same medium with supplemental silver at 100 µM (YPLG+BCS+Ag). (b) Oxygen consumption of whole WT, pic2Δ or mrs3Δ cells grown in rich medium with glucose and 50 µM silver added. (c) Serial dilutions of double mutant strains indicated grown on rich medium with a fermentable (glucose; YPD) or a non-fermentable carbon source (lactate–glycerol) in the presence of the cell-impermeable copper chelator BCS (YPLG+BCS) or in the presence of BCS and silver.
Figure 2.
Figure 2.
Suppression of pic2Δ by MRS3. (a) Serial dilutions of pic2Δ strains transformed with episomal vector containing no insert (VEC), or PIC2 cloned under the control of the endogenous promoter (PIC2), PIC2 under the control of high expression ADH1 promoter or MRS3 under the control of the endogenous promoter grown on rich medium with a fermentable carbon source (dextrose; YPD), non-fermentable carbon source (lactate–glycerol; YPLG), non-fermentable carbon source in the presence of the cell-impermeable copper chelator BCS (YPLG+BCS) or the same medium with supplemental silver at 100 µM (YPLG+BCS+Ag). (b) Oxygen consumption of whole pic2Δ cells with either empty vector, multi-copy vector with PIC2 under control of the endogenous promoter or multi-copy vector with MRS3 under control of the endogenous promoter. (c) Mitochondria isolated from strains in (b) assayed for cytochrome c oxidase (CcO) activity normalized to total protein. (d) AgL uptake into isolated mitochondria from (c) initial rates calculated from first 30–60 s of uptake at 10°C as described previously [19].
Figure 3.
Figure 3.
Total mitochondrial metals in pic2Δ, mrs3Δ, mrs4Δ and pic2Δmrs3Δ. (a) Relative concentrations of Ca, Cu, Fe, Mn, P and Zn in mitochondria from pic2Δ, mrs3Δ and mrs4Δ cells grown in rich medium with a fermentable carbon source (glucose) with 0.5 mM FeSO4. (b) Relative concentrations of Cu, Fe, Zn, P and Mn in mitochondria from pic2Δ (n = 24), mrs3Δ (n = 14) and pic2Δmrs3Δ (n = 6) cells grown in synthetic medium with a fermentable carbon source (glucose) with added 0.5 mM CuSO4 and 0.5 mM FeSO4. Copper concentrations significantly decreased in pic2Δmrs3Δ compared with pic2Δ based on two-tailed t-test (p = 0.03). Metals were measured by ICP-OES and normalized on a per-sulfur basis before being calculated as a fraction of those found in wild-type cells.
Figure 4.
Figure 4.
Mitochondrial copper uptake in WT, pic2Δ, mrs3Δ and pic2Δmrs3Δ. Isolated mitochondria from parental, mrs3Δ, pic2Δ or pic2Δmrs3Δ cells assayed for in vitro uptake of the CuL as measured by an increase in copper over time. Uptake is reported as the percentage of maximum uptake observed in wild-type mitochondria. Representative data are shown of three repeated measurements of uptake. Mitochondria were normalized for protein, and copper was measured by ICP-OES and normalized on a per-sulfur basis.
Figure 5.
Figure 5.
Expression of Mrs3 in Lactococcus lactis. (a) Uptake of copper or iron by intact cells transformed with MRS3 or PIC2 incubated at room temperature for 10 min with 2 µM CuSO4 (n = 4) or 2 µM FeSO4 (n = 4). Uptake observed in cells expressing empty vector was subtracted and rate increase per minute was calculated on a per 106 cell basis. Error bars represent standard deviation. (b) Western blot of L. lactis transformed with empty vector (Vec) or PIC2 or MRS3 probed with antibody specific to Pic2 and an identical gel with the same samples loaded stained with Coomassie as a loading control.
Figure 6.
Figure 6.
Silver toxicity in Lactococcus lactis. (a) Optical density at 600 nm of L. lactis carrying empty vector (filled square) and PIC2 (cross) grown for 12 h in nisin to induce gene expression in the presence of increasing concentrations of silver. (b) Cell growth of L. lactis expressing MRS3 or empty vector (VEC) grown in 120 µM silver with nisin in standard medium (M17) or in iron-depleted medium (M17+BPS).
Figure 7.
Figure 7.
Fluorescence emissions of CuL with 320 nm excitation. (a) Reverse phase purification of anionic, copper-containing soluble matrix contents. Cells were grown overnight in SC (glucose) medium. Soluble contents were separated by anion exchange chromatography and loaded onto a C18 reverse phase column. CuL was observed as the fluorescent peak (Ex320 Em400) that eluted at 14 minutes (approx. 35% methanol). (b) Change in relative fluorescence (ΔRF) in CuL fractions titrated with sequential addition of Cu-acetonitrile. (c) CuL was prepared as in (a) from wild-type cells grown in SC medium with increasing CuSO4. The area of the 14-min ligand peak was quantified. Shown are the average intensities from three separate experiments. (d) Ligand was quantified from wild-type, pic2Δ, mrs3Δ and mrs4Δ cells grown in YPD media with 0.5 mM FeSO4. Shown is the average of three separate experiments. Error bars represent standard deviation.
Figure 8.
Figure 8.
Anisotropy of CuL in presence of Pic2, Mrs3 and mitochondrial membranes. (a) Fluorescence anisotropy (FA) of CuL (Ex320 Em400) with addition of reconstituted Pic2 or Mrs3 in proteoliposomes prepared from extracted egg-yolk lipids. Control FA of equal quantity of lipids without protein added was subtracted from each point. (b) FA of CuL with mitochondrial membranes prepared by sonication of intact mitochondria followed by centrifugation from pic2Δ yeast expressing empty vector (VEC), PIC2 or MRS3. Protein concentrations were determined by Bradford assay, and curves are fit with a hyperbola function.
Figure 9.
Figure 9.
Deletion of PIC2 and MRS3 in a copper reporter strain. (a) Serial dilutions of wild-type and ccs1Δ, ccs1Δ::IMhSOD1, mrs3Δccs1Δ::IMhSOD1, pic2Δccs1Δ::IMhSOD1 and pic2Δmrs3Δccs1Δ::IMhSOD1 cells grown on synthetic medium under hyperoxic conditions with a fermentable carbon source (glucose) in the presence or absence of lysine. (b) Activity of SOD1 in isolated mitochondria from wild-type (#1), ccs1Δ (#2), ccs1Δ::IMhSOD1 (#3), mrs3Δccs1Δ::IMhSOD1 (#4), pic2Δccs1Δ::IMhSOD1 (#5), and pic2Δmrs3Δccs1Δ::IMhSOD1(#6) cells grown in synthetic medium with fermentable carbon source as measured by xanthine oxidase/tetrazolium salt assay (n = 3) and normalized to total protein. (d) Immunoblot of hSOD1 and porin as a loading control from ccs1Δ::IMhSOD1 (#3), mrs3Δccs1Δ::IMhSOD1(#4), pic2Δccs1Δ::IMhSOD1 (#5) and pic2Δmrs3Δccs1Δ::IMhSOD1 (#6).

Similar articles

Cited by

References

    1. Hassett R, Dix DR, Eide DJ, Kosman DJ. 2000. The Fe(II) permease Fet4p functions as a low affinity copper transporter and supports normal copper trafficking in Saccharomyces cerevisiae. Biochem. J. 351, 477–484. (doi:10.1042/bj3510477) - DOI - PMC - PubMed
    1. Dancis A, Haile D, Yuan DS, Klausner RD. 1994. The Saccharomyces cerevisiae copper transport protein (Ctr1p). Biochemical characterization, regulation by copper, and physiologic role in copper uptake. J. Biol. Chem. 269, 25 660–25 667. - PubMed
    1. Lin SJ, Pufahl RA, Dancis A, O'Halloran TV, Culotta VC. 1997. A role for the Saccharomyces cerevisiae ATX1 gene in copper trafficking and iron transport. J. Biol. Chem. 272, 9215–9220. (doi:10.1074/jbc.272.14.9215) - DOI - PubMed
    1. Sturtz LA, Diekert K, Jensen LT, Lill R, Culotta VC. 2001. A fraction of yeast Cu,Zn-superoxide dismutase and its metallochaperone, CCS, localize to the intermembrane space of mitochondria. A physiological role for SOD1 in guarding against mitochondrial oxidative damage. J. Biol. Chem. 276, 38 084–38 089. (doi:10.1074/jbc.M105296200) - DOI - PubMed
    1. Rae TD, Schmidt PJ, Pufahl RA, Culotta VC, O'Halloran TV. 1999. Undetectable intracellular free copper: the requirement of a copper chaperone for superoxide dismutase. Science 284, 805–808. (doi:10.1126/science.284.5415.805) - DOI - PubMed

Publication types

LinkOut - more resources