. 2016 Mar;5(3):465-77.
doi: 10.1002/cam4.611. Epub 2016 Jan 14.

Sp1-mediated ectopic expression of T-cell lymphoma invasion and metastasis 2 in hepatocellular carcinoma

Affiliations

Sp1-mediated ectopic expression of T-cell lymphoma invasion and metastasis 2 in hepatocellular carcinoma

Wei-Hsuan Yen et al. Cancer Med. 2016 Mar.

Abstract

T-cell lymphoma invasion and metastasis 2 (TIAM2) is a neuron-specific protein that has been found ectopically expressed in hepatocellular carcinoma (HCC). Results from clinical specimens and cellular and animal models have shown that the short form of TIAM2 (TIAM2S) functions as an oncogene in the tumorigenesis of liver cancer. However, the regulation of TIAM2S ectopic expression in HCC cells remains largely unknown. This study aimed to identify the mechanism underlying the ectopic expression of TIAM2S in liver cancer cells. In this report, we provide evidence illustrating that Sp1 binds directly to the GC box located in the TIAM2S core promoter. We further demonstrated that overexpression of Sp1 in HepaRG cells promotes endogenous TIAM2S mRNA and protein expressions, and knockdown of Sp1 in 2 HCC cell lines, HepG2 and PLC/PRF/5, led to a substantial reduction in TIAM2S mRNA and protein in these cells. Of 60 paired HCC samples, 70% showed a significant increase (from 1.1- to 3.6-fold) in Sp1 protein expression in the tumor cells. The elevated Sp1 expression was highly correlated with both TIAM2S mRNA and protein expressions in these samples. Together, these results illustrate that Sp1 positively controls TIAM2S transcription and that Sp1-mediated transcriptional activation is essential for TIAM2S ectopic expression in liver cancer cells.

Keywords: Ectopic activation; GC box; Sp1; TATA-less gene; TIAM2S.


Figures

Figure 1
Figure 1
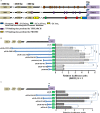
Defining the TIAM2S minimal core promoter region. (A) Sequences upstream from the TSS (blue arrowhead) of TIAM2S were used to analyze the potential promoter and TF‐binding sites. Results depicted are from the Eukaryotic Promoter database, TFSEAR, and PROMO. The presences of promoter or TF‐binding sites are indicated as boxes. Luciferase assays as representations for promoter activity were performed in (B) IMR32 and (C) HepG2 cells for constructs containing different TIAM2S upstream sequences. The positions of cloned sequences relative to the TSS are shown on the left panel. Measured luciferase activity relative to the empty vector (pGL3b) is indicated in the right panel. Relative luciferase activities were compared using one‐way ANOVA (*< 0.05, **< 0.01, ***< 0.001). Data were generated from three independent experiments.
Figure 2
Figure 2
Sp1 specifically binds to the TIAM2S upstream core promoter region. (A) Predicted TF‐binding sites on the TIAM2S core promoter region. The ‐87 to ‐51 regions of the TIAM2S upstream sequences are shown. The underline marks biotin‐labeled sequences that were used in electrophoretic mobility shift assay (EMSA) analysis. (B) EMSAs were performed using biotin‐labeled probes and nuclear extracts isolated from HepG2 cells. From left to right, lanes 1 and 2 were probe only and with nuclear extract, respectively. For the competition assay, 2‐, 5‐, or 10‐fold of unlabeled probe was added (lanes 3‐5). IgG served as the negative control for the DNA‐protein binding assay (lane 6), and 500 ng of anti‐Sp1 antibodies were used in the binding reaction and showed specific DNA–protein interaction in the supershift assay (lane 7). ChIP assays were performed in the PLC/PRF/5 (C) and HepG2 (D) cells. The represented images indicate that the TIAM2S promoter is specifically bound by anti‐Sp1 antibodies (left panels, C and D). The bar charts (right panels, C and D) show the quantitative signals from Sp1 relative to the control IgG. Results were calculated from three independent experiments. *< 0.05, **< 0.01, ***< 0.001.
Figure 3
Figure 3
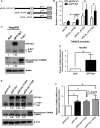
Sp1 controls TIAM2S transcription both in vitro and in vivo. (A) Serial TIAM2S deletion constructs of luciferase reporter plasmids used for transient transfection. (B) Overexpression of Sp1 increased the level of luciferase activity driven by a TIAM2S promoter containing a GC box. The pGL3‐b and pEGFP‐N1 served as negative controls for the promoter assay and overexpression assay, respectively. (C) Levels of endogenous Sp1 (upper panel) and TIAM2S (middle panel). Relative protein levels were quantified using spot‐density analysis and normalized to β‐actin. (D) Relative TIAM2S mRNA levels in HepaRG cells were measured using qRTPCR analysis. (E) Levels of endogenous Sp1 (upper panel, left) and TIAM2S (middle panel, left) in cells transfected with various Sp1 constructs in PLC/PRF/5 cells. The potential Sp1 phosphorylated threonine sites were mutated to alanine (T739A, constructive inactivated form) and aspartate (T739D, constructive activated form) as indicated. pEGFP‐N1 served as a negative control. Relative protein levels of Sp1 and TIAM2S were quantified using spot‐density analysis and normalized to β‐actin. The TIAM2S stable clone T1A1 was used as a positive control for TIAM2S expression. (F) Relative TIAM2S mRNA levels in various SP1‐mutant expressing cells were measured and compared. “p‐Sp1” represents phosphorylated Sp1. *< 0.05.
Figure 4
Figure 4
Sp1 positively regulates human TIAM2S mRNA expression in HCC cells (A) Endogenous levels of Sp1 and TIAM2S in different HCC cell lines were measured using Western blotting. The bar chart shows the quantified expressions of Sp1 protein (B), TIAM2S mRNA (C), and TIAM2S protein (D) between two HCC cell lines and one normal liver cell line (i.e., HepaRG). Both NT2D1 and T1A1 were positive controls. β‐Actin was a loading control. (C) and (D) The expression levels of both the TIAM2S mRNA (C) and protein (D) were increased by Sp1 overexpression in PLC/PRF/5 and HepG2 cells. Western blots showed that the endogenous levels of Sp1 were knocked down by anti‐Sp1 shRNA lentivirus (10 MOI for 48 h) in PLC/PRF/5 (E) and HepG2 (F) cells. Therefore, the results from qRTPCR showed that the TIAM2S mRNA was significantly reduced in Sp1‐knockdown PLC/PRF/5 (E, left) and HepG2 (F, left) cells. *< 0.05, **< 0.01, ***< 0.001.
Figure 5
Figure 5
Sp1 controls TIAM2S ectopic expression in HCC cells. (A) Expression levels of endogenous Sp1 (upper panel) and TIAM2S (middle panel) detected using Western blotting from six paired HCCs. TIAM2S stable clone T1A1 and α‐tubulin were used as positive and loading controls, respectively. (B) Relative Sp1 expression levels in tumor and matched nontumor cells from 60 paired HCCs were normalized to α‐tubulin and plotted in pairs. (C) Correlation between elevated expressions of Sp1 and TIAM2S from 60 paired HCCs were plotted and showed. (D) Using qRTPCR in 26 paired HCC cases, the results showed substantial correlation between the Sp1 protein level and TIAM2S mRNA amount. ***< 0.001.

References

    1. Chen, J. S. , Su I. J., Leu Y. W., Young K. C., and Sun H. S.. 2012. Expression of T‐cell lymphoma invasion and metastasis 2 (TIAM2) promotes proliferation and invasion of liver cancer. Int. J. Cancer 130:1302–1313. - PubMed
    1. Zhao, Z. Y. , Han C. G., Liu J. T., Wang C. L., Y. Wang , and Cheng L. Y.. 2013. TIAM2 enhances non‐small cell lung cancer cell invasion and motility. Asian Pac. J. Cancer Prev. 14:6305–6309. - PubMed
    1. Saraon, P. , Jarvi K., and Diamandis E. P.. 2011. Molecular alterations during progression of prostate cancer to androgen independence. Clin. Chem. 57:1366–1375. - PubMed
    1. Deniaud, E. , Baguet J., Chalard R., Blanquier B., L. Brinza , Meunier J., et al. 2009. Overexpression of transcription factor Sp1 leads to gene expression perturbations and cell cycle inhibition. PLoS ONE 4:e7035. - PMC - PubMed
    1. Beishline, K. , and Azizkhan‐Clifford J.. 2015. Sp1 and the ‘hallmarks of cancer’. FEBS J. 282:224–258. - PubMed

Publication types

MeSH terms