. 2016 Mar;115(3):1521-32.
doi: 10.1152/jn.01037.2015. Epub 2016 Jan 13.

Temporal correlations among functionally specialized striatal neural ensembles in reward-conditioned mice

Affiliations

Temporal correlations among functionally specialized striatal neural ensembles in reward-conditioned mice

Konstantin I Bakhurin et al. J Neurophysiol. 2016 Mar.

Abstract

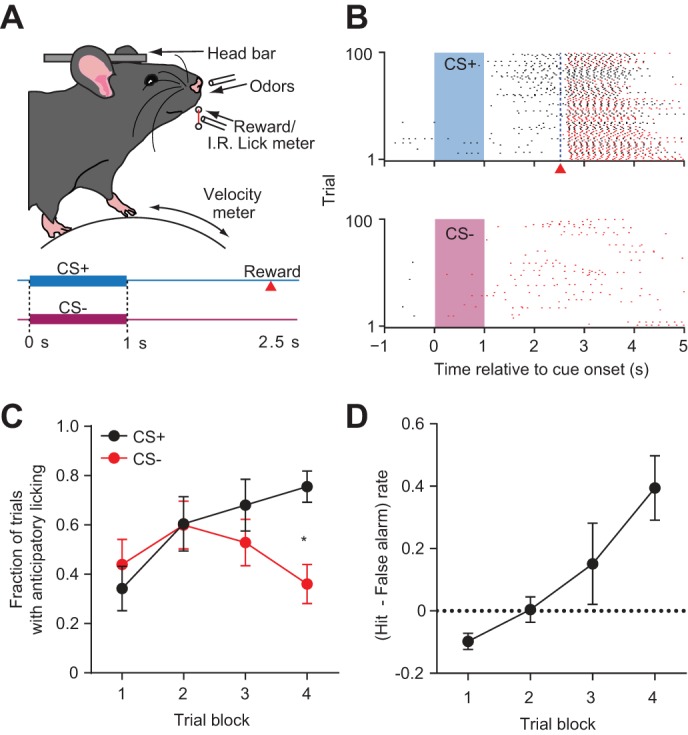
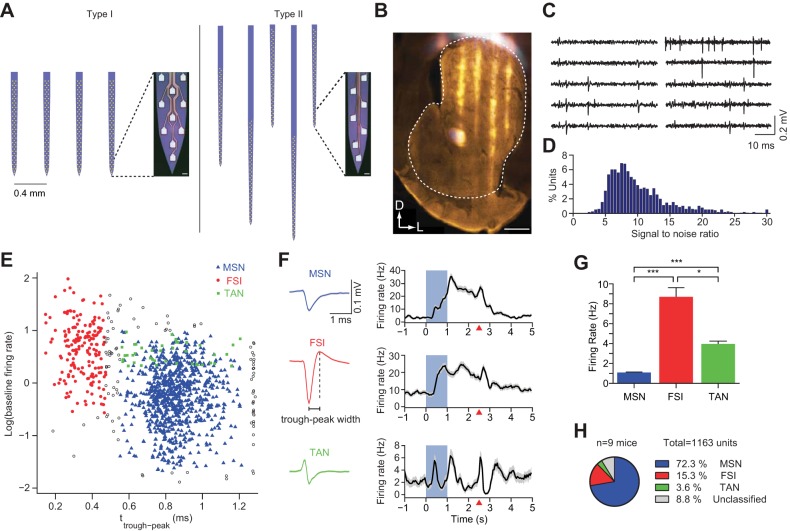
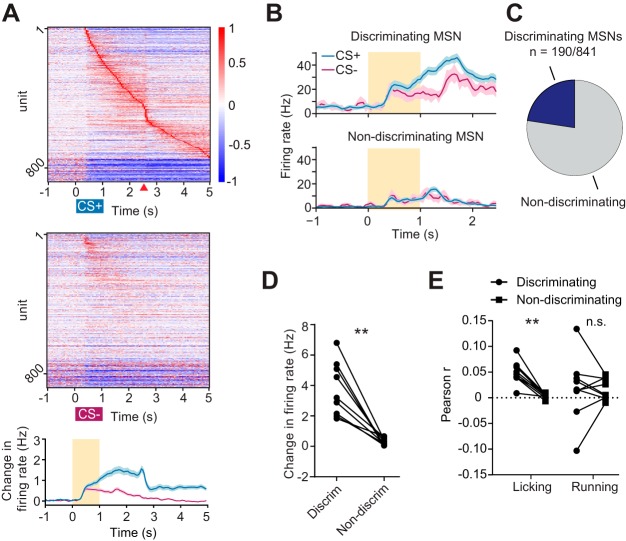
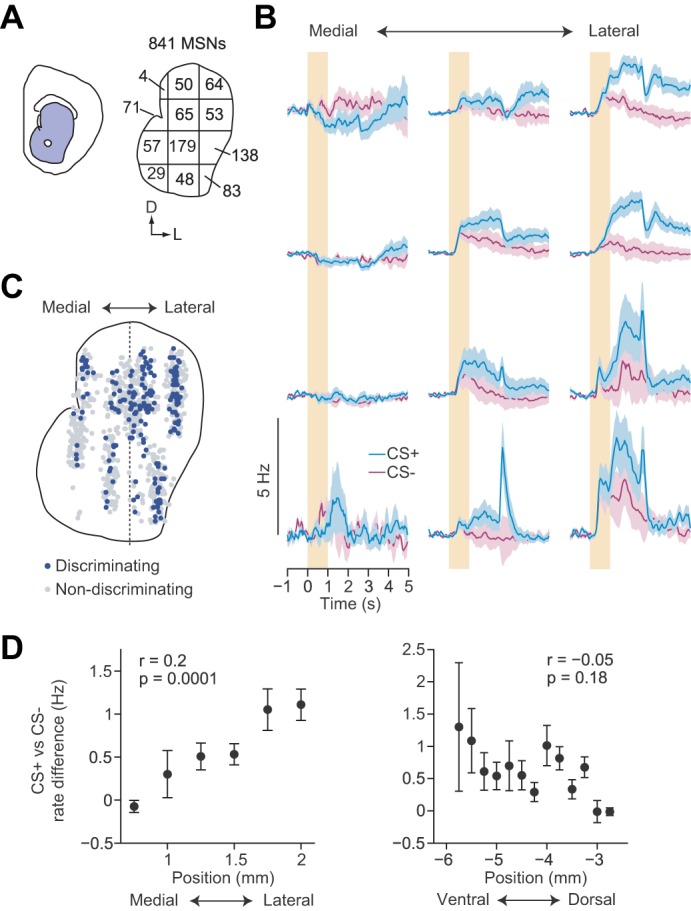
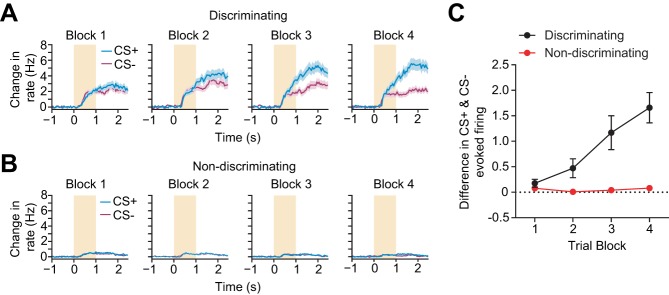
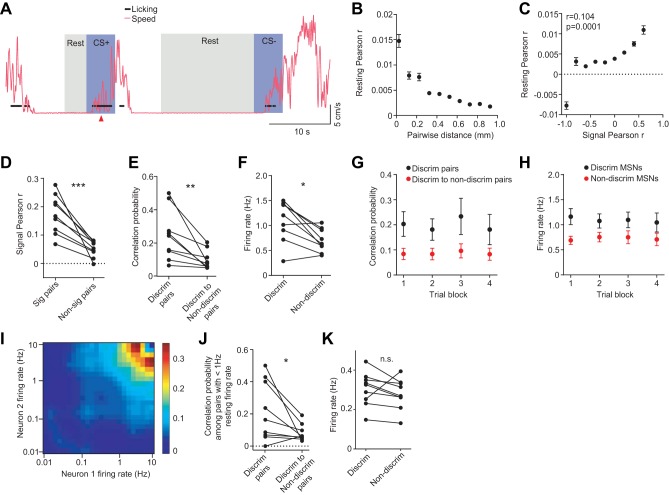
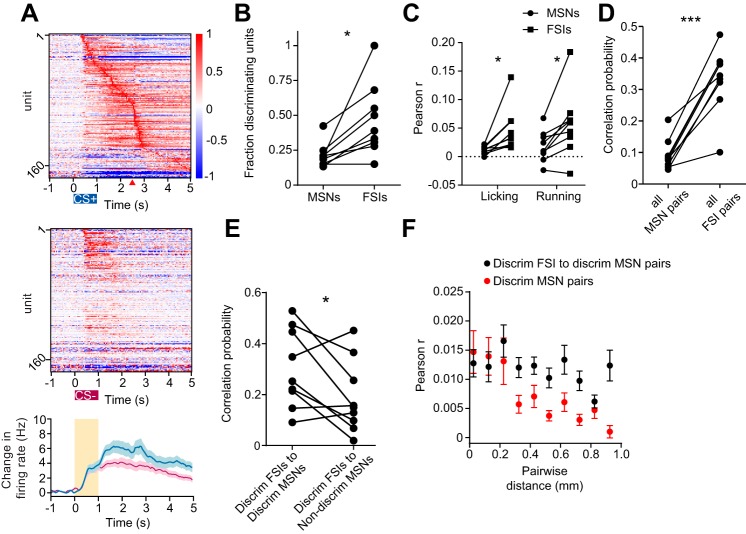
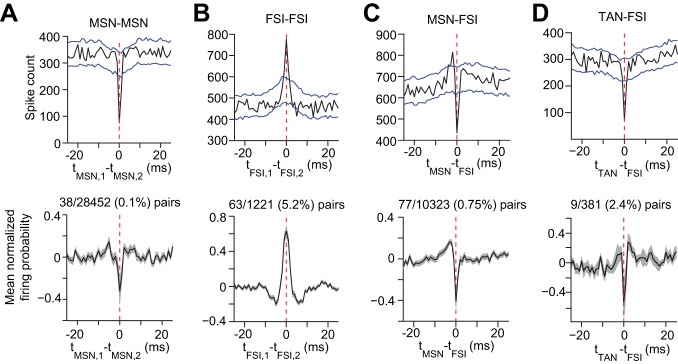
As the major input to the basal ganglia, the striatum is innervated by a wide range of other areas. Overlapping input from these regions is speculated to influence temporal correlations among striatal ensembles. However, the network dynamics among behaviorally related neural populations in the striatum has not been extensively studied. We used large-scale neural recordings to monitor activity from striatal ensembles in mice undergoing Pavlovian reward conditioning. A subpopulation of putative medium spiny projection neurons (MSNs) was found to discriminate between cues that predicted the delivery of a reward and cues that predicted no specific outcome. These cells were preferentially located in lateral subregions of the striatum. Discriminating MSNs were more spontaneously active and more correlated than their nondiscriminating counterparts. Furthermore, discriminating fast spiking interneurons (FSIs) represented a highly prevalent group in the recordings, which formed a strongly correlated network with discriminating MSNs. Spike time cross-correlation analysis showed the existence of synchronized activity among FSIs and feedforward inhibitory modulation of MSN spiking by FSIs. These findings suggest that populations of functionally specialized (cue-discriminating) striatal neurons have distinct network dynamics that sets them apart from nondiscriminating cells, potentially to facilitate accurate behavioral responding during associative reward learning.

Keywords: associative learning; correlations; single-unit recordings; striatum.


Figures

Fig. 1.
Fig. 1.
Head restrained mice demonstrate single-session discrimination learning. A: experimental setup and trial schematic. Head-fixed mice were placed on a spherical treadmill and were presented with olfactory cues and liquid rewards. Breaks in the infrared beam positioned in front of the lick tube were used to detect licking activity and treadmill velocity was monitored using an optical mouse (not shown). Trials consisted of either 1 s of odor (CS+) followed by a 1.5-s pause and a reward or a different 1-s odor (CS) followed by no outcome. B: licking activity rasters during CS+ and CS trials for 1 representative animal. Shaded rectangles represent the olfactory cue presentation period. Black and red tick marks indicate individual licks during trials with correct and incorrect responses, respectively. Red triangle indicates the time of reward delivery. C: learning curves for all animals (n = 9) showing the mean probability of licking after CS+ (black) and CS (red) trials in blocks of 25 trials. A two-way ANOVA, repeated measures revealed a significant effect of trial block (P = 0.003) and a significant interaction between trial types (P = 0.0016, *P < 0.05, Sidak's test for multiple comparisons). D: evolution of the mean discriminatory behavior rate in blocks of 25 trials (P = 0.0021, one-way, repeated-measures ANOVA). Error bars represent SE.
Fig. 2.
Fig. 2.
Large-scale striatal recordings with silicon microprobes. A: illustration of the two 256 electrode silicon microprobe designs used to record in the striatum. Each silicon prong contains a high-density electrode array, with the geometry shown in magnified images of the tips. Short scale bars = 10 μm. B: fluorescence image of silicon microprobe tracks (white) embedded in a tyrosine hydroxylase (TH)-labeled section of the striatum (orange). White outline represents the perimeter of the striatum. Scale bar = 0.5 mm. C: samples of measured signals from 10 representative recording sites, filtered offline from 600 to 6,500 Hz. Columns show simultaneously recorded data from 2 sets of adjacent recording sites. D: distribution of signal-to-noise ratios for all recorded units used in the study. E: scatterplot of the log of baseline firing rate vs. spike waveform trough-to-peak time with color representing putative cell identity. Gray circles denote unclassified units. F, left: representative waveforms of three putative cell types, medium spiny neurons (MSNs), fast spiking interneurons (FSIs), and tonically active neurons (TANs) identified in this study. F, right: corresponding mean firing rate during CS+ trials for each representative unit depicted at left aligned to the cue onset. Shaded rectangle represents CS+ odor cue delivery time. Red triangles indicate reward delivery. Rates are averaged over all correctly performed trials. G: mean baseline firing rate across all recorded MSNs, FSIs, and TANs in the study (*P < 0.05, ***P < 0.001, Bonferroni-corrected t-test). H: percentage of each cell class that comprised the combined dataset.
Fig. 3.
Fig. 3.
Identification of a cue-discriminating subpopulation of striatal MSNs. A: mean baseline subtracted and normalized firing rates for 841 MSNs obtained from 9 animals during correct CS+ trials (top) and correctly withheld CS trials (middle). Units in both plots are sorted by latency to peak firing during CS+ trials (top). Cues are presented between 0 and 1 s, indicated by colored rectangles. Reward delivery during CS+ trials is indicated with the red triangle. A, bottom: mean baseline subtracted firing rate for all neurons depicted in the heat plots. The orange rectangle represents the odor delivery time. B: mean baseline subtracted firing rate for two MSNs during correct CS+ trials (blue) and correctly withheld CS trials (magenta). Top: a representative discriminating MSN defined by differential firing between the CS+ and CS trial conditions. B, bottom: a representative nondiscriminating MSN. Discrimination was determined on the interval from 0 to 2.5 s following cue onset. C: pie chart showing the mean fraction of cue-discriminating MSNs. D: mean value per animal of baseline subtracted firing rate between 0 and 2.5 s during correct CS+ trials for discriminating (Discrim) and nondiscriminating MSNs (P = 0.0004, paired t-test). E: mean Pearson correlation coefficient between spiking activity of discriminating and nondiscriminating MSNs, and lick rate (P = 0.0002, paired t-test) or treadmill velocity (P = 0.9, paired t-test). **P < 0.001; n.s., not significant. Each point represents 1 animal. Lines between points represent paired data from individual animals. All error bars represent SE.
Fig. 4.
Fig. 4.
Mapping discriminatory activity across the striatal cross section. A: outline of the cross section of the striatum spatially divided into a 4 × 3 compartment grid. Values represent the total number of recorded MSNs allocated into each of the grid's compartments based on the estimated recording position of each unit. B: mean baseline subtracted firing rates for all MSNs positioned in each of the 12 boxes illustrated in A. Color conventions are identical to Fig. 3A. C: combined map of the location of discriminating (blue) and nondiscriminating (gray) MSNs recorded in all mice. Centers of all recordings were all aligned along the dotted line. D, left: Difference between the mean correct CS+ and CS firing rates for all neurons binned by their mediolateral recording position. D, right: difference between the mean correct CS+ and CS firing rates for all neurons binned by their dorsoventral recording position. Correlations were performed between position and difference in rate for MSNs pooled from all recordings (n = 841).
Fig. 5.
Fig. 5.
Evolution of activity in discriminatory MSNs during training. A: mean baseline subtracted firing rate for all discriminating MSNs during the period starting 1 s before cue onset until reward delivery for all CS+ trials (blue) and all CS trials (magenta). Each panel depicts firing activity for each trial type in blocks of 25 trials. Color conventions are identical to Fig. 3A. B: same as A for nondiscriminating MSNs. C: mean firing rate difference between CS+ trials and CS trials for discriminating and nondiscriminating MSNs in blocks of 25 trials. A two-way, repeated-measures ANOVA revealed a significant effect of trial block (P < 0.0001) and population (P = 0.0003) and a significant interaction between the 2 factors (P < 0.0001). Averages were computed across individual animals; n = 9. Error bars represent SE.
Fig. 6.
Fig. 6.
Correlated resting state activity in the striatum. A: sample data depicting resting state identification. The black circles and magenta traces represent individual licks and running speed on the treadmill, respectively. Blue shaded regions label a 5-s window following cue onset. Gray shaded regions depict resting periods that would be concatenated with other resting periods for resting state analysis. B: mean resting correlation coefficient for all MSN pairs plotted as a function of pairwise distance (P < 0.0001, one-way ANOVA). Data are binned in 0.1-mm increments. C: Mean resting correlation coefficient for all MSN pairs plotted as a function of the pair's signal correlation during correct CS+ trials. Binned data show a strong relationship between these parameters, and unbinned data are also correlated (n = 23,758 pairs, permutation test for correlations). Removing the outlier point in the left-most bin did not change the significance of the correlation (P < 0.0001, r = 0.104, permutation test for correlations). D: mean signal correlation coefficient for significantly correlated (Sig) and noncorrelated MSN pairs during spontaneous activity in the resting state. Points represent mean values of individual animals (***P = 0.0008, paired t-test, n = 9). E: probability of finding significant resting correlations among discriminating MSN pairs, and between discriminating to nondiscriminating MSN pairs (**P = 0.0096, paired t-test). Points represent the fraction of pairs spaced within 0.025 to 1 mm recorded from individual animals. F: mean resting state firing rate of discriminating MSNs and nondiscriminating MSNs (*P = 0.011, paired t-test). Points represent the mean rate in individual animals. G: resting state correlation probabilities among discriminating MSN pairs and between discriminating to nondiscriminating MSN pairs calculated during resting times that occurred in different blocks of the recording. Each trial block represents resting periods detected within blocks of 25 CS+ trials. H: resting firing rates for discriminating and nondiscriminating MSNs calculated during blocked resting periods. I: mean probability of finding significant pairwise resting correlations, as a function of the firing rate of each cell in the pair. Color scale represents significant resting correlation probability. J: resting state correlation probabilities among pairs of discriminating and between pairs of discriminating to nondiscriminating MSNs that had firing rates ≤1 Hz (*P = 0.042, paired t-test). K: mean resting state firing rate of discriminating MSNs and nondiscriminating MSNs having firing rates < 1 Hz (P = 0.3, paired t-test). Lines between points represent paired data from individual animals. All error bars are SE.
Fig. 7.
Fig. 7.
Discriminating FSIs and MSNs form correlated ensembles. A: Mean baseline subtracted and normalized firing rates for all 178 FSIs recorded from 9 animals during correct CS+ trials (top) and correctly withheld CS trials (middle). Units in both plots are sorted by latency to peak firing in the top plot. Cues are presented between 0 and 1 s, indicated by colored rectangles. Reward delivery during CS+ trials is indicated with the red triangle. Bottom: mean baseline subtracted firing rate for all FSIs depicted in the heat plots. Orange rectangle represents odor delivery time. B: mean fraction of cue-discriminating MSNs and FSIs (*P = 0.011, paired t-test). C: mean Pearson correlation coefficient between spiking activity of all MSNs or FSIs, and lick rate (P = 0.016, paired t-test) or treadmill velocity (*P = 0.012, paired t-test) behavior. D: Probability of finding significant resting correlations among pairs of MSNs and FSIs (***P < 0.0001, paired t-test). E: probability of finding significant resting correlations among pairs of discriminating FSIs and MSNs and between pairs of discriminating FSIs and nondiscriminating MSNs (*P = 0.0395, paired t-test). F: Mean resting correlation coefficient for all discriminating FSI and MSN pairs and all discriminating MSN pairs plotted as a function of pairwise distance. A two-way ANOVA revealed a significant effect of population (P < 0.0001) and pairwise distance (P < 0.0001). Data pooled from all animals are binned in 0.1-mm increments. Lines between points represent paired data from individual animals. Error bars are all SE.
Fig. 8.
Fig. 8.
A, top: spike time cross correlogram between one pair of MSNs exhibiting significant cross correlation. Blue lines represent upper and lower 99% confidence intervals of the time-jittered cross correlation. A, bottom: mean jitter subtracted and normalized cross correlogram for all MSN pairs exhibiting significant cross correlation. The fraction (0.1%) indicates the proportion of MSN pairs recorded within 0.025 to 1 mm that exhibited significant cross correlation according to the jitter test. Dotted red lines are aligned to a time lag of 0 s. B: same as A but for FSI pairs. C: same as A but for MSN-FSI pairs. D: same as A but for TAN-FSI pairs. Error bars represent SE.

References

    1. Adler A, Katabi S, Finkes I, Israel Z, Prut Y, Bergman H. Temporal convergence of dynamic cell assemblies in the striato-pallidal network. J Neurosci 32: 2473–2484, 2012. - PMC - PubMed
    1. Alexander GE, DeLong MR, Strick PL. Parallel organization of functionally segregated circuits linking basal ganglia and cortex. Annu Rev Neurosci 9: 357–381, 1986. - PubMed
    1. Aosaki T, Tsubokawa H, Ishida A, Watanabe K, Graybiel AM, Kimura M. Responses of tonically active neurons in the primate's striatum undergo systematic changes during behavioral sensorimotor conditioning. J Neurosci 14: 3969–3984, 1994. - PMC - PubMed
    1. Arieli A, Sterkin A, Grinvald A, Aertsen A. Dynamics of ongoing activity: explanation of the large variability in evoked cortical responses. Science 273: 1868–1871, 1996. - PubMed
    1. Averbeck BB, Latham PE, Pouget A. Neural correlations, population coding and computation. Nat Rev Neurosci 7: 358–366, 2006. - PubMed

Publication types

LinkOut - more resources