. 2016 Mar 1;129(5):971-82.
doi: 10.1242/jcs.175224. Epub 2016 Jan 13.

Coordination of autophagosome-lysosome fusion and transport by a Klp98A-Rab14 complex in Drosophila

Affiliations

Coordination of autophagosome-lysosome fusion and transport by a Klp98A-Rab14 complex in Drosophila

Caroline Mauvezin et al. J Cell Sci. .

Abstract

Degradation of cellular material by autophagy is essential for cell survival and homeostasis, and requires intracellular transport of autophagosomes to encounter acidic lysosomes through unknown mechanisms. Here, we identify the PX-domain-containing kinesin Klp98A as a new regulator of autophagosome formation, transport and maturation in Drosophila. Depletion of Klp98A caused abnormal clustering of autophagosomes and lysosomes at the cell center and reduced the formation of starvation-induced autophagic vesicles. Reciprocally, overexpression of Klp98A redistributed autophagic vesicles towards the cell periphery. These effects were accompanied by reduced autophagosome-lysosome fusion and autophagic degradation. In contrast, depletion of the conventional kinesin heavy chain caused a similar mislocalization of autophagosomes without perturbing their fusion with lysosomes, indicating that vesicle fusion and localization are separable and independent events. Klp98A-mediated fusion required the endolysosomal GTPase Rab14, which interacted and colocalized with Klp98A, and required Klp98A for normal localization. Thus, Klp98A coordinates the movement and fusion of autophagic vesicles by regulating their positioning and interaction with the endolysosomal compartment.

Keywords: Autophagy; Intracellular trafficking; Klp98A; Rab14.


Conflict of interest statement

Competing interests

The authors declare no competing or financial interests.

Figures

Fig. 1.
Fig. 1.
Klp98A controls the intracellular distribution of autophagosomes in Drosophila fat body cells. (A) Domains of Klp98A orthologs in Drosophila and human (KIF16B, isoform 2). The kinesin motor, forkhead-associated (FHA) and PX domains are highlighted in red, green and yellow, respectively. (B) Clonal expression of an RNAi construct (RNAi 1) targeting Klp98A in GFP-marked cells under starvation causes perinuclear accumulation and reduced number of Atg8-positive structures (in gray). (C) Representative images at the nuclear plane (proximal) and cell periphery (distal plane) of Atg8-positive vesicles (in gray) in cells overexpressing Klp98A in clones marked by GFP (green) after 4 h starvation. A magnification of the boxed region is shown in the lower panels. Nuclei are labeled with DAPI in blue. Scale bars: 10 µm.
Fig. 2.
Fig. 2.
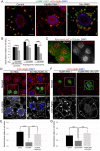
Loss of Klp98A induces a perinuclear distribution of autophagic vesicles. (A) Representative images of starved fat body cells expressing tissue-wide LAMP1–GFP (in green) and mCh–Atg8a (in red). Depletion of Klp98A or Khc leads to perinuclear accumulation of both LAMP- and Atg8a-positive structures. (B) Mean±s.e.m. distance from the nucleus of late endosomes and lysosomes, autophagosomes and autolysosomes in control, Klp98A- and Khc-depleted cells (representative images shown in panel A). n≥12 images of independent fat bodies. (C) Microtubule polarity in fat body cells. The minus-ends of microtubule are marked by Khc-nod–LacZ (in red and at right in grayscale). Fat body cells were stained for α-Tubulin (in green). A z-projection confocal image is shown. (D) Representative images of GFP-marked cell clones expressing Khc RNAi alone (left panel) or in combination with Klp98A–HA co-expression. Accumulation of mCh–Atg8a-positive vesicles (shown in grayscale below) around the nucleus upon Khc depletion is rescued by Klp98A overexpression. (E) Quantification (mean±s.e.m.) of the distance from the nucleus of mCh–Atg8a-positive vesicles relative to cell diameter for each genotype from images in D. n=10. (F) Rescue experiment showing depletion of Klp98A in GFP-marked clones, alone (left panel) or with Khc–GFP co-expression (right panel). mCh–Atg8a-positive vesicles from the boxed regions in those cells are shown in grayscale in the lower panels (the cell periphery is outlined). (G) Quantification (mean±s.e.m.) of the distance from the nucleus of mCh–Atg8a-positive vesicles relative to cell size for each genotype from images in F. n=10. Nuclei in A,C, D and F are labeled in blue (DAPI staining). ***P<0.001 (Student's t-test). Scale bars: 10 µm.
Fig. 3.
Fig. 3.
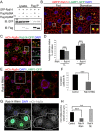
Loss of Klp98A reduces autolysosome formation, acidification and degradation. (A) Representative images of 4-h-starved fat body cells expressing GFP–LAMP1 (in green) and mCh–Atg8a (in red) under the fat-body-specific driver Cg-Gal4. Autolysosomes (labeled by both markers) are detected in control and Khc-depleted cells, whereas depletion of Klp98A reduces the colocalization between LAMP1- and Atg8a-positive structures (see insets) similar to the effect of Syx17 depletion. (B) Quantification (mean±s.e.m.) of the Pearson's correlation coefficient between LAMP1–GFP- and mCh–Atg8a-positive vesicles from experiments shown in A. n≥12 independent images analyzed per genotype. ***P<0.001 (Student's t-test). (C) Representative images of fat body cells expressing the double tagged mCh–GFP–Atg8a reporter after 4 h starvation. Silencing of Klp98A results in a block of GFP quenching (see insets). (D) Quantification (mean±s.e.m.) of the ratio between green and red fluorescence intensity for the mCh–GFP–Atg8a experiments shown in C and Fig. S3B. n≥7 independent images analyzed per genotype. **P<0.05; ***P<0.001 (Student's t-test). (E) Timecourse of GFP–Ref(2)P degradation during starvation-induced autophagy in control and Klp98A-depleted fat body cells. β-tubulin protein level was assessed as loading control. The ratio of GFP-Ref(2)P to β-tubulin is shown below each time point. (F) mTOR reactivation assay. Levels of phosphorylated S6K (P-S6K) were assessed during amino acid starvation (0, 2 and 4 h timecourse) in control cells and cells depleted for Klp98A. β-tubulin was used as loading control. The P-S6K to β-tubulin ratio is indicated below each condition. In A and C, nuclei are labeled in blue (DAPI staining). Scale bars: 10 µm.
Fig. 4.
Fig. 4.
Klp98A is necessary for autophagosome induction. (A,B) Quantification of the number of autophagosomes (A, mCh–Atg8a-positive but Lamp1–GFP-negative vesicles) or autolysosomes (B, mCh–Atg8a and LAMP1–GFP-positive vesicles) per cell in well-fed or 4-h-starved control, Klp98A- or Syx17-depleted cells. (C,D) Quantification of the size of autophagosomes (C) or autolysosomes (D) in identical genotypes and conditions as in A and B. In all panels, error bars mark s.e.m., n>10 independent images analyzed per genotype and condition. ***P<0.001 (Student's t-test).
Fig. 5.
Fig. 5.
Rab14 functions in autophagosome maturation and intracellular distribution. (A) Co-immunoprecipitation (IP) from S2 cells of GFP–Rab14 with Flag–Klp98A and Flag–Klp98AΔPX. Extracts were immunoblotted (IB) for GFP or Flag. (B) Representative images of fat body cells expressing mRFP–Rab14 (red) and LAMP1–GFP (green) under nutrient-rich and 4-h starvation conditions. (C) Confocal image representative of the colocalization between a subset of Rab14–GFP (green) and mCh–Atg8a-positive vesicles (red) under starvation-induced autophagy in fat body cells. White arrowheads in the insets on the right highlight vesicles only containing mCh–Atg8a. Pink arrowheads indicate Rab14–GFP- and mCh–Atg8a-positive vesicles. (D) Quantification (mean±s.e.m.) of the intracellular distribution of late endosome or lysosomes (LL, positive only for LAMP1-GFP) and autophagosomes (AP, positive only for mCh-Atg8a) in control and Rab14-depleted fat body cells. n≥10 independent images analyzed per genotype. ***P<0.001 (Student's t-test). (E) Representative confocal images of larval fat body cells co-expressing mCh–Atg8a (red) and LAMP1–GFP (green) in cells depleted of Rab14 after 4 h starvation. The inset illustrates the absence of double-marker-positive autolysosomes. (F) Quantification (mean±s.e.m.) of LAMP1-GFP and mCh-Atg8a colocalization from the experiment shown in E. Pearson's correlation coefficient Rr was calculated using 10 independent samples for each genotype. n=10. ***P<0.001 (Student's t-test). (G) Representative confocal image showing the reduced size of mCh–Atg8a vesicles (gray) in Rab14-depleted (GFP-positive) cells relative to controls under 4-h starvation conditions. The grayscale image on the right shows mCh–Atg8a alone. The cell periphery is outlined. (H) Quantification (mean±s.e.m.) of autophagosome size in control, Rab14-depleted or Rab14-overexpressing cells after 4 h starvation. n≥10 independent images analyzed per genotype. **P<0.05; ***P<0.001, (Student's t-test). In panels B, C, E and G, nuclei are labeled in blue (DAPI staining). Scale bars: 10 µm.
Fig. 6.
Fig. 6.
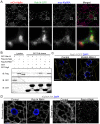
Klp98A interacts with Atg8a and acts upstream of Rab14. (A) Representative confocal image of fat body cells expressing mCh–Atg8a (red) and Rab14–GFP (green) together with tagged Myc–Klp98A (blue). The lower panels show a magnification of the boxed region highlighting colocalization between Myc–Klp98A, mCh–Atg8a and Rab14–GFP. (B) GST pulldown assays from S2 cells transfected with GFP–Rab14, Flag–Klp98A or Flag–Klp98AΔPX and GST–Atg8 showing an interaction of GST–Atg8 with Flag–Klp98A and Flag–Klp98AΔPX, but not with GFP–Rab14. IB, immunoblotting. (C) Representative confocal images showing intracellular localization of Rab14–GFP (grayscale) in 4-h-starved control and Klp98A-depleted cells. The cell outline is shown in yellow. (D) Representative confocal images of Klp98A–HA (grayscale) in control and Rab14-depleted cells after 4 h starvation. Single sections were taken at the nuclear level (proximal plane) and at cell periphery (distal plane). In C,D, nuclei are labeled in blue (DAPI staining). Scale bars: 10 µm.

Comment in

  • Autophagosomes take the Klp98-A train.
    Mauvezin C, Neufeld TP. Mauvezin C, et al. Small GTPases. 2017 Jan 2;8(1):16-19. doi: 10.1080/21541248.2016.1184776. Epub 2016 May 4. Small GTPases. 2017. PMID: 27142690 Free PMC article.

Similar articles

Cited by

References

    1. Arsham A. M. and Neufeld T. P. (2009). A genetic screen in Drosophila reveals novel cytoprotective functions of the autophagy-lysosome pathway. PLoS ONE 4, e6068 10.1371/journal.pone.0006068 - DOI - PMC - PubMed
    1. Batlevi Y., Martin D. N., Pandey U. B., Simon C. R., Powers C. M., Taylor J. P. and Baehrecke E. H. (2010). Dynein light chain 1 is required for autophagy, protein clearance, and cell death in Drosophila. Proc. Natl. Acad. Sci. USA 107, 742-747. 10.1073/pnas.0907967107 - DOI - PMC - PubMed
    1. Bento C. F., Puri C., Moreau K. and Rubinsztein D. C. (2013). The role of membrane-trafficking small GTPases in the regulation of autophagy. J. Cell Sci. 126, 1059-1069. 10.1242/jcs.123075 - DOI - PubMed
    1. Bischof J., Maeda R. K., Hediger M., Karch F. and Basler K. (2007). An optimized transgenesis system for Drosophila using germ-line-specific phiC31 integrases. Proc. Natl. Acad. Sci. USA 104, 3312-3317. 10.1073/pnas.0611511104 - DOI - PMC - PubMed
    1. Bischof J., Bjorklund M., Furger E., Schertel C., Taipale J. and Basler K. (2013). A versatile platform for creating a comprehensive UAS-ORFeome library in Drosophila. Development 140, 2434-2442. 10.1242/dev.088757 - DOI - PubMed

Publication types