

Imaging Transcription: Past, Present, and Future
- PMID: 26763984
- PMCID: PMC4915995
- DOI: 10.1101/sqb.2015.80.027201
Imaging Transcription: Past, Present, and Future
Abstract
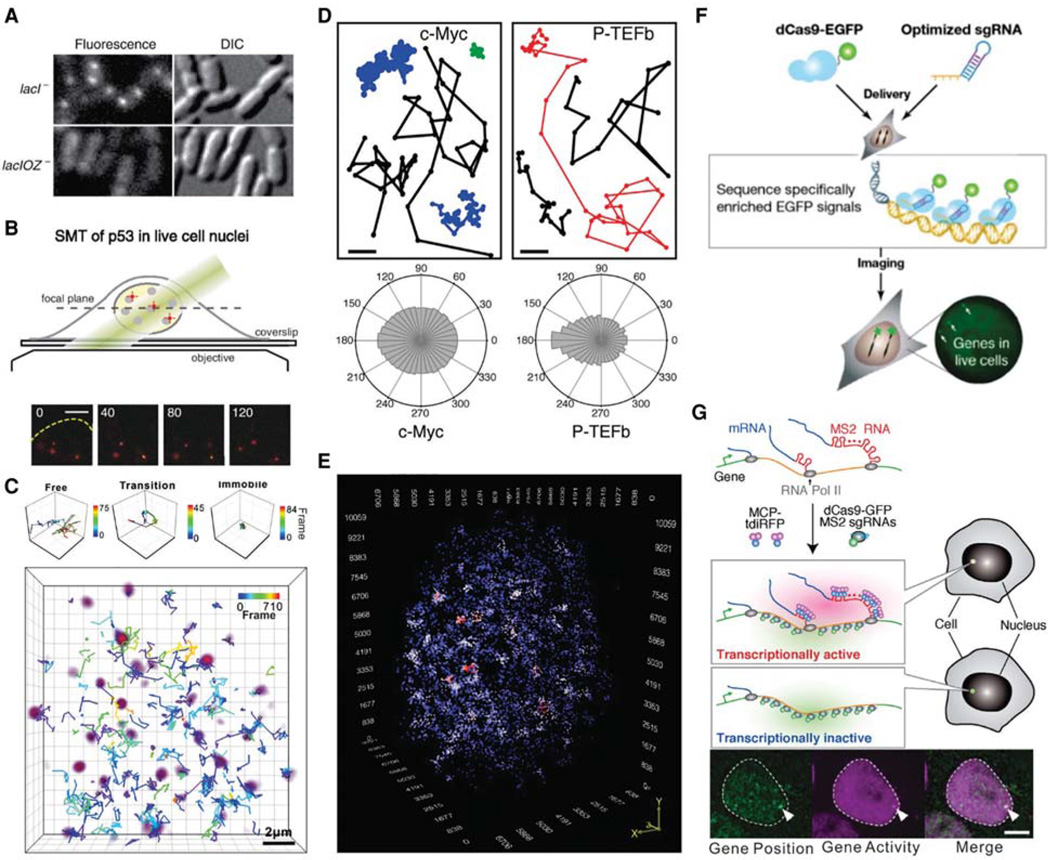
Transcription, the first step of gene expression, is exquisitely regulated in higher eukaryotes to ensure correct development and homeostasis. Traditional biochemical, genetic, and genomic approaches have proved successful at identifying factors, regulatory sequences, and potential pathways that modulate transcription. However, they typically only provide snapshots or population averages of the highly dynamic, stochastic biochemical processes involved in transcriptional regulation. Single-molecule live-cell imaging has, therefore, emerged as a complementary approach capable of circumventing these limitations. By observing sequences of molecular events in real time as they occur in their native context, imaging has the power to derive cause-and-effect relationships and quantitative kinetics to build predictive models of transcription. Ongoing progress in fluorescence imaging technology has brought new microscopes and labeling technologies that now make it possible to visualize and quantify the transcription process with single-molecule resolution in living cells and animals. Here we provide an overview of the evolution and current state of transcription imaging technologies. We discuss some of the important concepts they uncovered and present possible future developments that might solve long-standing questions in transcriptional regulation.
Copyright © 2015 Cold Spring Harbor Laboratory Press; all rights reserved.
Figures
Similar articles
-
RNA voyeurism: A coming of age story.Methods. 2016 Apr 1;98:10-17. doi: 10.1016/j.ymeth.2015.11.024. Epub 2015 Nov 27. Methods. 2016. PMID: 26638774 Review.
-
Combining protein and mRNA quantification to decipher transcriptional regulation.Nat Methods. 2015 Aug;12(8):739-42. doi: 10.1038/nmeth.3446. Epub 2015 Jun 22. Nat Methods. 2015. PMID: 26098021 Free PMC article.
-
Stochastic models of transcription: from single molecules to single cells.Methods. 2013 Jul 15;62(1):13-25. doi: 10.1016/j.ymeth.2013.03.026. Epub 2013 Apr 1. Methods. 2013. PMID: 23557991
-
A Growing Toolbox to Image Gene Expression in Single Cells: Sensitive Approaches for Demanding Challenges.Mol Cell. 2018 Aug 2;71(3):468-480. doi: 10.1016/j.molcel.2018.07.022. Mol Cell. 2018. PMID: 30075145 Review.
-
Single-Cell and Single-Molecule Analysis of Gene Expression Regulation.Annu Rev Genet. 2016 Nov 23;50:267-291. doi: 10.1146/annurev-genet-120215-034854. Annu Rev Genet. 2016. PMID: 27893965 Free PMC article. Review.
Cited by
-
Quantitative imaging of mammalian transcriptional dynamics: from single cells to whole embryos.BMC Biol. 2016 Dec 23;14(1):115. doi: 10.1186/s12915-016-0331-9. BMC Biol. 2016. PMID: 28010727 Free PMC article. Review.
-
Toward mapping the human body at a cellular resolution.Mol Biol Cell. 2018 Aug 1;29(15):1779-1785. doi: 10.1091/mbc.E18-04-0260. Mol Biol Cell. 2018. PMID: 30058989 Free PMC article. Review.
-
Dynamic enhancer function in the chromatin context.Wiley Interdiscip Rev Syst Biol Med. 2018 Jan;10(1):10.1002/wsbm.1390. doi: 10.1002/wsbm.1390. Epub 2017 May 22. Wiley Interdiscip Rev Syst Biol Med. 2018. PMID: 28544514 Free PMC article. Review.
-
Monitoring Tissue Regeneration at Single-Cell Resolution.Cell Stem Cell. 2016 Oct 6;19(4):428-431. doi: 10.1016/j.stem.2016.09.007. Cell Stem Cell. 2016. PMID: 27716522 Free PMC article.
-
Live-cell single-molecule tracking reveals co-recognition of H3K27me3 and DNA targets polycomb Cbx7-PRC1 to chromatin.Elife. 2016 Oct 10;5:e17667. doi: 10.7554/eLife.17667. Elife. 2016. PMID: 27723458 Free PMC article.
References
-
- Bickmore WA. The spatial organization of the human genome. Annu Rev Genomics Hum Genet. 2013;14:67–84. - PubMed
Publication types
MeSH terms
Substances
Grants and funding
LinkOut - more resources
Full Text Sources
Other Literature Sources
Miscellaneous