. 2016 Feb 16;86(7):643-50.
doi: 10.1212/WNL.0000000000002374. Epub 2016 Jan 13.

Whole-brain MRI phenotyping in dysplasia-related frontal lobe epilepsy

Affiliations

Whole-brain MRI phenotyping in dysplasia-related frontal lobe epilepsy

Seok-Jun Hong et al. Neurology. .

Abstract

Objective: To perform whole-brain morphometry in patients with frontal lobe epilepsy and evaluate the utility of group-level patterns for individualized diagnosis and prognosis.

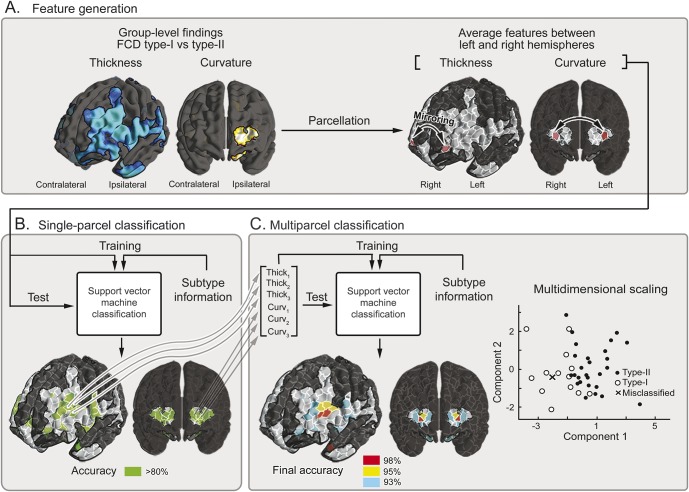
Methods: We compared MRI-based cortical thickness and folding complexity between 2 frontal lobe epilepsy cohorts with histologically verified focal cortical dysplasia (FCD) (13 type I; 28 type II) and 41 closely matched controls. Pattern learning algorithms evaluated the utility of group-level findings to predict histologic FCD subtype, the side of the seizure focus, and postsurgical seizure outcome in single individuals.

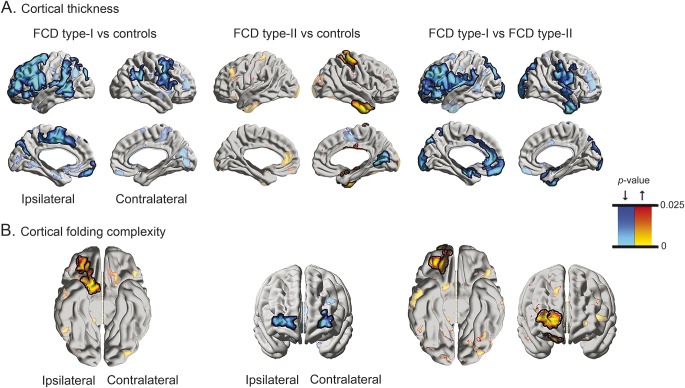
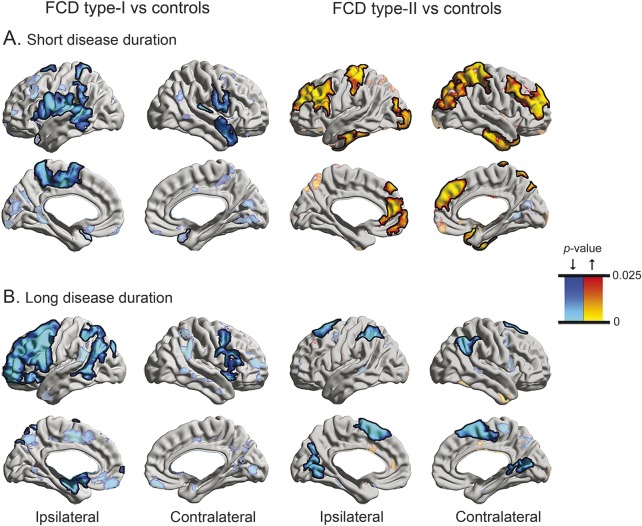
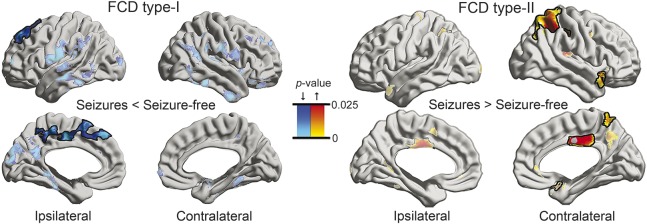
Results: Relative to controls, FCD type I displayed multilobar cortical thinning that was most marked in ipsilateral frontal cortices. Conversely, type II showed thickening in temporal and postcentral cortices. Cortical folding also diverged, with increased complexity in prefrontal cortices in type I and decreases in type II. Group-level findings successfully guided automated FCD subtype classification (type I: 100%; type II: 96%), seizure focus lateralization (type I: 92%; type II: 86%), and outcome prediction (type I: 92%; type II: 82%).

Conclusion: FCD subtypes relate to diverse whole-brain structural phenotypes. While cortical thickening in type II may indicate delayed pruning, a thin cortex in type I likely results from combined effects of seizure excitotoxicity and the primary malformation. Group-level patterns have a high translational value in guiding individualized diagnostics.


Figures

Figure 1
Figure 1. Group-level alterations in cortical thickness (A) and folding complexity (B) in patients with FCD
In A and B, the left panels show comparison between FCD type I and healthy controls; the middle panels between type II and controls; and the right panels show the direct contrast between both FCD cohorts. Increases/decreases are shown in red/blue. Significant clusters, corrected for multiple comparisons using random field theory at pFWE < 0.05, are shown in solid colors and outlined in black; trends are shown in semitransparent. FCD = focal cortical dysplasia.
Figure 2
Figure 2. Duration-stratified analysis of cortical thickness
Each patient cohort was split into short (A) and long (B) duration subgroups according to its respective median (FCD type I/type II: 14/21 years) and compared with controls. Thickness increases/decreases are shown in red/blue. See figure 1 for details on statistical procedures. FCD = focal cortical dysplasia.
Figure 3
Figure 3. Morphologic markers of postsurgical seizure outcome
Cortical thickness comparison between seizure-free (Engel Class I) and non–seizure-free patients (Classes II–IV). See figure 1 for details on statistical procedures. Given the small number of seizure-free patients (n = 3) in type I, findings were cross-validated using nonparametric permutation tests, both for group comparison and family-wise error correction. FCD = focal cortical dysplasia.
Figure 4
Figure 4. Machine-learning framework applied to FCD subtype prediction
(A) Feature generation. Each hemisphere was subdivided into 500 equally sized parcels. The search space was confined to significant clusters of group-level differences (i.e., FCD type I vs type II). After mirroring each parcel to both left and right hemispheres, we generated a feature vector by extracting mean thickness and curvature z scores. (B) Single-parcel classification. Features obtained in panel A were fed to a support vector machine classifier, which evaluated subtype prediction performance at each pair of parcels. (C) Multiparcel classification. To optimize sensitivity, among parcels achieving >80% accuracy in panel B (color-coded in green), combinations of k pairs of parcels (optimal k empirically set at 3) were fed to a separate classifier. Multidimensional scaling allows reducing dimensionality to 2 dimensions while preserving interfeature distances. Misclassified cases are highlighted with an x. Steps A through C are performed in a leave-one-out framework that allows determining prediction accuracy for previously unseen cases. FCD = focal cortical dysplasia.

Comment in

References

    1. Lerner JT, Salamon N, Hauptman JS, et al. Assessment and surgical outcomes for mild type I and severe type II cortical dysplasia: a critical review and the UCLA experience. Epilepsia 2009;50:1310–1335. - PubMed
    1. Blumcke I, Thom M, Aronica E, et al. The clinicopathologic spectrum of focal cortical dysplasias: a consensus classification proposed by an ad hoc Task Force of the ILAE Diagnostic Methods Commission. Epilepsia 2011;52:158–174. - PMC - PubMed
    1. Sisodiya SM, Fauser S, Cross JH, Thom M. Focal cortical dysplasia type II: biological features and clinical perspectives. Lancet Neurol 2009;8:830–843. - PubMed
    1. Hong SJ, Kim H, Schrader D, Bernasconi N, Bernhardt BC, Bernasconi A. Automated detection of cortical dysplasia type II in MRI-negative epilepsy. Neurology 2014;83:48–55. - PMC - PubMed
    1. Fonseca Vde C, Yasuda CL, Tedeschi GG, Betting LE, Cendes F. White matter abnormalities in patients with focal cortical dysplasia revealed by diffusion tensor imaging analysis in a voxelwise approach. Front Neurol 2012;3:121. - PMC - PubMed

Publication types

MeSH terms

LinkOut - more resources