. 2016 Feb 15;196(4):1568-78.
doi: 10.4049/jimmunol.1501739. Epub 2016 Jan 13.

Memory Stem T Cells in Autoimmune Disease: High Frequency of Circulating CD8+ Memory Stem Cells in Acquired Aplastic Anemia

Affiliations

Memory Stem T Cells in Autoimmune Disease: High Frequency of Circulating CD8+ Memory Stem Cells in Acquired Aplastic Anemia

Kohei Hosokawa et al. J Immunol. .

Abstract

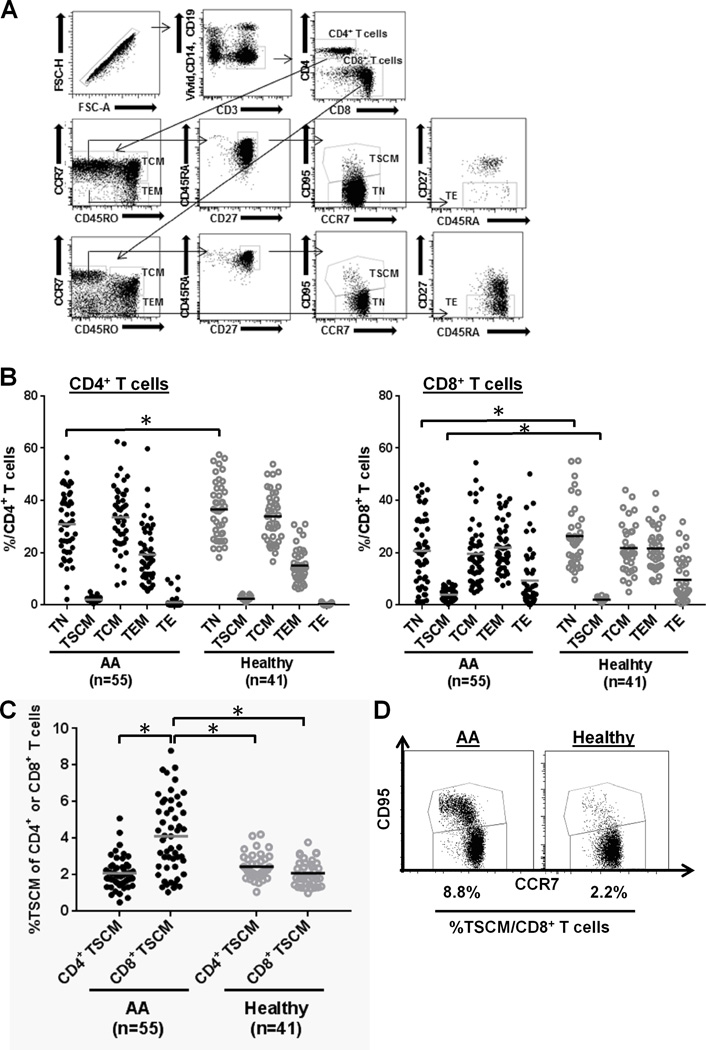
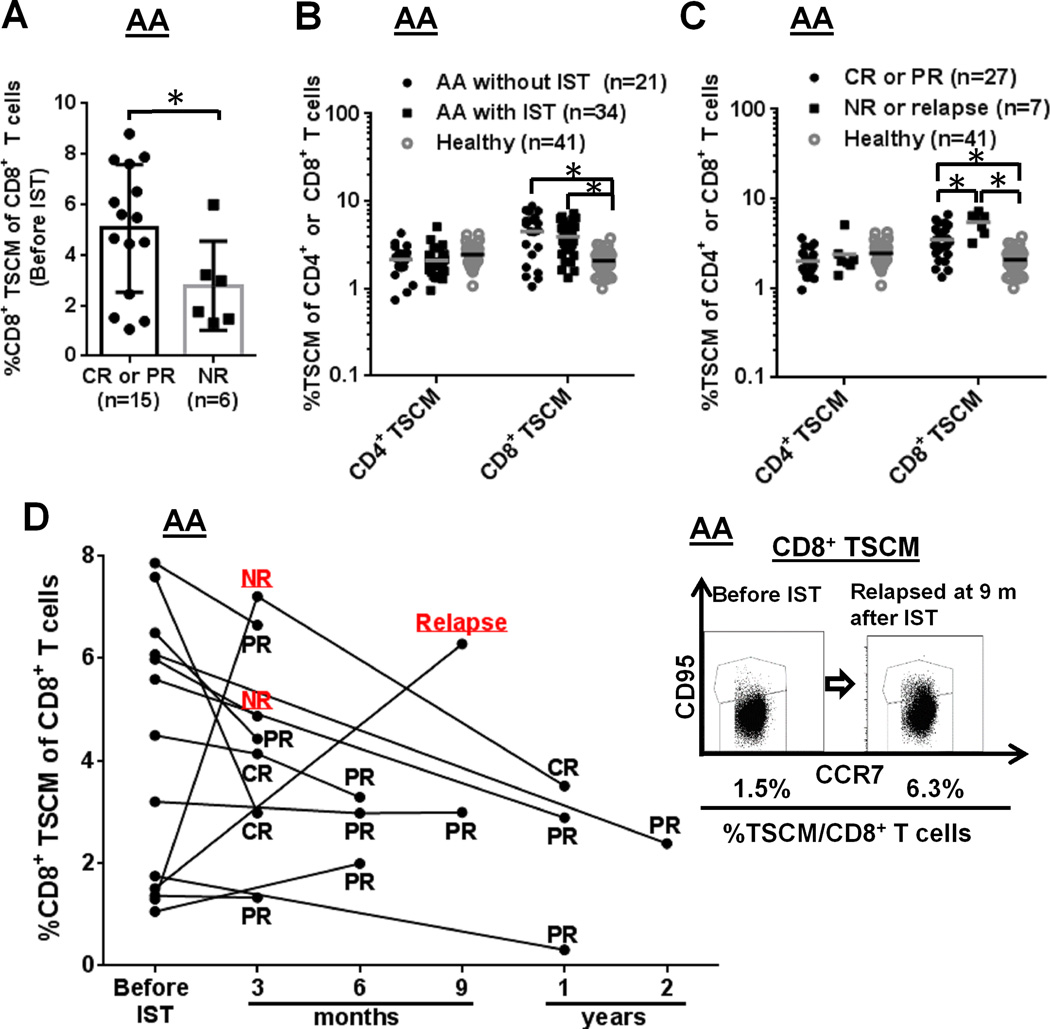
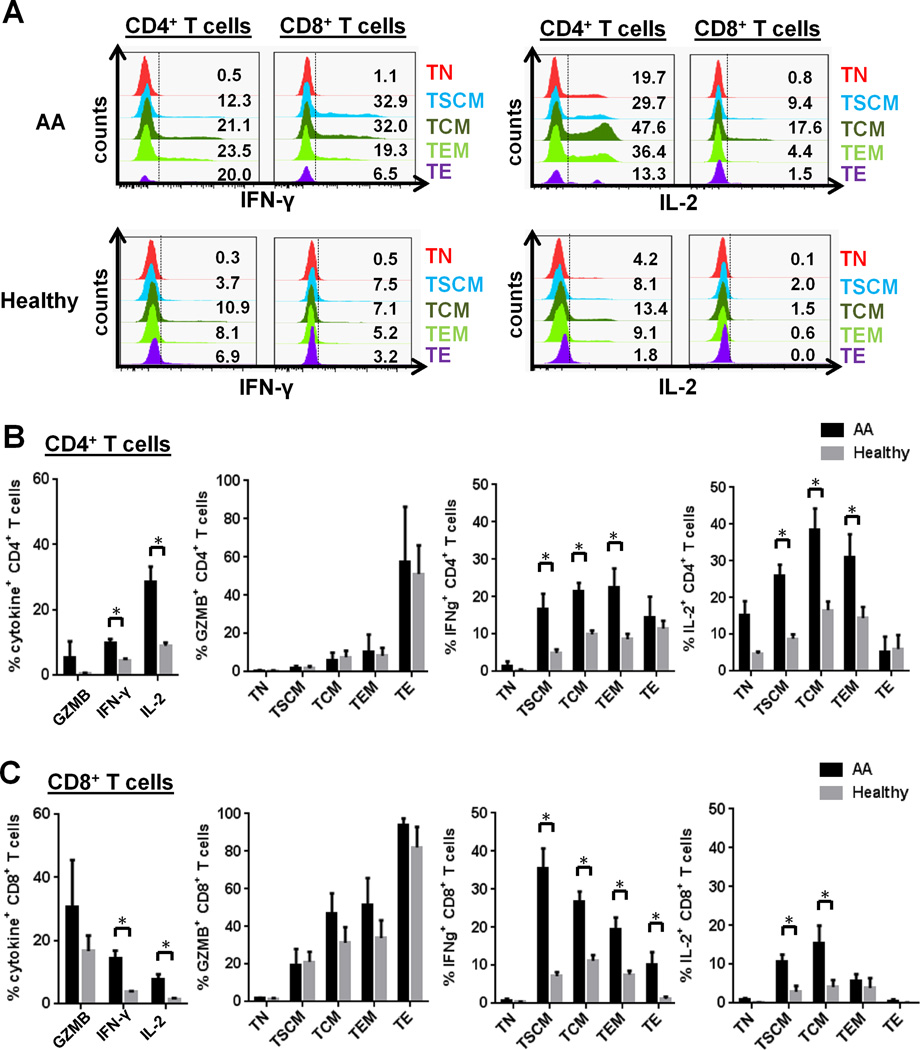
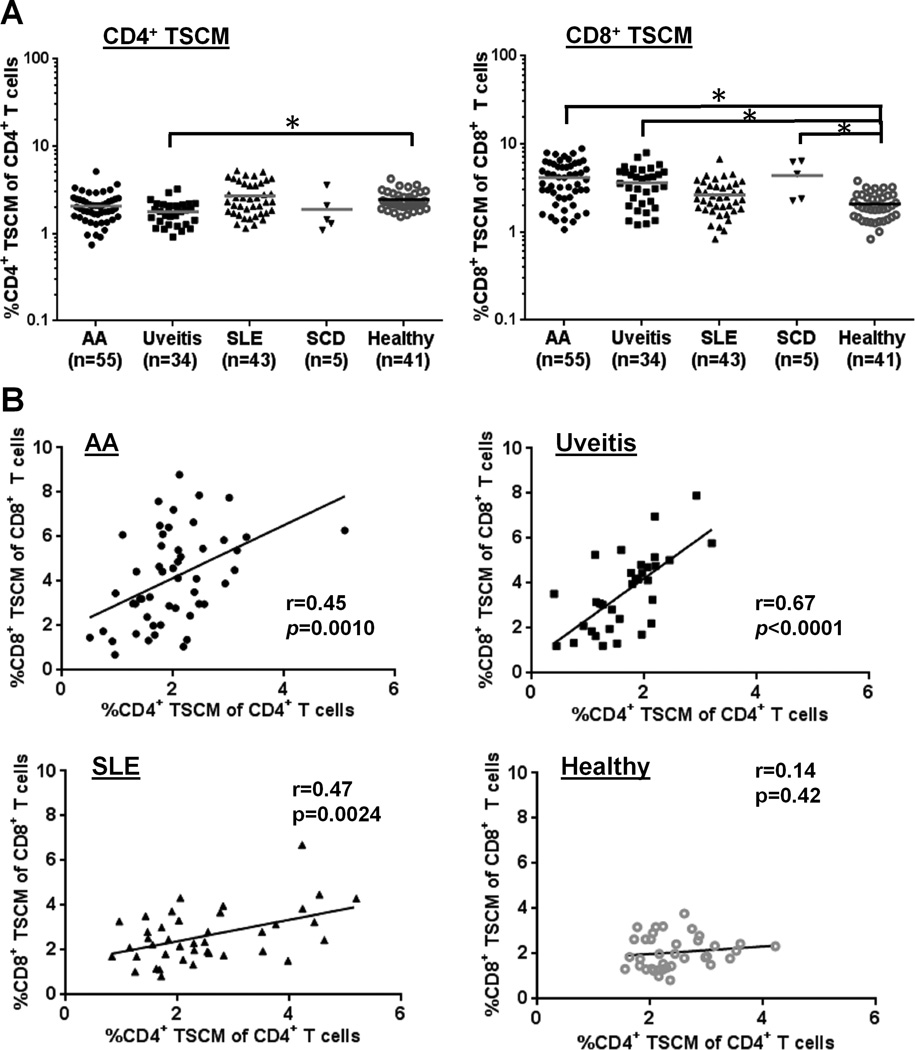
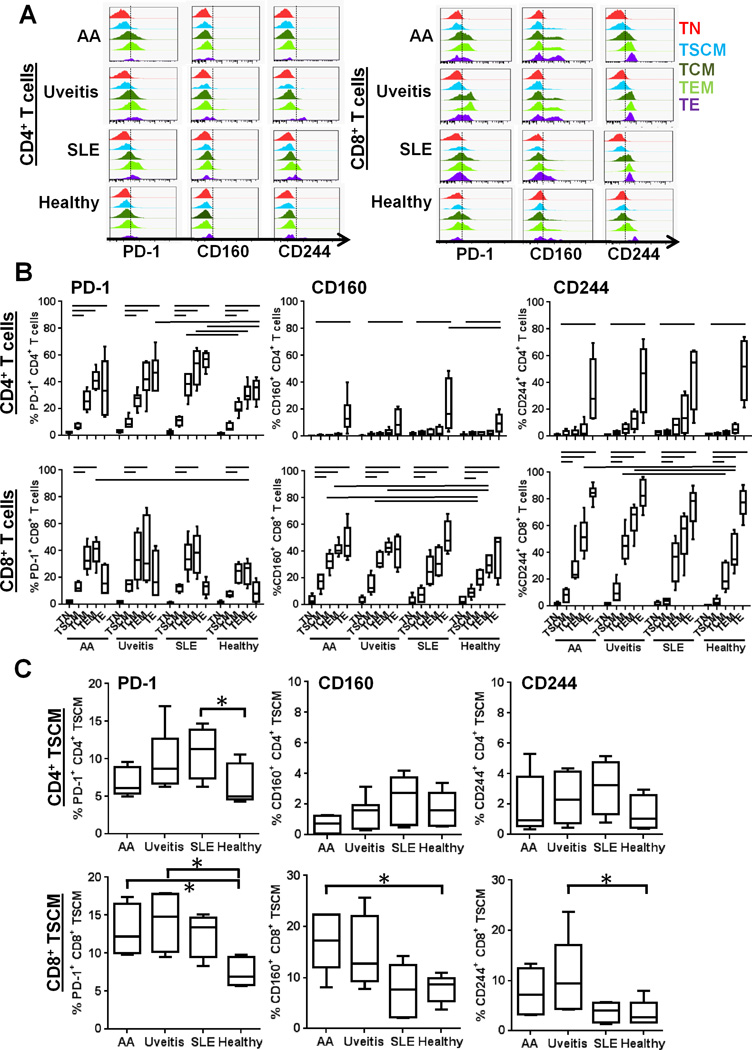
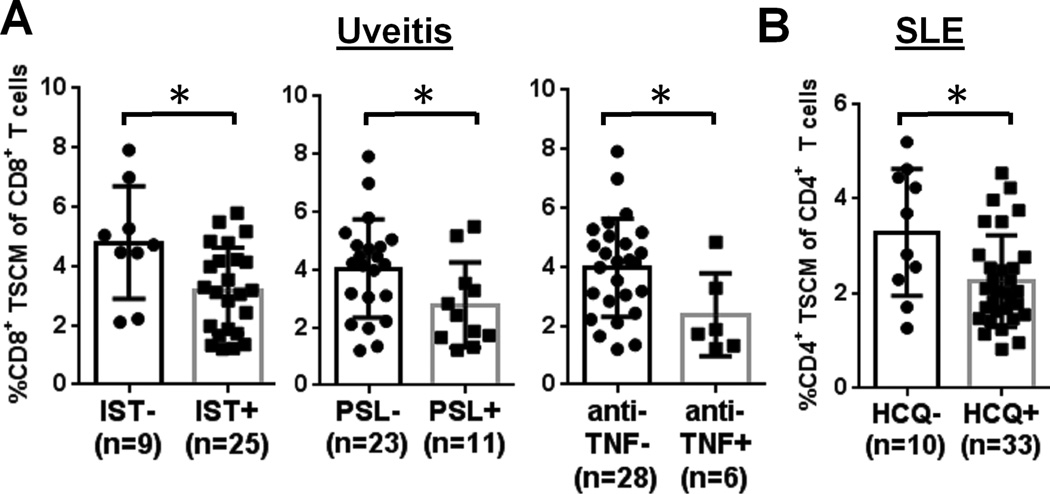
Memory stem T cells (TSCMs) constitute a long-lived, self-renewing lymphocyte population essential for the maintenance of functional immunity. Hallmarks of autoimmune disease pathogenesis are abnormal CD4(+) and CD8(+) T cell activation. We investigated the TSCM subset in 55, 34, 43, and 5 patients with acquired aplastic anemia (AA), autoimmune uveitis, systemic lupus erythematosus, and sickle cell disease, respectively, as well as in 41 age-matched healthy controls. CD8(+) TSCM frequency was significantly increased in AA compared with healthy controls. An increased CD8(+) TSCM frequency at diagnosis was associated with responsiveness to immunosuppressive therapy, and an elevated CD8(+) TSCM population after immunosuppressive therapy correlated with treatment failure or relapse in AA patients. IFN-γ and IL-2 production was significantly increased in various CD8(+) and CD4(+) T cell subsets in AA patients, including CD8(+) and CD4(+) TSCMs. CD8(+) TSCM frequency was also increased in patients with autoimmune uveitis or sickle cell disease. A positive correlation between CD4(+) and CD8(+) TSCM frequencies was found in AA, autoimmune uveitis, and systemic lupus erythematosus. Evaluation of PD-1, CD160, and CD244 expression revealed that TSCMs were less exhausted compared with other types of memory T cells. Our results suggest that the CD8(+) TSCM subset is a novel biomarker and a potential therapeutic target for AA.


Conflict of interest statement

Disclosures

The authors declare no conflict of interest.

Figures

FIGURE 1
FIGURE 1
The increased CD8+ TSCM population in AA patients. (A) Gating strategy for T cell subsets. PBMCs were stained with ViViD, anti-CD14-Pacific Blue, anti-CD19-Pacific Blue, anti-CD3-BV605, anti-CD4-V500, anti-CD8-APC-H7, anti-CD45RA-PE-Cy7, anti-CD45RO-APC, anti-CCR7-AF700, anti-CD27-PC5, and anti-CD95-PE. Lymphocytes or single lymphocytes were gated based on their scatter characteristics or forward scatter height vs. forward scatter area, respectively. Live T cells were gated based on positive for CD3 and negative for ViViD, CD14, and CD19 to remove dead cells, monocytes, and B cells. CD4+ and CD8+ T cells were then gated based on the characteristic expression patterns of CCR7 and CD45RO. ViViD CD3+ CD4 (CD8)+ CD45RO CD45RA+ CCR7+ CD27+ CD95 TN, ViViD CD3+ CD4 (CD8)+ CD45RO CD45RA+ CCR7+ CD27+ CD95+ TSCM, ViViDCD3+ CD4 (CD8)+ CD45RO+ CCR7+ TCM, ViViD CD3+ CD4 (CD8)+ CD45RO+ CCR7 TEM, and ViViD CD3+ CD4 (CD8)+ CD45RO CD45RA+ CCR7 CD27 TE were identified. (B) Frequency of each CD4+ or CD8+ T cell subset (TN, TSCM, TCM, TEM, or TE) was compared between AA (n = 55) and healthy control (n = 41) groups. *p < .05 (Student's t-test). (C) Frequencies of CD4+ and CD8+ TSCM populations were compared within the same group [AA (n = 55) or healthy control group (n = 41)] or between the two groups. *p < .05 (Student's t-test). (D) Representative flow cytometry dot plots illustrate the increased CD8+ TSCM population in an AA patient (left panel), relative to a healthy individual (right panel).
FIGURE 2
FIGURE 2
Clinical correlations with the TSCM populations in AA patients. (A) CD8+ TSCM frequency in AA patients was measured at diagnosis (Y axis) and then examined IST-response at 3 months post-IST (X axis): CR and PR patients were combined into one group, and NR patients into the other group. *p < .05 (Student's t-test). (B) CD4+ or CD8+ TSCM frequency was compared among three groups [AA patients without IST (n = 21) and with IST (n = 34), and healthy controls (n = 41)]. (C) Frequency comparison of CD4+ or CD8+ TSCM was performed among three groups: CR or PR after IST (n = 27), NR or relapse after IST (n = 7), and healthy controls (n = 41). (D) CD8+ TSCM frequency was measured at diagnosis and then after IST at different time points in the same 13 AA cases. Representative flow cytometry dot plots depict CD8+ TSCM frequency in one AA patient at diagnosis and relapse at 9 months after IST. *p < .05
FIGURE 3
FIGURE 3
Cytokine production in CD4+ and CD8+ TSCM populations in AA patients. Cytokine production (GZMB, IFN-γ, and IL-2) was induced by in vitro stimulation with anti-CD3/CD28 beads, followed by immunostaining for intracellular cytokines. (A) Representative histograms showing cytokine production (IFN-γ and IL-2) of CD4+ and CD8+ T cell subsets in AA patients and healthy controls. A percentage of cytokine (GZMB, IFN-γ, or IL-2)-producing CD4+ (B) or CD8+ (C) T cell subset was compared between AA patients at diagnosis (n = 4) and healthy controls (n = 5). * p < 0.05.
FIGURE 4
FIGURE 4
Comparison of CD4+ or CD8+ TSCM populations within AA, uveitis, SLE, or SCD cohort. (A) CD4+ or CD8+ TSCM frequency was compared among AA (n = 55), uveitis (n = 34), SLE (n = 43), SCD (n = 5), and healthy control (n = 41) cohorts. * p < 0.05. (B) results of correlation Spearman rank tests in which CD4+ TSCM frequency was compared with CD8+ TSCM frequency within the same group (AA, uveitis, SLE, or healthy control groups). * p < 0.05; r, a correlation coefficient value.
FIGURE 5
FIGURE 5. Inhibitory receptor expression on T cell subsets
(A) Representative histograms of inhibitory receptor (PD-1, CD160 and CD244) expression of CD4+ and CD8+ T cell subsets in AA, uveitis, SLE patients, and healthy controls. (B) Surface inhibitory receptor (PD-1, CD160, and CD244) expression levels on CD4+ and CD8+ T cell subsets were analyzed in AA (n = 16), uveitis (n = 15), SLE (n = 22), and healthy control (n = 9) groups and compared within the same groups or between each patient and control groups. Horizontal lines indicate the statistically significant changes. (p < 0.05). (C) PD-1, CD160, and CD244 expression of CD4+ and CD8+ TSCM are plotted using a small scale range to highlight differences of their values. They were compared between each patient and control groups. Boxes represent median and 25th and 75th percentiles; and whiskers represent 10th and 90th percentiles. * p < 0.05.
FIGURE 6
FIGURE 6
Clinical correlations with the TSCM populations in uveitis and SLE patients. (A) Frequency of CD8+ TSCM in uveitis (n = 34) are compared between the following two groups: with and without immune therapies (including one drug alone or any combination of drugs); with and without PSL (PSL alone or PSL plus any other drugs); and with and without anti-TNF (anti-TNF alone or anti-TNF plus any other drugs). (B) CD4+ TSCM frequency in SLE (n = 43) was compared between two cohorts: with and without HCQ (HCQ alone or HCQ plus any other drugs). * p < 0.05.

References

    1. Young NS, Calado RT, Scheinberg P. Current concepts in the pathophysiology and treatment of aplastic anemia. Blood. 2006;108:2509–2519. - PMC - PubMed
    1. Scheinberg P, Young NS. How I treat acquired aplastic anemia. Blood. 2012;120:1185–1196. - PMC - PubMed
    1. Risitano AM, Kook H, Zeng W, Chen G, Young NS, Maciejewski JP. Oligoclonal and polyclonal CD4 and CD8 lymphocytes in aplastic anemia and paroxysmal nocturnal hemoglobinuria measured by V beta CDR3 spectratyping and flow cytometry. Blood. 2002;100:178–183. - PubMed
    1. Nakao S, Takami A, Takamatsu H, Zeng W, Sugimori N, Yamazaki H, Miura Y, Ueda M, Shiobara S, Yoshioka T, Kaneshige T, Yasukawa M, Matsuda T. Isolation of a T-cell clone showing HLA-DRB1*0405-restricted cytotoxicity for hematopoietic cells in a patient with aplastic anemia. Blood. 1997;89:3691–3699. - PubMed
    1. Sloand E, Kim S, Maciejewski JP, Tisdale J, Follmann D, Young NS. Intracellular interferon-gamma in circulating and marrow T cells detected by flow cytometry and the response to immunosuppressive therapy in patients with aplastic anemia. Blood. 2002;100:1185–1191. - PubMed

Publication types

MeSH terms