. 2016 Feb 15;410(2):150-163.
doi: 10.1016/j.ydbio.2015.12.027. Epub 2016 Jan 5.

FGFR and PTEN signaling interact during lens development to regulate cell survival

Affiliations

FGFR and PTEN signaling interact during lens development to regulate cell survival

Blake R Chaffee et al. Dev Biol. .

Abstract

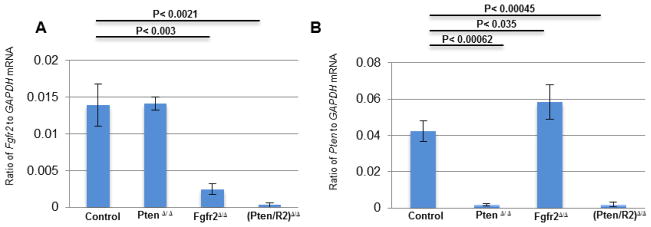
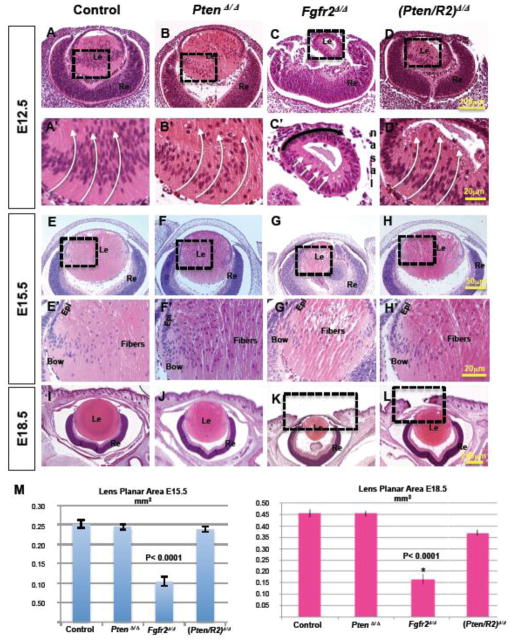
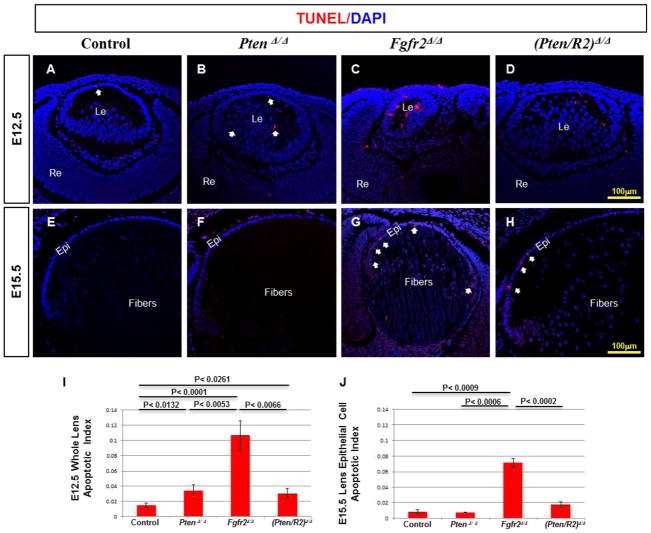
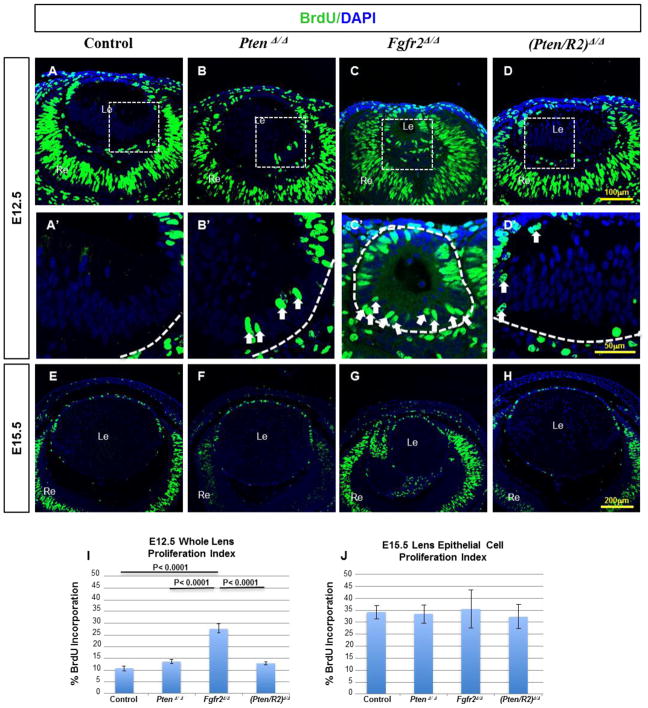
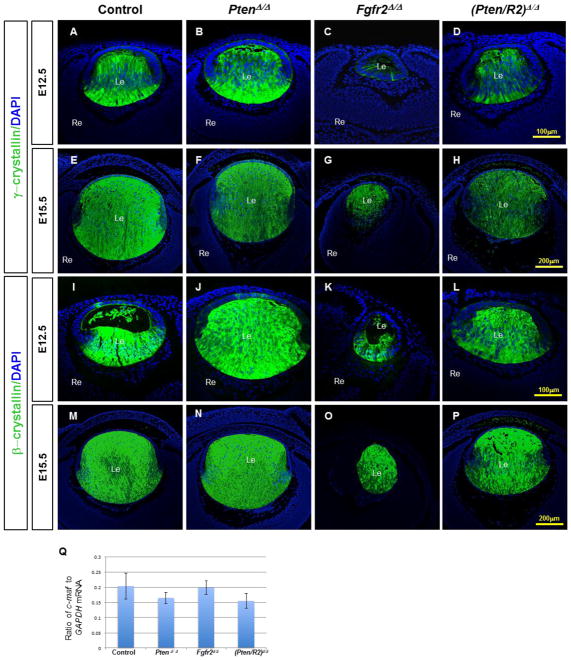
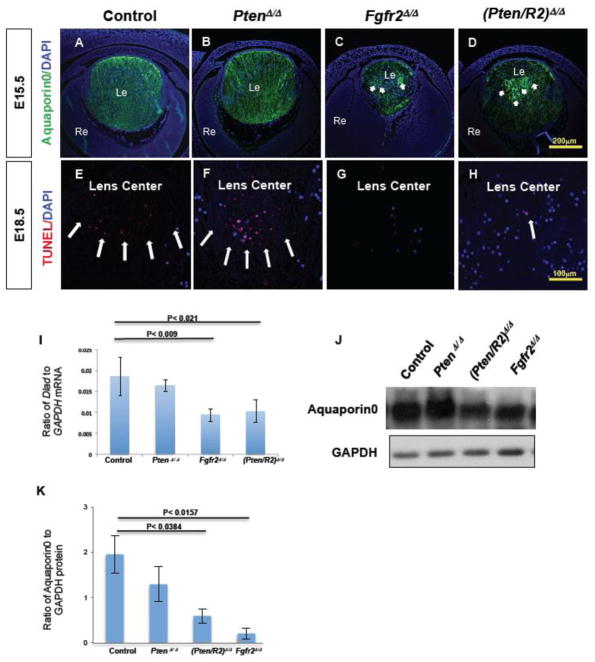
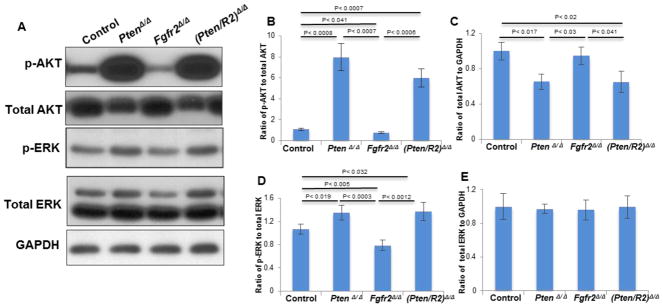
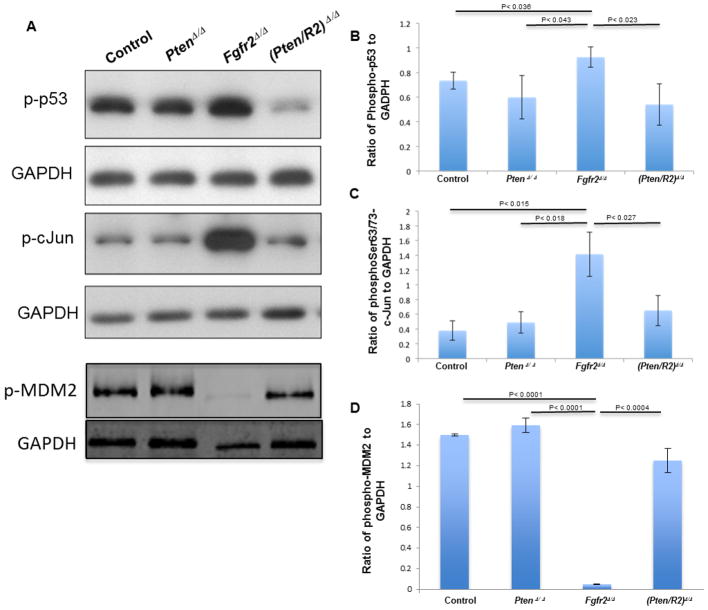
Lens epithelial cells express many receptor tyrosine kinases (RTKs) that stimulate PI3K-AKT and RAS-RAF-MEK-ERK intracellular signaling pathways. These pathways ultimately activate the phosphorylation of key cellular transcription factors and other proteins that control proliferation, survival, metabolism, and differentiation in virtually all cells. Among RTKs in the lens, only stimulation of fibroblast growth factor receptors (FGFRs) elicits a lens epithelial cell to fiber cell differentiation response in mammals. Moreover, although the lens expresses three different Fgfr genes, the isolated removal of Fgfr2 at the lens placode stage inhibits both lens cell survival and fiber cell differentiation. Phosphatase and tensin homolog (PTEN), commonly known as a tumor suppressor, inhibits ERK and AKT activation and initiates both apoptotic pathways, and cell cycle arrest. Here, we show that the combined deletion of Fgfr2 and Pten rescues the cell death phenotype associated with Fgfr2 loss alone. Additionally, Pten removal increased AKT and ERK activation, above the levels of controls, in the presence or absence of Fgfr2. However, isolated deletion of Pten failed to stimulate ectopic fiber cell differentiation, and the combined deletion of Pten and Fgfr2 failed to restore differentiation-specific Aquaporin0 and DnaseIIβ expression in the lens fiber cells.

Keywords: Differentiation; FGF Receptor; Lens; PTEN; Survival.


Figures

Figure 1
Figure 1. Le-Cre efficiently deletes LoxP-flanked Pten and Fgfr2
RT-qPCR was used to detect Fgfr2 (A) and Pten (B) expression in E15.5 Le-Cre negative (Control), PtenΔ/Δ Fgfr2Δ/Δ, and (Pten/R2)Δ/Δ lenses to determine the efficiency of the deletion of LoxP-flanked alleles. Lenses with LoxP-flanked Pten and the Le-Cre transgene (PtenΔ/Δ) displayed similar expression levels of Fgfr2 transcript as control lenses, but expressed very little Pten transcript. LoxP-Flanked Fgfr2 lenses containing the Le-Cre transgene (Fgfr2Δ/Δ) displayed a significant reduction in Fgfr2 transcripts and a significant increase in Pten transcripts. Lenses containing both LoxP -flanked Pten and Fgfr2 and the Le-Cre transgene (Pten/R2)Δ/Δ contained almost no Fgfr2 or Pten transcripts. Error bars represent standard error of the mean (s.e.m.) with significance level indicated above the relevant bars.
Figure 2
Figure 2. Pten deletion rescues the lens size and elongation defects in Fgfr2Δ/Δ lenses
Hematoxylin and Eosin staining was implemented to analyze the morphology and size of the four different genotypes being compared, Cre-negative controls (A, A’, E, E’, I); PtenΔ/Δ (B, B’, F, F’ J); Fgfr2Δ/Δ (C, C’, G, G’ K); and (Pten/R2)Δ/Δ (D, D’, H, H’ L) at E12.5 (A–D, A’–D’), E15.5 (E–H, E’–H’), and E18.5 (I–L). A’–D’ and E’–H’ are higher magnifications of the boxed in regions of A–D and E-H respectively. Lens planar area measurements in mm2 were taken using a Nikon TI-80 microscope in conjunction with their advanced research software at E15.5 and E18.5 (M). At E12.5 the posterior cells of Fgfr2Δ/Δ lenses did not elongate (compare C to A, C’ to A’-white arrows). Deleting Pten restored the fiber cell elongation phenotype displayed in FGFR2-deficient lenses (compare D to C, D’ to C’-white arrows). At E15.5 and E18.5 Fgfr2Δ/Δ lenses were significantly smaller than control lenses (compare G to E, K to I, M). Pten deletion rescued lens size in FGFR2-deficient lenses at E15.5 and E18.5 (compare H to G, L to K), but did not restore the eyelid closure phenotype present in FGFR2-deficient lenses (compare boxed regions in L and K to I). Pten deletion, by itself, did not visibly alter the size or morphology of the lens at any of the 3 stages compared (compare B, B’, F, F’ J to A, A’ E, E’, I, M). Errors bars on the graphs represent s.e.m, with each bar representing a minimum of 9 measurements (3 sections from the lens center of 3 different embryos). Scale bars: 100μm in AD; 20 μm in A’–D’ and E’–H’; 50 μm in E’H; 200 μm in (I–L).
Figure 3
Figure 3. Pten deletion restores lens cell survival in FGFR2-deficient lenses
TUNEL analysis was implemented on E12.5 (A–D) and E15.5 (E–H) lenses comparing Cre-negative controls (A, E), PtenΔ/Δ (B, F) Fgfr2Δ/Δ (C, G), and (Pten/R2)Δ/Δ (D, H). I and J represent the apoptotic index at E12.5 and E15.5, respectively. At E12.5, the apoptotic index was calculated for the entire lens due to the apoptosis detected in both posterior and anterior lens cells, whereas the apoptotic index was only calculated for the epithelial cell layer at E15.5 as apoptosis was only detected in the epithelium. At E12.5 and E15.5 Fgfr2Δ/Δ lenses displayed a significant increase in TUNEL positive cells as compared to control lenses (compare C to A, G to E, I), although the apoptotic index was higher at E12.5 than E15.5 (compare C to G). At both E12.5 and E15.5 deleting Pten rescued the cell survival phenotype associated with FGFR2 loss (compare D to C, H to G, I, J). Despite the rescue of apoptosis when Fgfr2Δ/Δ lenses are compared to (Pten/R2)Δ/Δ lenses, (Pten/R2)Δ/Δ lenses continued to exhibit higher levels of apoptosis at E12.5 and E15.5 (compare D to A, H to E, I, J). Moreover, the apoptotic index in PtenΔ/Δ lenses was increased at E12.5 in comparison to control lenses (compare B to A-white arrows; I). Errors bars on the graphs represent s.e.m, with each bar representing a minimum of 9 measurements (3 sections from the lens center of 3 different embryos). Scale bars: 100μm in AH. White arrows point to TUNEL positive foci.
Figure 4
Figure 4. Cell cycle analysis in PtenΔ/Δ, Fgfr2Δ/Δ, and (Pten/R2)Δ/Δ lenses
BrdU incorporation assay was used on Cre-negative controls (A, A’, E), PtenΔ/Δ (B, B’, F) Fgfr2Δ/Δ (C, C’, G), and (Pten/R2)Δ/Δ (D, D’, H) to assess the impact of deleting Pten, Fgfr2, and the combination of the two on lens epithelial cell proliferation and cell cycle withdrawal. By E12.5, control lenses failed to exhibit any BrdU incorporation in the differentiating fiber cells (A, A’). E12.5 PtenΔ/Δ (B, B’) ,Fgfr2Δ/ Δ (C, C’), and (Pten/R2)Δ/Δ (D, D’) lenses displayed BrdU incorporation of nuclei in the fiber cell mass, although Fgfr2Δ/Δ lenses contained the most proliferation in posterior lens cells (compare C’ to B’ and D’). Furthermore, overall proliferation was increased in E12.5 Fgfr2Δ/Δ lenses, yet was not significantly increased in PtenΔ/Δ or (Pten/R2)Δ/Δ lenses at this stage (I). By E15.5 (E–H, J) lens epithelial proliferation was not altered in PtenΔ/Δ (F, J) Fgfr2Δ/Δ (G, J), or (Pten/R2)Δ/Δ (H, J). A’–D’ represent boxed regions of A–D selected for higher magnification. Dashed white lines outline the edges of the lens and white arrows point towards posterior lens cells remaining prolific (A’–D’). Errors bars on the graphs represent s.e.m, with each bar representing a minimum of 9 measurements (3 sections from the lens center of 3 different embryos). Scale bars: 100 μm in A–D; 50 μm in A’–D’; 200 μm in E–H.
Figure 5
Figure 5. Pten deletion restores decreased β- and γ-crystallin expression to the FGFR2- deficient lenses at E12.5
Cre-negative control (A, E, I, M), PtenΔ/Δ (B, F, J, N) , Fgfr2Δ/Δ (C, G, K, O) , and (Pten/R2)Δ/Δ (D, H, L, P) lenses were analyzed by immunohistochemistry at E12.5 (A–D, I–L), and E15.5 (E–H, M–P), to determine the expression of γ-crystallin (A–H) and β-crystallin (I–P). At E12.5 γ-crystallin was present in very few posterior cells of Fgfr2Δ/Δ lenses (compare C to A). E12.5 (Pten/R2)Δ/Δ lenses displayed an increase in γ-crystallin expression relative to Fgfr2Δ/Δ lenses (compare D to C), but remained reduced in comparison to control lenses (compare D to A). By E15.5, Fgfr2Δ/Δ lenses expressed γ-crystallin protein in all fiber cells (compare G to C). c-Maf transcript levels were not reduced in either Fgfr2Δ/Δ or (Pten/R2)Δ/Δ lenses (Q). Isolated Pten deletion did not alter γ-crystallin protein at E12.5 (compare B to A), or E15.5 (compare F to E). The quantification of c-Maf (Q) was standardized to Gapdh mRNA. Errors bars on the graphs represent s.e.m, with each bar representing a minimum of 9 measurements (3 sections from the lens center of 3 different embryos). Scale bars: 100 μm in A–D, I–L; 200 μm in E–H, M–P.
Figure 6
Figure 6. Fgfr2Δ/Δ lenses exhibit reduced Aquaporin0 expression and a nuclear retention phenotype that Pten deletion fails to rescue
Cre-negative control (A, E), PtenΔ/Δ (B, F) , Fgfr2Δ/Δ (C, G) , and (Pten/R2)Δ/Δ (D, H) lenses were analyzed for Aquaporin0 protein expression at E15.5 (A–D) , and for denucleation by TUNEL at E18.5 (E–H) . Both Fgfr2Δ/Δ (compare C to A; J, K) and (Pten/R2)Δ/Δ (Compare D to A; J, K) lenses experienced a reduced Aquaporin0 expression level. Additionally, Fgfr2Δ/Δ (C) and (Pten/R2)Δ/Δ (D) contained several heightened areas of Aquaporin0 expression in a circular pattern (C and D white arrows). Aquaporin0 expression in PtenΔ/Δ lenses did not differ from controls (compare B to A; J, K). Western blot analysis was performed at E15.5 to confirm the reduced Aquaporin0 protein observed with FGFR2 deficiency (K). The western blot quantification was standardized to GAPDH protein. TUNEL analysis detected normal fiber cell DNA degradation in both control (E) and Pten deleted lenses (F). However DNA degradation in the central fiber cells was markedly reduced in both Fgfr2Δ/Δ (G) and (Pten/R2)Δ/Δ (H) lenses. Quantitative RT-PCR revealed a reduction in trancripts for DnaseIIβ at E16.5 (I). The quantification of DnaseIIβ was standardized to GADPH mRNA. Reduced transcript levels of DnaseIIβ were observed in Fgfr2Δ/Δ and (Pten/R2)Δ/Δ lenses (I). PtenΔ/Δ lenses did not display defects in Aquaporin0 protein expression (J)/localization (B), nuclear removal (F), or DnaseIIβ expression (I). White arrows point towards heightened and abnormal expression of Aquaporin0 in C and D, and TUNEL foci in E, F, and H. Errors bars on the graphs represent s.e.m, with each bar representing a minimum of 9 measurements (3 sections from the lens center of 3 different embryos). Scale bars: 200 μm in A–D; 100 μm in E–H.
Figure 7
Figure 7. Deleting Pten restores pAKT and pERK1/2 in FGFR2-deficient lenses
E15.5 Cre-negative control, PtenΔ/Δ , Fgfr2Δ/Δ , and (Pten/R2)Δ/Δ lenses were analyzed by western blot analysis to determine the impact of deleting Pten, Fgfr2, or both Pten and Fgfr2 on activation of ERK1/2 and AKT. Levels of pAKT were significantly reduced in Fgfr2Δ/Δ lenses (A, B). Additionally deleting Pten with the Fgfr2 deletion raised the level of pAKT well beyond the levels of control lenses (A, B). As expected, PtenΔ/Δ lenses experienced very high levels of pAKT (A, B). Interestingly, the total amount of AKT was reduced in both PtenΔ/Δ lenses and (Pten/R2)Δ/Δ lenses (A, C). Fgfr2Δ/Δ lenses experienced a significant reduction in p-ERK (A, D), and additionally deleting Pten raised the level of pERK1/2 above that of control lenses (A, D). PtenΔ/Δ lenses experienced modestly elevated levels of pERK1/2 (A, D). Total ERK levels remained unaltered in all of the examined genotypes (A, E). Total ERK1/2 and AKT were standardized to GAPDH while pERK1/2 and pAKT were normalized to total ERK1/2 and total AKT, respectively. Errors bars on the graphs represent s.e.m, with significance levels indicated above the relevant genotypes.
Figure 8
Figure 8. FGFR2 deficiency leads to increased activation of C-JUN and p53 and loss of MDM2 phosphorylation
E15.5 whole lenses of Cre-negative control, PtenΔ/Δ , Fgfr2Δ/Δ , and (Pten/R2)Δ/Δ were analyzed by western blot analysis using antibodies to p-p53 (Ser 15), p-cJUN (Thr 63/Thr 73) and p-MDM2 (Ser 166). GAPDH was used as a loading control. Fgfr2Δ/Δ lenses increased both phospho-p53 (A-top panel, B) and p-cJUN (A-3rd panel, C) while decreasing the amount of p-MDM2 (A-5th panel, D). The deletion of Pten lowered p-p53 in FGFR2-deficient lenses. Likewise deleting Pten returned cJUN activation and p-MDM2 to control levels (A-3rd panel, C and A-5th panel, D, respectively). Error bars on the graphs represent +/− s.e.m. p-p53, p-cJUN and p-MDM2 were standardized to GAPDH for quantification.

References

    1. Ahmad I, Iwata T, Leung HY. Mechanisms of FGFR-mediated carcinogenesis. Biochimica et biophysica acta. 2012;1823:850–860. - PubMed
    1. Ashery-Padan R, Marquardt T, Zhou X, Gruss P. Pax6 activity in the lens primordium is required for lens formation and for correct placement of a single retina in the eye. Genes & development. 2000;14:2701–2711. - PMC - PubMed
    1. Bassnett S. Fiber cell denucleation in the primate lens. Investigative ophthalmology & visual science. 1997;38:1678–1687. - PubMed
    1. Bassnett S. On the mechanism of organelle degradation in the vertebrate lens. Experimental eye research. 2009;88:133–139. - PMC - PubMed
    1. Bassnett S, Beebe DC. Lens Fiber Differentiation. In: Robinson ML, Lovicu FJ, editors. Development of the Ocular Lens. Cambridge; 2004. pp. 214–244.

Publication types

MeSH terms

Substances

LinkOut - more resources