. 2017 Jan;18(1):69-84.
doi: 10.1093/bib/bbv111. Epub 2016 Jan 13.

A study of bias and increasing organismal complexity from their post-translational modifications and reaction site interplays

A study of bias and increasing organismal complexity from their post-translational modifications and reaction site interplays

Oliver Bonham-Carter et al. Brief Bioinform. 2017 Jan.

Abstract

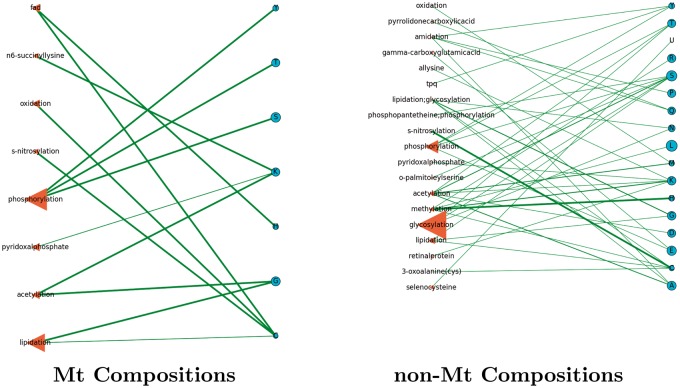
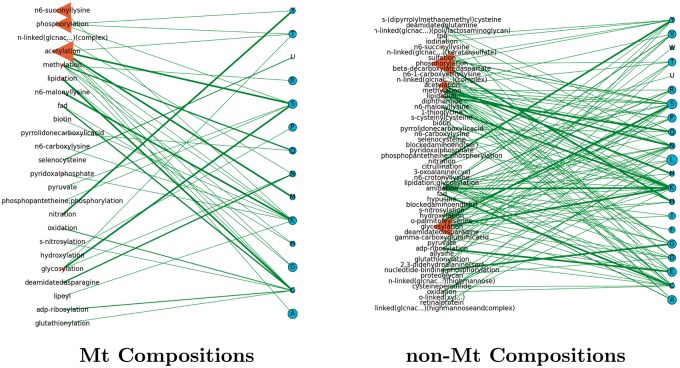
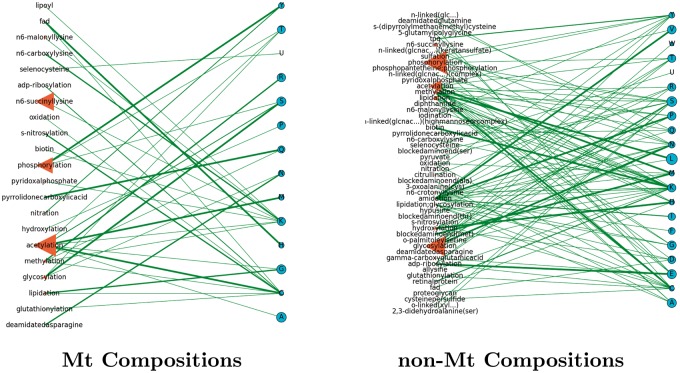
Post-translational modifications (PTMs) are important steps in the biosynthesis of proteins. Aside from their integral contributions to protein development, i.e. perform specialized proteolytic cleavage of regulatory subunits, the covalent addition of functional groups of proteins or the degradation of entire proteins, PTMs are also involved in enabling proteins to withstand and recover from temporary environmental stresses (heat shock, microgravity and many others). The literature supports evidence of thousands of recently discovered PTMs, many of which may likely contribute similarly (perhaps, even, interchangeably) to protein stress response. Although there are many PTM actors on the biological stage, our study determines that these PTMs are generally cast into organism-specific, preferential roles. In this work, we study the PTM compositions across the mitochondrial (Mt) and non-Mt proteomes of 11 diverse organisms to illustrate that each organism appears to have a unique list of PTMs, and an equally unique list of PTM-associated residue reaction sites (RSs), where PTMs interact with protein. Despite the present limitation of available PTM data across different species, we apply existing and current protein data to illustrate particular organismal biases. We explore the relative frequencies of observed PTMs, the RSs and general amino-acid compositions of Mt and non-Mt proteomes. We apply these data to create networks and heatmaps to illustrate the evidence of bias. We show that the number of PTMs and RSs appears to grow along with organismal complexity, which may imply that environmental stress could play a role in this bias.

Keywords: PTM bias; amino acid bias; organism complexity; reaction site bias.


Figures

Figure 1
Figure 1
A comparison between the number of PTMs in our Mt and non-Mt sequence data. Here, we exclude all PTMs that are labeled by UniProt as ‘InterChain’ because of a lack of information available for our study.
Figure 2
Figure 2
All Mt and non-Mt proteins were examined in each organism of our study. We recorded the protein type (Mt or non-Mt), the PTMs of the protein and their associated RSs. This information was used to assemble relative frequency data.
Figure 3
Figure 3
An example of how relative frequency information was extracted from protein data. For each organism, all Mt and non-Mt protein records were queried to ascertain their observed PTMs that have been curated by UniProt. The type and count of each PTM, including its associated RS, were recorded to calculate frequencies by Equations (1) and (2). Not shown, the occurrence magnitudes of all amino acids (non-RSs) were also obtained and applied to Equation (3) to determine the general amino-acid compositions of each proteome.
Figure 4
Figure 4
Mt and non-Mt PTM compositions prepared using Equation (3). High magnitudes of frequency are described by lighter colors. We note that phosphorylation and acetylation were common PTMs across the organisms. We note that all frequency values > 0.18 (threshold) are included here.
Figure 5
Figure 5
Mt and non-Mt RS compositions prepared using Equation (2). High magnitudes of frequency are described by lighter colors. Unlike the non-Mt heatmap, where nearly all amino acids played a roles as RSs, there were many amino acidss in the Mt proteomes that were never involved with the PTMs.
Figure 6
Figure 6
Mt and non-Mt amino-acid compositions prepared using Equation (3). High magnitudes of frequency are described by lighter colors. Although all organisms display a common theme of color bands, indicating that their amino-acid composition is similar, we note that related organisms have especially similar patterns of color, indicating that the amino-acid distributions are similar.
Figure 7
Figure 7
Arabidopsis thaliana: a network of PTM frequencies in Mt (left) and non-Mt (right) protein. We display the prominent PTMs across all organisms of our study having a frequency of at least 0.1.
Figure 8
Figure 8
Aspergillus nidulans: a network of PTM frequencies in Mt (left) and non-Mt (right) protein. We display the prominent PTMs across all organisms of our study having a frequency of at least 0.1.
Figure 9
Figure 9
Caenorhabditis elegans: a network of PTM frequencies in Mt (left) and non-Mt (right) protein. We display the prominent PTMs across all organisms of our study having a frequency of at least 0.1.
Figure 10
Figure 10
Canis familiaris: a network of PTM frequencies in Mt (left) and non-Mt (right) protein. We display the prominent PTMs across all organisms of our study having a frequency of at least 0.1.
Figure 11
Figure 11
Danio rerio: a network of PTM frequencies in Mt (left) and non-Mt (right) protein. We display the prominent PTMs across all organisms of our study having a frequency of at least 0.1.
Figure 12
Figure 12
Homo sapiens: a network of PTM frequencies in Mt (left) and non-Mt (right) protein. We display the prominent PTMs across all organisms of our study having a frequency of at least 0.1.
Figure 13
Figure 13
Mus musculus: a network of PTM frequencies in Mt (left) and non-Mt (right) protein. We display the prominent PTMs across all organisms of our study having a frequency of at least 0.1.
Figure 14
Figure 14
Oryctolagus cuniculus: a network of PTM frequencies in Mt (left) and non-Mt (right) protein. We display the prominent PTMs across all organisms of our study having a frequency of at least 0.1.
Figure 15
Figure 15
Rattus norvegicus: a network of PTM frequencies in Mt (left) and non-Mt (right) protein. We display the prominent PTMs across all organisms of our study having a frequency of at least 0.1.
Figure 16
Figure 16
Saccharomyces cerevisiae: a network of PTM frequencies in Mt (left) and non-Mt (right) protein. We display the prominent PTMs across all organisms of our study having a frequency of at least 0.1.
Figure 17
Figure 17
Xenopus laevis: a network of PTM frequencies in Mt (left) and non-Mt (right) protein. We display the prominent PTMs across all organisms of our study having a frequency of at least 0.1.
Figure 18
Figure 18
We summarize the number of PTMs and RSs in the organismal networks. Here, we note that the higher organisms appear to have more PTMs and RSs. We note that the increasing numbers of PTMs and RSs are similar trends across the Mt and non-Mt data.
Figure 19
Figure 19
The number of isoforms of the organisms in our study. These counts were prepared by querying all organismal proteins in UniProt and then determining how many isoform proteins were present. The increasing number of isoforms may help to explain the increasing number of PTMs in higher organisms. Note that A. nidulans has been omitted because of the lack of isoform information.

References

    1. Khoury GA, Baliban RC, Floudas CA. Proteome-wide post-translational modification statistics: frequency analysis and curation of the swiss-prot database. Sci Rep 2011;1:90. - PMC - PubMed
    1. Bonham-Carter O, Pedersen J, Najjar L, et al. Modeling the effects of microgravity on oxidation in mitochondria: a protein damage assessment across a diverse set of life forms. Comput Biol Med 2014;53:179–89. - PubMed
    1. Bonham-Carter O, Pedersen J, Najjar L, et al. Modeling the effects of microgravity on oxidation in mitochondria: a protein damage assessment across a diverse set of life forms. In: Data Mining Workshops (ICDMW), 2013 IEEE 13th International Conference on IEEE, 2013, pp. 250–7.
    1. Peng L, Yuan Z, Li Y, et al. Ubiquitinated sirtuin 1 (sirt1) function is modulated during dna damage-induced cell death and survival. J Biol Chem 2015;290(14):8904–12. - PMC - PubMed
    1. Wright PE, Dyson HJ. Intrinsically disordered proteins in cellular signalling and regulation. Nat Rev Mol Cell Biol 2015;16(1):18–29. - PMC - PubMed