

An immediate transcriptional signature associated with response to the histone deacetylase inhibitor Givinostat in T acute lymphoblastic leukemia xenografts
- PMID: 26764573
- PMCID: PMC4816177
- DOI: 10.1038/cddis.2015.394
An immediate transcriptional signature associated with response to the histone deacetylase inhibitor Givinostat in T acute lymphoblastic leukemia xenografts
Abstract
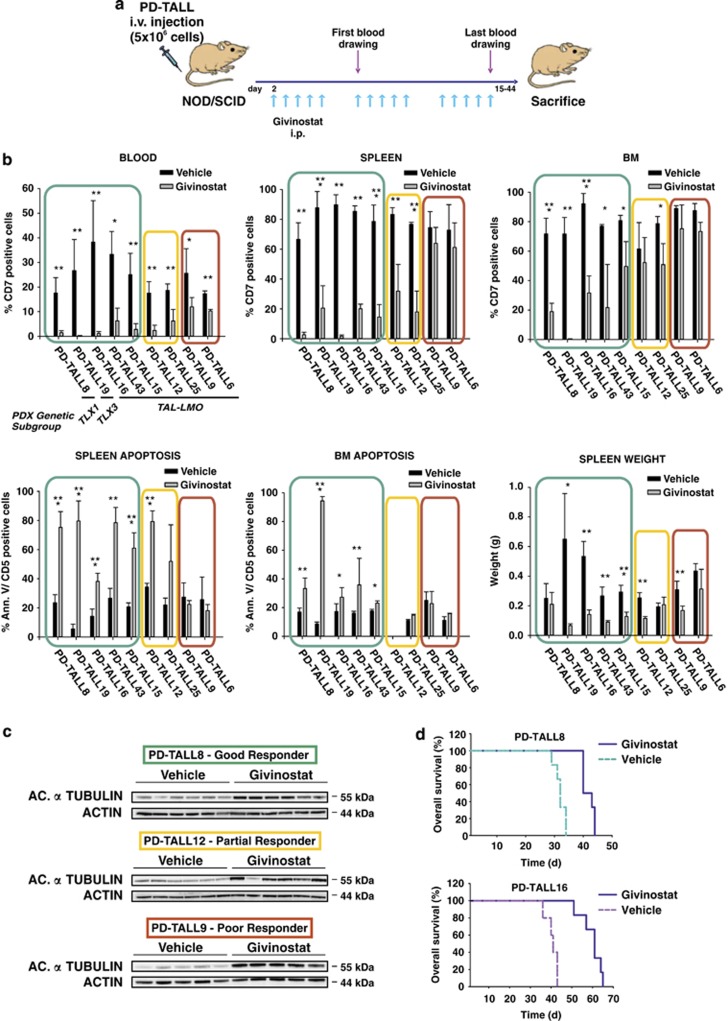
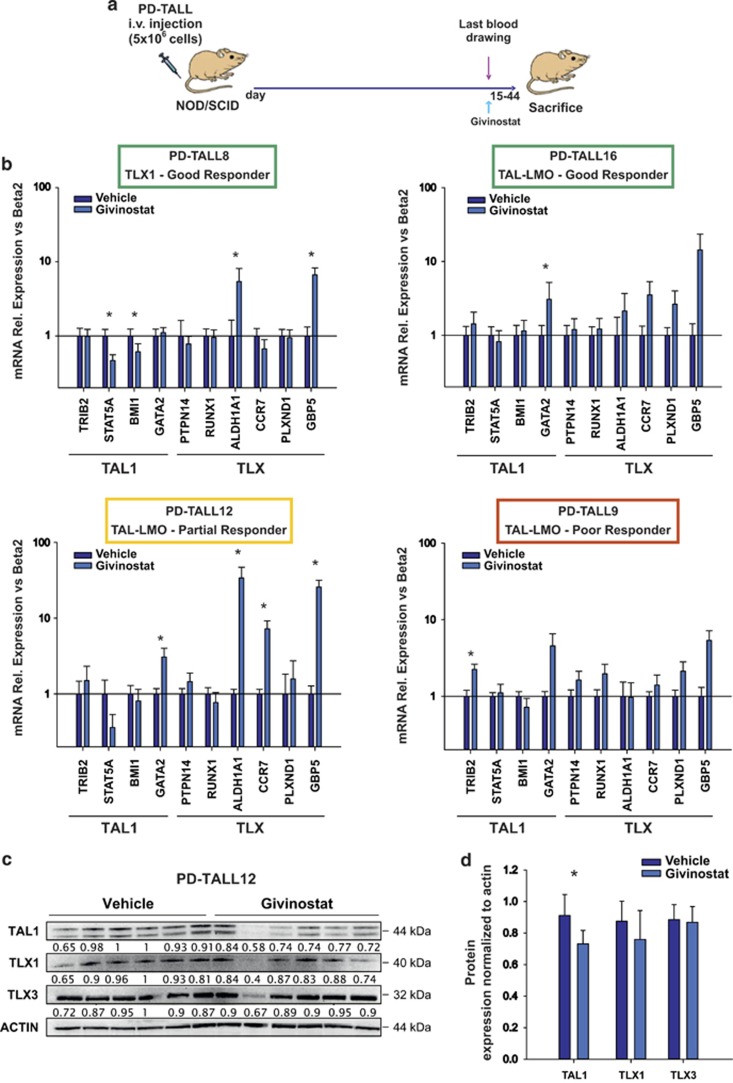
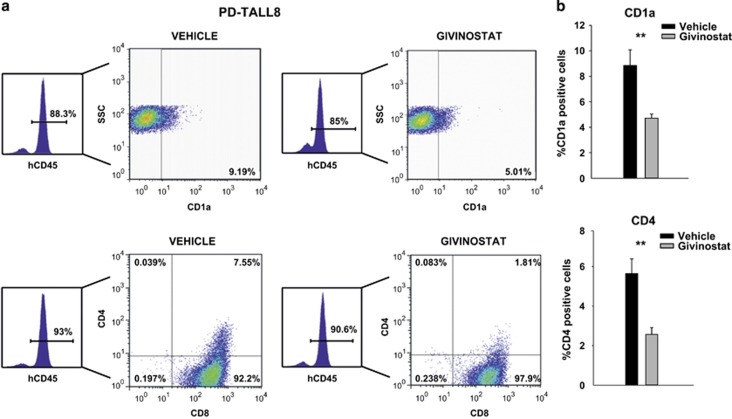
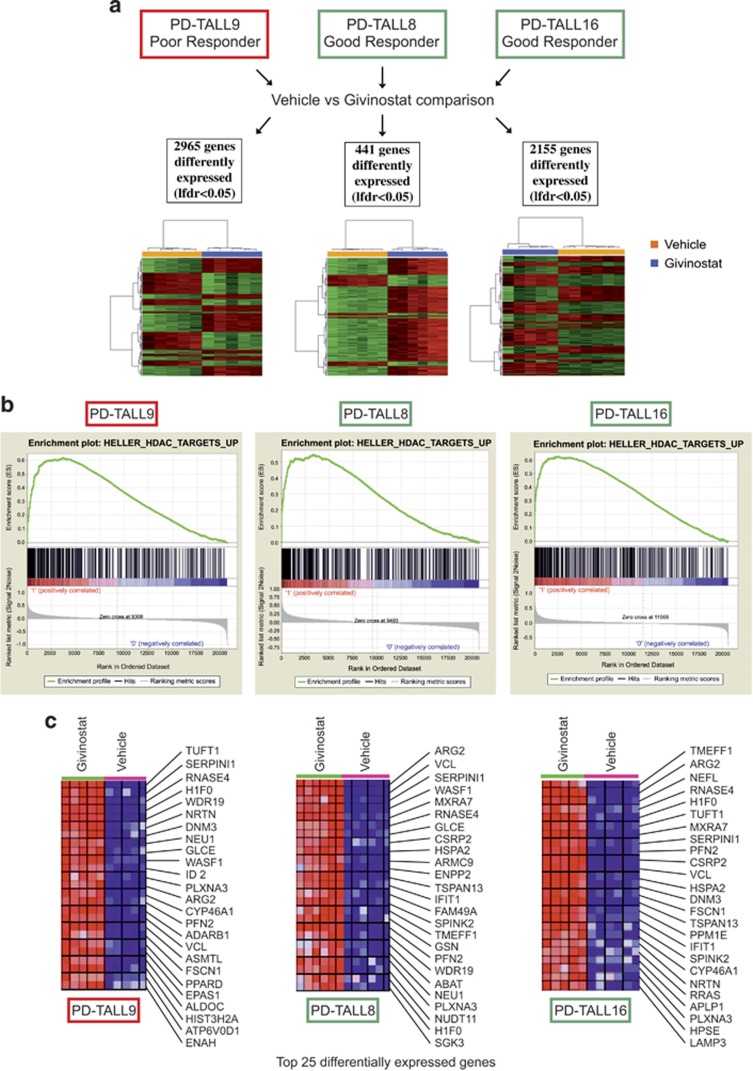
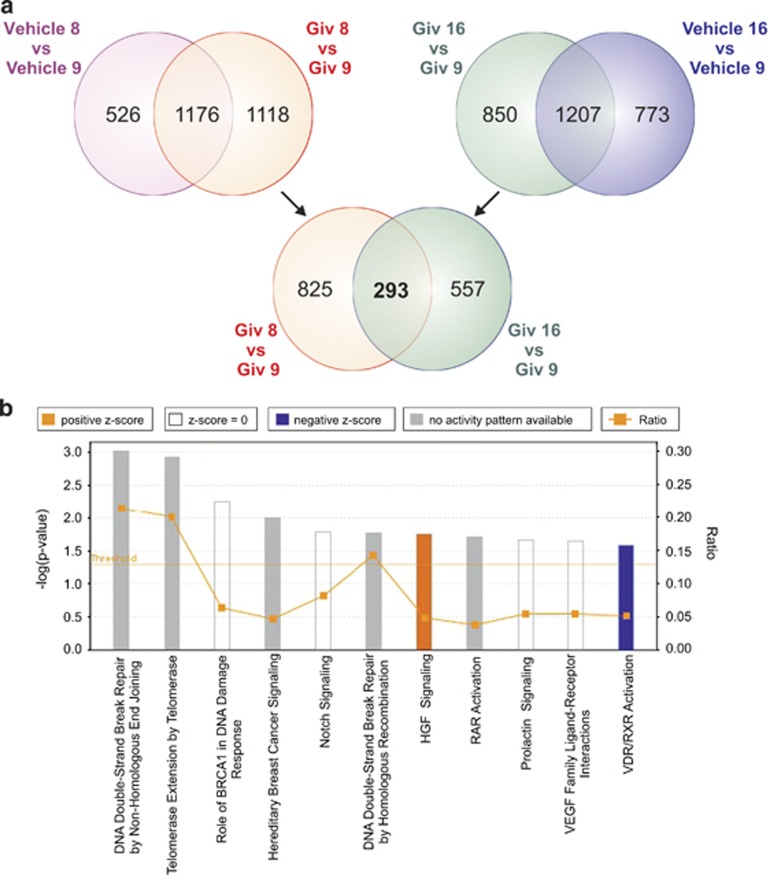
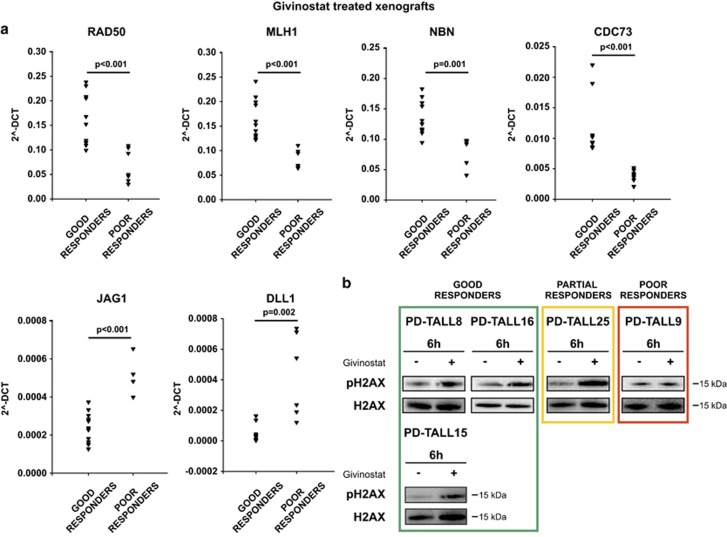
Despite some success with certain hematological malignancies and in contrast with the strong pro-apoptotic effects measured in vitro, the overall response rate of acute lymphoblastic leukemia (ALL) to histone deacetylase inhibitors (HDACis) is low. With the aim to improve the understanding of how HDACis work in vivo, we investigated the therapeutic efficacy of the clinically approved HDACi Givinostat in a collection of nine pediatric human T-ALL engrafted systemically in NOD/SCID mice. We observed highly heterogeneous antileukemia responses to Givinostat, associated with reduction of the percentage of infiltrating blasts in target organs, induction of apoptosis and differentiation. These effects were not associated with the T-ALL cytogenetic subgroup. Transcriptome analysis disclosed an immediate transcriptional signature enriched in genes involved in cell-cycle regulation and DNA repair, which was validated by quantitative RT-PCR and was associated with in vivo response to this HDACi. Increased phospho-H2AX levels, a marker of DNA damage, were measured in T-ALL cells from Givinostat responders. These results indicate that the induction of the DNA damage response could be an early biomarker of the therapeutic effects of Givinostat in T-ALL models. This information should be considered in the design of future clinical trials with HDACis in acute leukemia.
Conflict of interest statement
Gianluca Fossati is an employee of Italfarmaco S.p.A. The other authors declare no conflict of interest.
Figures
Similar articles
-
BIM upregulation and ROS-dependent necroptosis mediate the antitumor effects of the HDACi Givinostat and Sorafenib in Hodgkin lymphoma cell line xenografts.Leukemia. 2014 Sep;28(9):1861-71. doi: 10.1038/leu.2014.81. Epub 2014 Feb 24. Leukemia. 2014. PMID: 24561519
-
Potent induction of apoptosis by givinostat in BCR-ABL1-positive and BCR-ABL1-negative precursor B-cell acute lymphoblastic leukemia cell lines.Leuk Res. 2017 Sep;60:129-134. doi: 10.1016/j.leukres.2017.08.003. Epub 2017 Aug 9. Leuk Res. 2017. PMID: 28818808
-
Histone deacetylase inhibitors synergistically potentiate death receptor 4-mediated apoptotic cell death of human T-cell acute lymphoblastic leukemia cells.Apoptosis. 2010 Oct;15(10):1256-69. doi: 10.1007/s10495-010-0521-9. Apoptosis. 2010. PMID: 20582477
-
Histone deacetylase inhibitor givinostat: the small-molecule with promising activity against therapeutically challenging haematological malignancies.J Chemother. 2016 Aug;28(4):247-54. doi: 10.1080/1120009X.2016.1145375. Epub 2016 Apr 28. J Chemother. 2016. PMID: 27121910 Review.
-
HDAC inhibitors: roles of DNA damage and repair.Adv Cancer Res. 2012;116:87-129. doi: 10.1016/B978-0-12-394387-3.00003-3. Adv Cancer Res. 2012. PMID: 23088869 Review.
Cited by
-
The histone deacetylase inhibitor givinostat (ITF2357) exhibits potent anti-tumor activity against CRLF2-rearranged BCP-ALL.Leukemia. 2017 Nov;31(11):2365-2375. doi: 10.1038/leu.2017.93. Epub 2017 Mar 23. Leukemia. 2017. PMID: 28331226
-
WT1 loss attenuates the TP53-induced DNA damage response in T-cell acute lymphoblastic leukemia.Haematologica. 2018 Feb;103(2):266-277. doi: 10.3324/haematol.2017.170431. Epub 2017 Nov 23. Haematologica. 2018. PMID: 29170254 Free PMC article.
-
A novel and highly effective mitochondrial uncoupling drug in T-cell leukemia.Blood. 2021 Oct 14;138(15):1317-1330. doi: 10.1182/blood.2020008955. Blood. 2021. PMID: 33876224 Free PMC article.
-
Histone deacetylase 6 controls Notch3 trafficking and degradation in T-cell acute lymphoblastic leukemia cells.Oncogene. 2018 Jul;37(28):3839-3851. doi: 10.1038/s41388-018-0234-z. Epub 2018 Apr 12. Oncogene. 2018. PMID: 29643474 Free PMC article.
-
miR-22-3p Negatively Affects Tumor Progression in T-Cell Acute Lymphoblastic Leukemia.Cells. 2020 Jul 18;9(7):1726. doi: 10.3390/cells9071726. Cells. 2020. PMID: 32708470 Free PMC article.
References
-
- Thiagalingam S, Cheng KH, Lee HJ, Mineva N, Thiagalingam A, Ponte JF. Histone deacetylases: unique players in shaping the epigenetic histone code. Ann NY Acad Sci 2003; 983: 84–100. - PubMed
-
- Bolden JE, Peart MJ, Johnstone RW. Anticancer activities of histone deacetylase inhibitors. Nat Rev Drug Discov 2006; 5: 769–784. - PubMed
-
- Vilas-Zornoza A, Agirre X, Abizanda G, Moreno C, Segura V, De Martino Rodriguez A et al. Preclinical activity of LBH589 alone or in combination with chemotherapy in a xenogeneic mouse model of human acute lymphoblastic leukemia. Leukemia 2012; 26: 1517–1526. - PubMed
MeSH terms
Substances
LinkOut - more resources
Full Text Sources
Other Literature Sources
Molecular Biology Databases
