. 2016 Jan 13;19(1):21-31.
doi: 10.1016/j.chom.2015.12.006.

Genetic and Metabolic Signals during Acute Enteric Bacterial Infection Alter the Microbiota and Drive Progression to Chronic Inflammatory Disease

Affiliations

Genetic and Metabolic Signals during Acute Enteric Bacterial Infection Alter the Microbiota and Drive Progression to Chronic Inflammatory Disease

Karishma Kamdar et al. Cell Host Microbe. .

Abstract

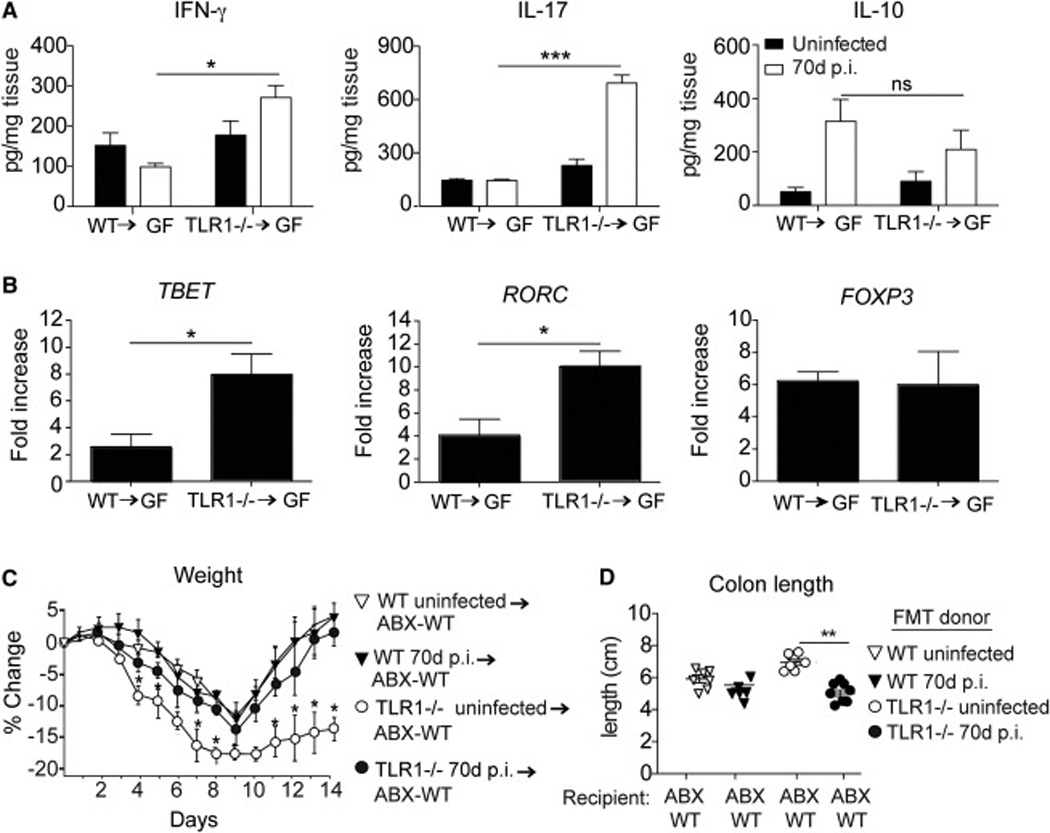
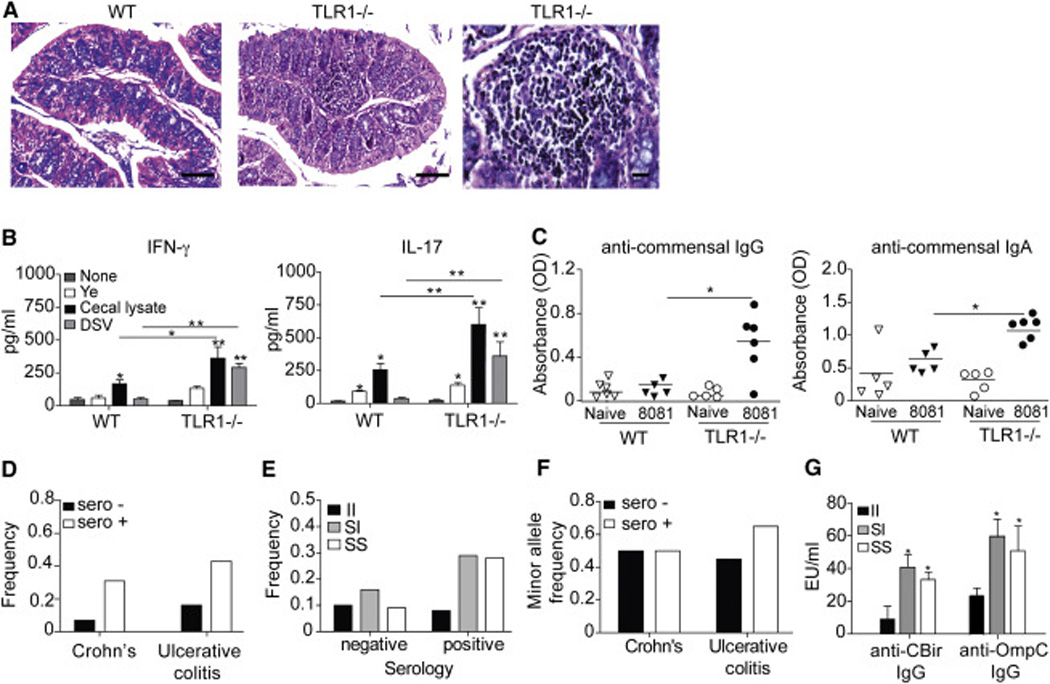
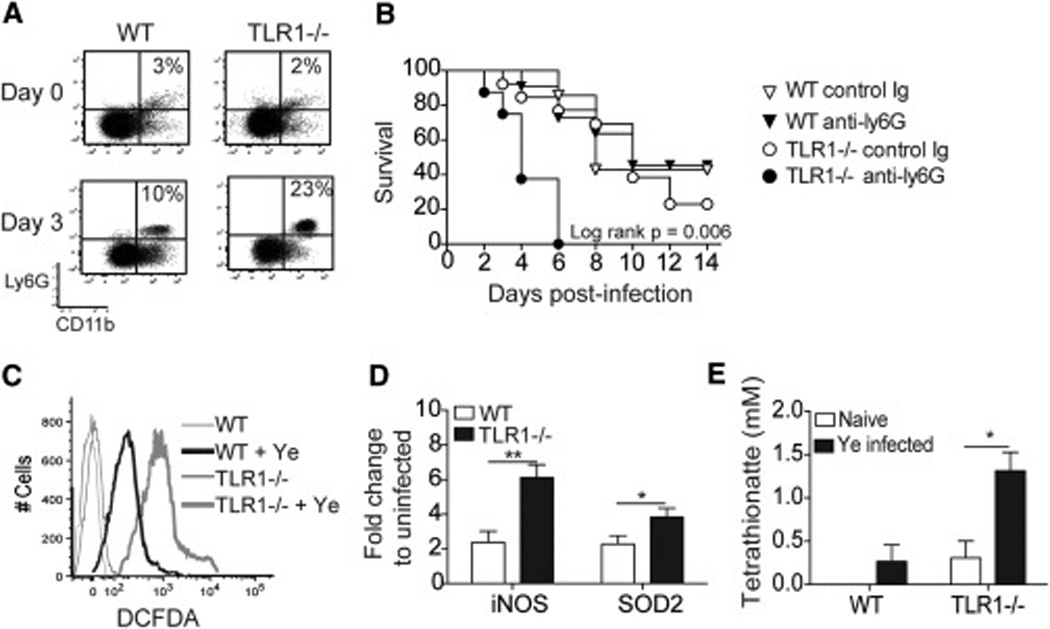
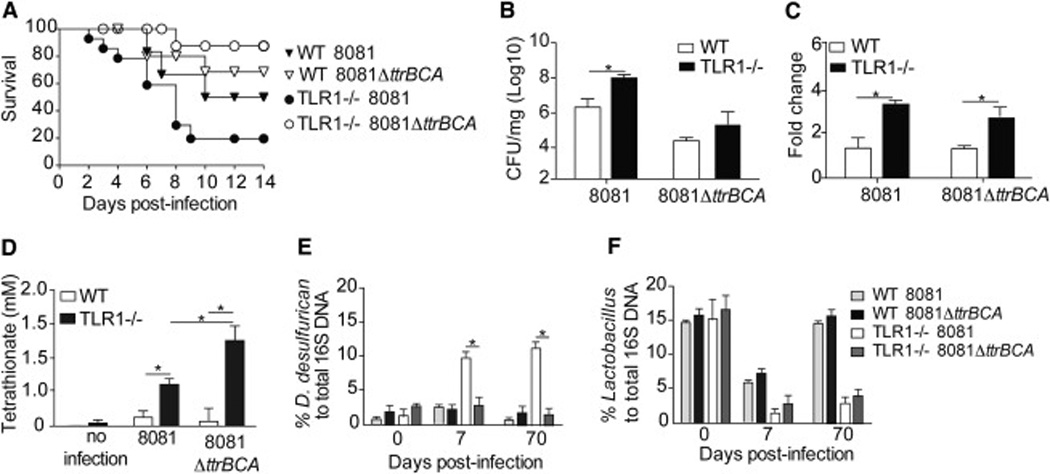
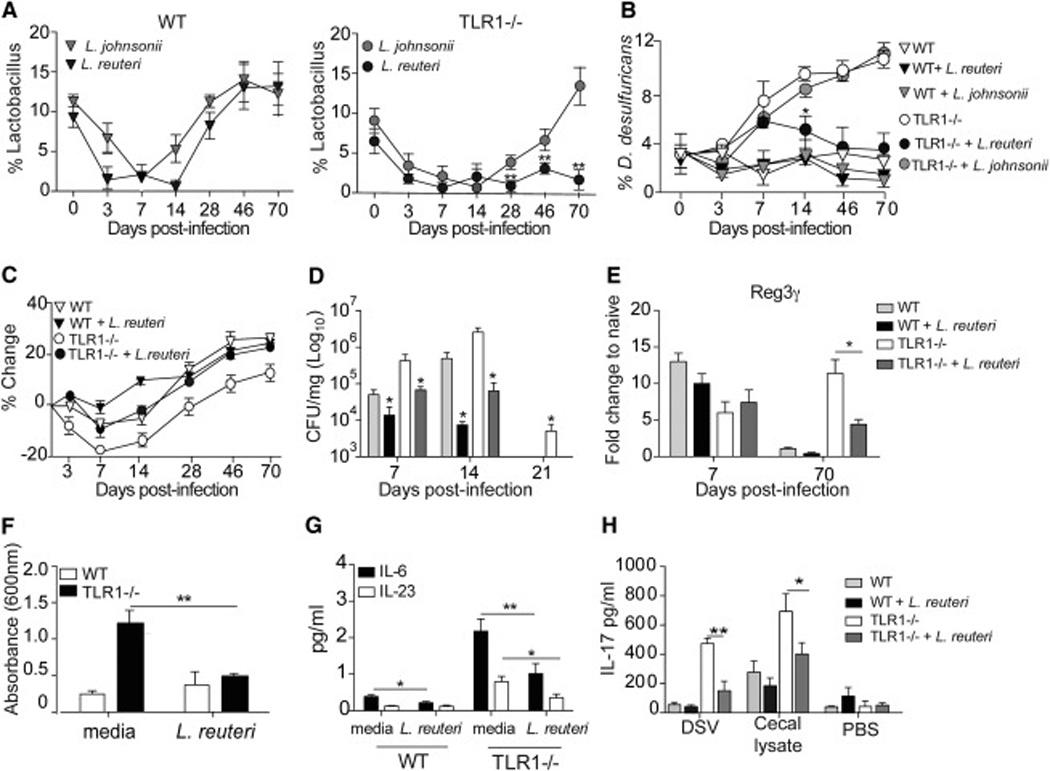
Chronic inflammatory disorders are thought to arise due to an interplay between predisposing host genetics and environmental factors. For example, the onset of inflammatory bowel disease is associated with enteric proteobacterial infection, yet the mechanistic basis for this association is unclear. We have shown previously that genetic defiency in TLR1 promotes acute enteric infection by the proteobacteria Yersinia enterocolitica. Examining that model further, we uncovered an altered cellular immune response that promotes the recruitment of neutrophils which in turn increases metabolism of the respiratory electron acceptor tetrathionate by Yersinia. These events drive permanent alterations in anti-commensal immunity, microbiota composition, and chronic inflammation, which persist long after Yersinia clearence. Deletion of the bacterial genes involved in tetrathionate respiration or treatment using targeted probiotics could prevent microbiota alterations and inflammation. Thus, acute infection can drive long term immune and microbiota alterations leading to chronic inflammatory disease in genetically predisposed individuals.


Figures

Figure 1
Figure 1. TLR1 signaling during acute gastroenteritis prevents δ-Proteobacteria outgrowth
(A) Weight change in mice after acute gastroenteritis. Data is the mean ± SEM of three independent experiments (n=7–9 mice/group). (B) Y. enterocolitica in the LP of WT and TLR1−/− mice over 70 days after initial infection. Data is pooled mean ± SEM from three independent experiments (n=6–8 mice/group). *, p < 0.05; **, p < 0.01 Student’s unpaired t-test. (C) IL-6 and IL-23 levels in the LP during acute infection and 70 days post-infection. Data is pooled mean ± SEM from three independent experiments (n=6–8 mice/group). *, p < 0.05; **, p < 0.01 Student’s unpaired t-test. (D) mRNA transcript levels of antimicrobial peptides in distal ileum. Data is the mean ± SEM CT compared to respective naïve samples (n=5–6 mice/group). **, p < 0.01 Student’s unpaired t-test. (E) Relative abundance of class and genera-based classifications of bacterial populations in cecum determined by full-length SSU sequence libraries from TLR1−/− or WT mice. Data is representative of two mice from each group. (F) 16S gene copy numbers of cecal bacteria harvested from WT and TLR1−/− mice 70 days post-GI infection. Copy number was determined using plasmids to create a standard curve. Data is mean ± SEM (n=7–10 mice/group). *, p < 0.05 Student’s unpaired t-test.
Figure 2
Figure 2. Altered microbiota drives an inflammatory phenotype and prevents intestinal healing
Germ-free (GF) mice were reconstituted with cecal contents from WT or TLR1−/− mice 70 days (70d) post-infection (p.i.). Two weeks after reconstitution mucosal scrapings were evaluated for indicated cytokines (A) and transcription factors (B). Data shown is the mean ± SEM protein concentration (A) or fold change (B) compared to untreated GF mice. Data is pooled from two independent experiments (n=6–7 mice/group). *, p < 0.05; **, p < 0.01; ***, p < 0.001 Student’s paired t-test. WT mice were treated with an antibiotic cocktail (ABX-WT) for two weeks and then reconstituted with cecal contents from WT or TLR1−/− mice 70 days post-infection. After two weeks the mice were placed on 2.5% dextran sodium sulfate DSS for 7 days followed by normal drinking water for 7 days. The percent change in weight of mice over the 14 days (C) and the individual length of the colon (D) are shown. Data is the average of n=7–9 mice collected from two separate experiments. *, p < 0.05 Student’s paired t-test.
Figure 3
Figure 3. TLR1 signaling during acute GI infection prevents development of anti-commensal immunity
(A) Images of H&E stained proximal colon of WT (left) and TLR1−/− (center right) mice 70 days post-infection by Y. enterocolitica and TLR1−/− infiltrate (right) scale bars are 200 µM and 50 µM, respectively. Data shown are representative images from n=4 mice/group. (B) Mean concentration of IFN-γ and IL-17 production from colonic lamina propria lymphocytes (LPC) harvested 70 days after infection by Y. enterocolitica and re-stimulated with indicated bacterial lysate. Data is the mean ± SEM from three independent experiments (n=6–8 mice/group). *, p < 0.05; **, p < 0.01; ***, p < 0.001 Student’s unpaired t-test. (C) Optical density at 600 nm of individual mice (n=6 mice/group) assayed for anti-IgG and ant i-IgA serum reactivity against commensal lysate. *, p < 0.05 Student’s unpaired t-test. (D) The average frequency of anti-commensal serology positive and negative pediatric Crohn’s and ulcerative colitis patients. (E) The average frequency of TLR1 I602S genotypes in patients with positive and negative serology for anti-commensal antibodies. (F) The average minor allele (S-variant) frequency (MAF) in serology positive and negative Crohn’s disease and ulcerative colitis patients. (G) The average anti-CBir (flagellin) and anti-OmpC antibody concentrations in UC patients homozygous for the S-variant (TLR1 602S), homozygous for the non-variant (TLR1 602I) and heterozygous for the S-variant (TLR1 602S/I). Data is a composite of 220 patients in our pediatric IBD cohort that underwent serological testing. *, p < 0.05 Student’s paired t-test.
Figure 4
Figure 4. Gastroenteritis in the absence of TLR1 causes an increase in Ly6G+CD11c+ cells
Analysis of Peyer’s patches from WT and TLR1−/− mice infected for 3 days with Y. enterocolitica. (A) Flow cytometry plots for Ly6G+CD11c+ cells. Data is representative from 5 individual mice collected from 2 separate experiments. (B) Percent survival of mice treated with depleting antibody against Ly6G during Y. enterocolitica infection. (C) Representative histogram of amine-reactive fluorescein (DCFDA) stained cells from the Peyer’s patches 3 days after infection. Data is a representative image from n=4 mice/group. (D) Fold increase of iNOS and superoxide dismutase (SOD2) from the Peyer’s patches 3 days after infection. Data is the mean ± SEM from three independent experiments (n=6–8 mice/group). *, p < 0.05; **, p < 0.01; Student’s unpaired t-test. (E) Tetrathionate levels determined by reverse-phase LC-MS from lamina propria of the terminal ileum. Data is the mean ± SEM from 3 individual mice/group.
Figure 5
Figure 5. Tetrathionate respiration is necessary for the outgrowth of D. desulfuricans in the absence of TLR1
Analysis of WT and TLR1−/− mice after infection with Y. enterocolitica (8081) or the tetrathionate mutant (8081ΔttrBCA). (A) Survival (B) Bacteria load per mg of tissue in the LP 3 days post-infection. (C) Fold increase in mRNA transcripts of iNOS. Data is the mean ± SEM from two independent experiments (n=4–5 mice/group). *, p < 0.05; Student’s unpaired t-test. (D) Percent of total 16S DNA of D. desulfuricans and (E) Lactobacillus as determined by qPCR of the cecal contents of WT and TLR1−/− mice after infection with Y. enterocolitica or ΔttrBCA mutant. Data is the mean ± SEM pooled from two separate experiments (n=8–12 mice/group). *, p < 0.05; **, p < 0.01 Student’s paired t-test.
Figure 6
Figure 6. Targeted microbiota therapy during acute GI infection prevents growth of δ-Proteobacteria and generation of anti-commensal immunity in the absence of TLR1
WT and TLR1−/− mice were infected with Y. enterocolitica. (A) Percent of Lactobacillus species to total 16S DNA over the 70 days following infection in WT (left) and TLR1−/− (right) mice. Data is the mean ± SEM of n=4–6 mice/group. (B) WT and TLR1−/− mice were infected with Y. enterocolitica and treated orally with 109 L. reuteri, L. johnsonii or media control on days 4, 6 and 8. D. desulfuricans DNA was measured by qPCR and compared to total 16S DNA. Data is the mean ± SEM pooled from two separate experiments (n=7–9 mice/group). (C) Average weight change, (D) Bacterial burden and (E) Reg3γ mRNA transcript levels of WT and TLR1−/− mice infected with Y. enterocolitica and treated with L. reuteri or media control on days 4, 6,and 8. Data is the mean ± SEM pooled from two separate experiments (n=5–7 mice/group). (F) OD at 600 nm of anti-commensal IgA antibodies in the serum and (G) average IL-6, IL-23 and (H) IL-17 cytokine production in the LP of L. reuteri treated WT and TLR1−/− mice. Data is the mean ± SEM pooled from two independent experiments (n=6 mice/group). *, p < 0.05; **, p < 0.01 Student’s paired t-test

Comment in

References

    1. Abreu MT. Toll-like receptor signalling in the intestinal epithelium: how bacterial recognition shapes intestinal function. Nat Rev Immunol. 2010;10:131–144. - PubMed
    1. Arthur JC, Perez-Chanona E, Muhlbauer M, Tomkovich S, Uronis JM, Fan TJ, Campbell BJ, Abujamel T, Dogan B, Rogers AB, et al. Intestinal inflammation targets cancer-inducing activity of the microbiota. Science. 2012;338:120–123. - PMC - PubMed
    1. Ashelford KE, Chuzhanova NA, Fry JC, Jones AJ, Weightman AJ. New screening software shows that most recent large 16S rRNA gene clone libraries contain chimeras. Appl Environ Microbiol. 2006;72:5734–5741. - PMC - PubMed
    1. Autenrieth SE, Warnke P, Wabnitz GH, Lucero Estrada C, Pasquevich KA, Drechsler D, Gunter M, Hochweller K, Novakovic A, Beer-Hammer S, et al. Depletion of dendritic cells enhances innate anti-bacterial host defense through modulation of phagocyte homeostasis. PLoS Pathog. 2012;8:e1002552. - PMC - PubMed
    1. Ayabe T, Satchell DP, Wilson CL, Parks WC, Selsted ME, Ouellette AJ. Secretion of microbicidal alpha-defensins by intestinal Paneth cells in response to bacteria. Nat Immunol. 2000;1:113–118. - PubMed

Publication types

MeSH terms

Substances