. 2016 Jan 13;19(1):32-43.
doi: 10.1016/j.chom.2015.12.005.

The Host Shapes the Gut Microbiota via Fecal MicroRNA

Affiliations

The Host Shapes the Gut Microbiota via Fecal MicroRNA

Shirong Liu et al. Cell Host Microbe. .

Abstract

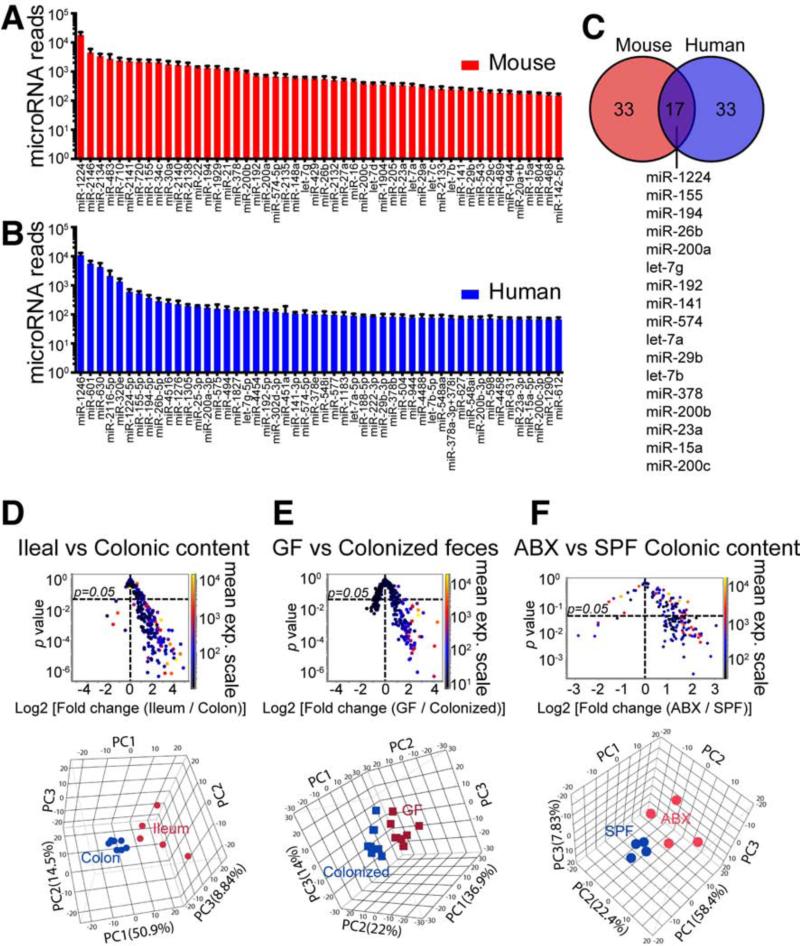
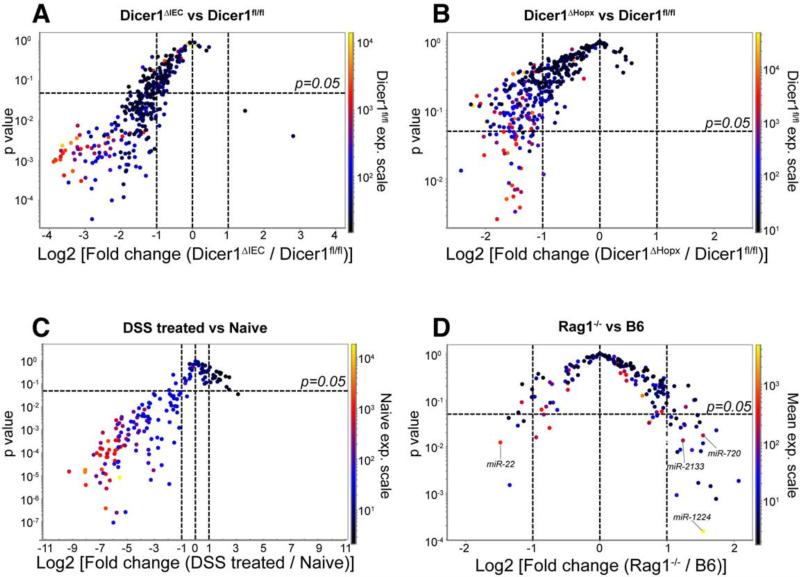
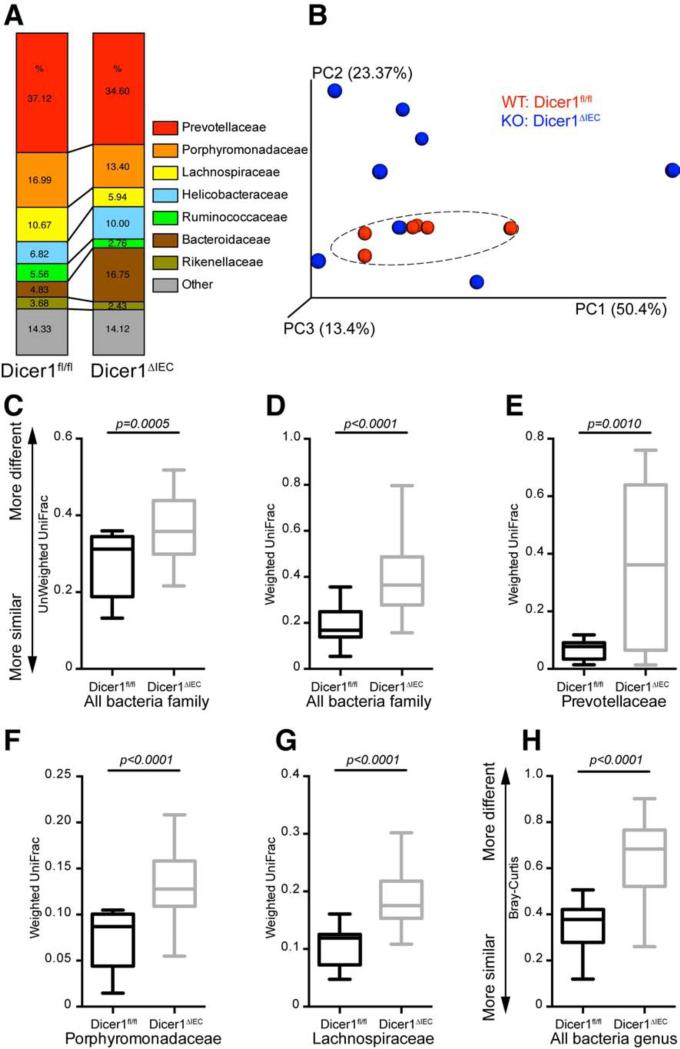
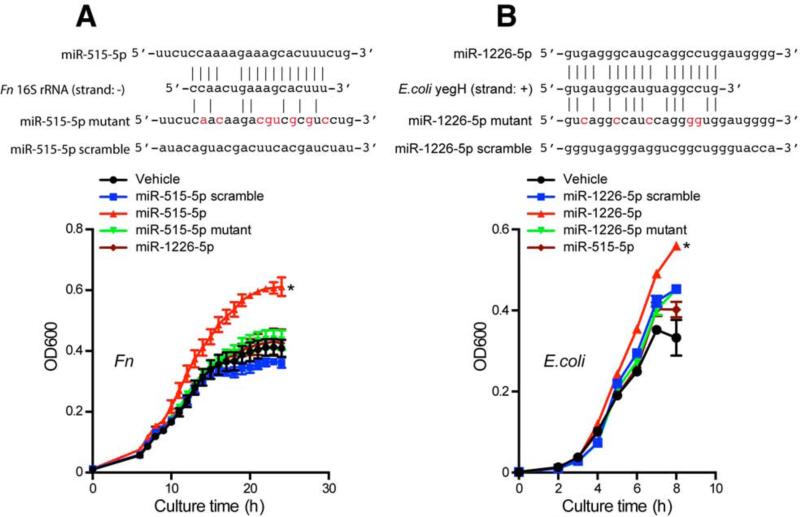
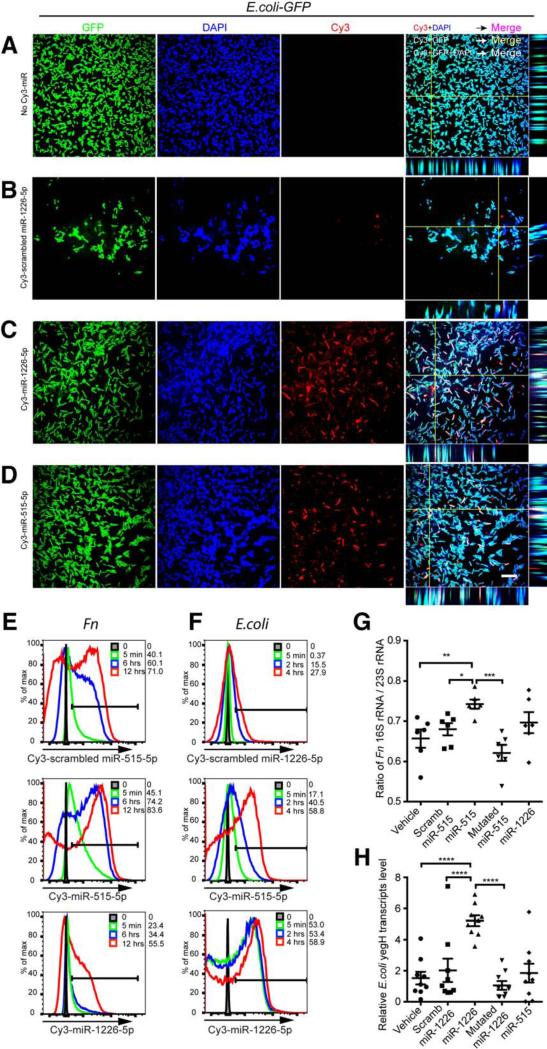
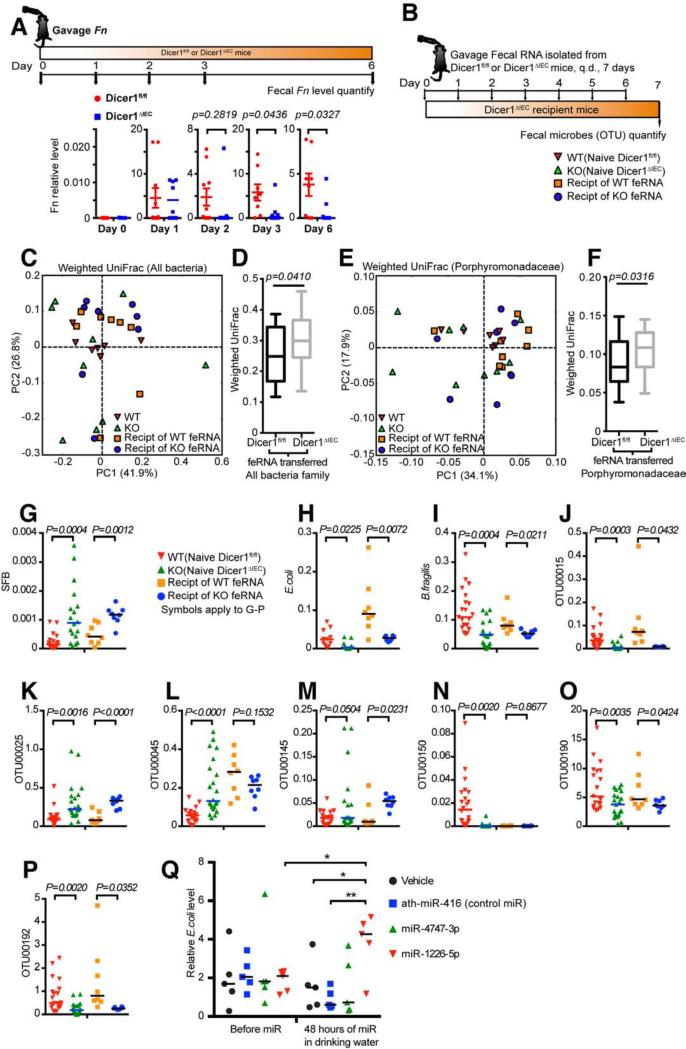
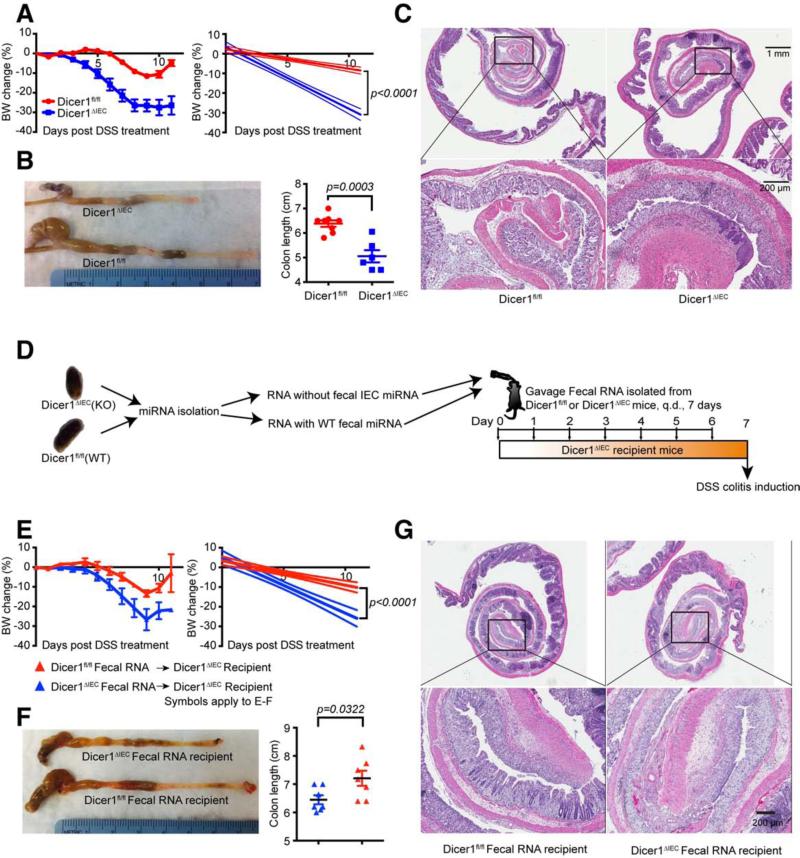
The host gut microbiota varies across species and individuals but is relatively stable over time within an individual. How the host selectively shapes the microbiota is largely unclear. Here, we show that fecal microRNA (miRNA)-mediated inter-species gene regulation facilitates host control of the gut microbiota. miRNAs are abundant in mouse and human fecal samples and present within extracellular vesicles. Cell-specific loss of the miRNA-processing enzyme, Dicer, identified intestinal epithelial cells (IEC) and Hopx-positive cells as predominant fecal miRNA sources. These miRNAs can enter bacteria, such as F. nucleatum and E. coli, specifically regulate bacterial gene transcripts, and affect bacterial growth. IEC-miRNA-deficient (Dicer1(ΔIEC)) mice exhibit uncontrolled gut microbiota and exacerbated colitis, and WT fecal miRNA transplantation restores fecal microbes and ameliorates colitis. These findings identify both a physiologic role by which fecal miRNA shapes the gut microbiota and a potential strategy for manipulating the microbiome.


Figures

Figure 1
Figure 1. Identification of miRNA in Feces and Intestinal Luminal Contents
(A) Mean values ± SEM for the 50 most abundant miRNAs in mouse fecal samples (n=6). See Table S1 for full list. (B) Mean values ± SEM for the 50 most abundant miRNAs in human feces (n=10). See Table S2 for full list. (C) Venn diagram showing 17 miRNAs from the 50 most abundant fecal miRNAs shared between human and the mouse as shown in (A) and (B). (D-F) (Upper panels), volcano plots for miRNA level based on nanostring detection in ileal luminal contents (n=5) vs. colonic luminal contents (n=8) (D), germ-free (GF) mouse feces (n=8) vs. SPF colonized (Colonized) mouse feces (n=8) (E), and antibiotic treated (ABX) mouse feces (n=4) vs. SPF mouse feces (n=4) (F). Each dot represents one miRNA; x-Axis: fold change; y-Axis: p value comparing individual miRNAs between groups (unequal variance t test followed by Benjamini-Hochberg correction); the color of the dot indicates mean expression (exp.) level of the corresponding miRNA in both groups as shown in side color scale bar. (Down panel), PCA analyses of miRNAs based on the same nanostring data sets. See also Figure S1.
Figure 2
Figure 2. Intestinal Epithelial Cells and Hopx-expressing Cells are Two Predominant Fecal miRNA Sources
Volcano plot of fecal miRNA levels detected by nanostring in feces from: (A) Dicer1ΔIEC (n=6) v.s. Dicer1fl/fl (n=5) mice (See also Table S3); (B) Dicer1ΔHopx (n=4) v.s. Dicer1fl/fl (n=4) mice (See also Table S4); (C) DSS treated day 4 (n=4) v.s. naïve mice (n=4); and (D) Rag1−/− (n=5) v.s. wild type C57Bl/6J (B6) (n=5) mice. x-Axis: Log2 (fold change) of expression level between the groups as indicated; y-Axis: Benjamini-Hochberg corrected unequal variance t test p-value of the compared groups. Dotted horizontal line: p=0.05. The color of the dot indicates expression level of the corresponding miRNA in (A) and (B): Dicer1fl/fl (WT) group; (C): naïve group; (D): mean of both Rag1−/− and B6 groups.
Figure 3
Figure 3. Deficiency of Intestinal Epithelial Cell miRNA Increases the Dissimilarity of the Gut Microbiota
Bacterial 16S rDNA sequence-based surveys were performed on the feces of 16 mice (n=7 Dicer1fl/fl, 9 Dicer1ΔIEC mice). (A) Relative abundance of bacteria was classified at a family-level taxonomy. (B) Principal coordinates analysis (PCoA) based on weighted UniFrac metrics. Dashed circle indicates the clustering of Dicer1fl/fl samples. (C-H) Box and whiskers plots of β-diversity distances between microbial communities comparing individuals within Dicer1fl/fl mice and between Dicer1ΔIEC individual mice. (C-G) β-diversity at family level: (C and D) of the whole microbiota; (E) the bacterial family Prevotellaceae; (F) the bacterial family Porphyromonadaceae; (G) the bacterial family Lachnospiraceae. (H) β-diversity at the genus level. (C-H) the specific distance metric used in each analysis is indicated on the axes. Values are: box: median, whiskers: min to max, p-value: non-parametric t-test). See also Figure S2 and Table S5. Related to Figure 6.
Figure 4
Figure 4. Host miRNA Directly Affects the Growth of Gut Bacteria
Based on pilot culture experiments (see Figure S3C, Figure S3F), (A) Fn was grown in media with 1.25 μM miRNA mimics hsa-miR-515-5p, mutated hsa-miR-515-5p, scrambled control and hsa-miR-1226-5p. Growth was monitored as absorbance at 600 nm (OD600) once per hour for 24 hours. Representative growth curves of 5 independent experiments with triplicates are presented. See Figure S3D for additional growth curves. (B) E. coli was grown in media with 2 μM miRNA mimics hsa-miR-1226-5p, mutated hsa-miR-1226-5p, scrambled control and hsa-miR-515-5p. Growth was monitored as absorbance at 600 nm (OD600) once per hour for 8 hours. Representative growth curves of 5 independent experiments with duplicates are presented. See Figure S3G for additional growth curves. Upper panels show target site sequence alignment of hsa-miR-515-5p and mutant (mutant site highlighted) vs Fn 16S rRNA (A) and hsa-miR-1226-5p and mutant vs E. coli yegH sequence (B). *: Growth differs from other groups in 5 consecutive experiments. Related to Figure S3 and Table S6.
Figure 5
Figure 5. Host miRNA Enters Bacteria and Specifically Regulates Bacterial Gene Transcripts
(A-D) E. coli GFP (Green) was cultured in the presence of 2 μM Cy3-labeled (red) hsamiR-1226-5p, scrambled hsa-miR-1226-5p control or hsa-miR-515-5p for 4 hours and washed with PBS, and fixed in 2% PFA, followed by nucleic acid staining with DAPI (Blue). Images were acquired by confocal microscopy with a 100x objective. Merged channel and orthogonal view were processed with Fiji/ImageJ. Scale bars, 10 μm. Representative of 2 experiments (See also Movie S1). (E) Fn was cultured in the presence of 1.25 μM Cy3-labeled (red) hsa-miR-515-5p, scrambled hsa-miR-515-5p control or hsa-miR-1226-5p for 0, 5 min, 6 hrs and 12 hrs and terminated on ice, washed once with cold PBS and fixed with 2% PFA; followed by flow cytometry detection of Cy3 in the bacteria. The percentage of Cy3-miR positive Fn is shown. Representative of 2 experiments. (F) E. coli GFP was cultured in the presence of 2 μM Cy3-labeled (red) hsa-miR-1226-5p, scrambled hsa-miR-1226-5p control or hsa-miR-515-5p for 0, 5 min, 2 hrs and 4 hrs and terminated on ice, washed once with cold PBS and fixed with 2% PFA; followed by flow cytometry detection of Cy3 in the GFP+ E. coli. The percentage of Cy3-miR positive E. coli is shown. Representative of 2 experiments. (G) Fn was cultured in the presence of vehicle, 1.25 μM scrambled hsa-miR-515-5p control, hsa-miR-515-5p, mutated hsa-miR-515-5p, or hsa-miR-1226-5p for 16 hours. RNA was isolated and the ratio of Fn 16S rRNA/ 23S rRNA transcript level of was quantified by qPCR. (H) E. coli was cultured in the presence of vehicle, 1.25 μM scrambled hsa-miR-1226-5p control, hsa-miR-1226-5p, mutated hsa-miR-1226-5p, or hsa-miR-515-5p for 4 hours. RNA was isolated and transcript levels of E. coli yegH were quantified by qPCR. (G-H) Values are mean ± SEM, One-way ANOVA followed by Dunnett's multiple comparison tests. *p<0.05, **p<0.01, ***p<0.001, ****p<0.0001. Data summarize 3 independent experiments. See also Figure S4.
Figure 6
Figure 6. WT Fecal RNA Transplantation Restores the Fecal Microbes in IEC miRNA-deficient Mice
(A) WT (Dicer1fl/fl) or Dicer1ΔIEC Mice were gavaged Fn. The relative abundance of Fn in the mouse feces was monitored by qPCR at gavage (day 0), day 1, day 2, day 3 and day 6-post gavage. Data are mean ± SEM, t-test, n≥8 mice and 6 littermate pairs per group, summary of two independent experiments. (B) Schematic diagram of fecal RNA transplantation that applies to (C-P): Donor fecal RNA (feRNA) was isolated from Dicer1fl/fl or Dicer1ΔIEC mice and was transferred by gavage once daily (q.d.) for 7 days to Dicer1ΔIEC recipient mice (Recipt), one donor to one recipient. (C-F) Bacterial 16S rDNA sequence-based UniFrac similarity matrix of the 18 recipient mice (n=8 Dicer1fl/fl fecal RNA recipients, 8 Dicer1ΔIEC fecal RNA recipients) was performed on the feces and compared with naïve mice as presented in Figure 3 of the Dicer1fl/fl and Dicer1ΔIEC mice. (C and E) Principal coordinates analysis (PCoA) of weighted UniFrac values of 4 groups. Each point represents one mouse sample and each sample is colored according to gene background or treatment. (C) Weighted UniFrac PCoA clustering results for all bacteria. (E) Weighted UniFrac PCoA clustering results for the family of Porphyromonadaceae. (D and F) Box and whiskers plots of β-diversity unifrac values between individuals within Dicer1fl/fl fecal RNA recipients and between Dicer1ΔIEC fecal RNA recipients of all bacteria (D) and the bacterial family Porphyromonadaceae (F). (Values are: box: median, whiskers: min to max, p-value: non-parametric t-test). (G-P) Symbiotic bacteria SFB (G), E. coli (H), B. fragilis (I) loads in the naïve Dicer1fl/fl and Dicer1ΔIEC mouse feces, as well as in the feces of Dicer1ΔIEC mice received fecal RNA, were determined and the loads of the bacterial OTU00015 (J), OTU00025 (K), OTU00045 (L), OTU00145 (M), OTU00150 (N), OTU00190 (O) and OTU00192 (P) as tagged in Figure S2E were determined by qPCR (naïve group, n≥11, fecal RNA transplanted group, n=8). (Values are mean ± SEM, t-test). (Q) C57BL/6J mice were administrated 200 nM indicated synthesized miRNA mimics in drinking water for 48 hours and the relative abundance of E. coli in the feces was determined by qPCR (n=5, scatter dot plot with line at median, One-way ANOVA followed by Dunnett's multiple comparison tests. *p<0.05, **p<0.01). Related to Figure 3 and Figure S5.
Figure 7
Figure 7. IEC miRNA-deficiency is Associated with Exacerbated DSS Colitis and is Rescued Following WT Fecal RNA Transplantation
(A to C) 6-wk-old gender-matched Dicer1fl/fl and Dicer1ΔIEC littermates were treated with 3% DSS in drinking water for 7 days. (A) Percentile change of body weight (BW). Linear regression curves of the BW change are shown at right panel (Values are mean ± SEM, p< 0.0001 between groups); (B) Colonic length (Values are mean ± SEM, p= 0.0003 between groups, t-test); (C) Histologic analysis (H&E) at day 9 post DSS administration (n = 8, represents two independent experiments). (D-G), (D) Schematic diagram of fecal RNA transfer and colitis induction: Donor fecal RNA was isolated from Dicer1fl/fl (n=8) or Dicer1ΔIEC (n=8) mice feces and was administrated by gavage to Dicer1ΔIEC recipient mice, once daily (q.d.) for 7 days. Colitis was then induced by applying 3% DSS in drinking water for another 7 days. In the recipients, (E) Body weight change (Values are mean ± SEM, p< 0.0001 between groups); (F) Colonic length (Values are mean ± SEM, p= 0.0322 between groups, t-test); and (G) histologic analysis (H&E) at day 9 post DSS administration were analyzed. Related to Figure S6.

Comment in

Similar articles

Cited by

References

    1. Ahmed FE, Jeffries CD, Vos PW, Flake G, Nuovo GJ, Sinar DR, Naziri W, Marcuard SP. Diagnostic microRNA markers for screening sporadic human colon cancer and active ulcerative colitis in stool and tissue. Cancer Genomics Proteomics. 2009;6:281–295. - PubMed
    1. An D, Oh SF, Olszak T, Neves JF, Avci FY, Erturk-Hasdemir D, Lu X, Zeissig S, Blumberg RS, Kasper DL. Sphingolipids from a Symbiotic Microbe Regulate Homeostasis of Host Intestinal Natural Killer T Cells. Cell. 2014;156:123–133. - PMC - PubMed
    1. Banerjee RR, Lazar MA. Dimerization of resistin and resistin-like molecules is determined by a single cysteine. J. Biol. Chem. 2001;276:25970–25973. - PubMed
    1. Bartel DP. MicroRNAs: target recognition and regulatory functions. Cell. 2009;136:215–233. - PMC - PubMed
    1. Belkaid Y, Naik S. Compartmentalized and systemic control of tissue immunity by commensals. Nat Immunol. 2013;14:646–653. - PMC - PubMed

Publication types