. 2016 Jan 14;12(1):e1005399.
doi: 10.1371/journal.ppat.1005399. eCollection 2016 Jan.

Replication of an Autonomous Human Parvovirus in Non-dividing Human Airway Epithelium Is Facilitated through the DNA Damage and Repair Pathways

Affiliations

Replication of an Autonomous Human Parvovirus in Non-dividing Human Airway Epithelium Is Facilitated through the DNA Damage and Repair Pathways

Xuefeng Deng et al. PLoS Pathog. .

Abstract

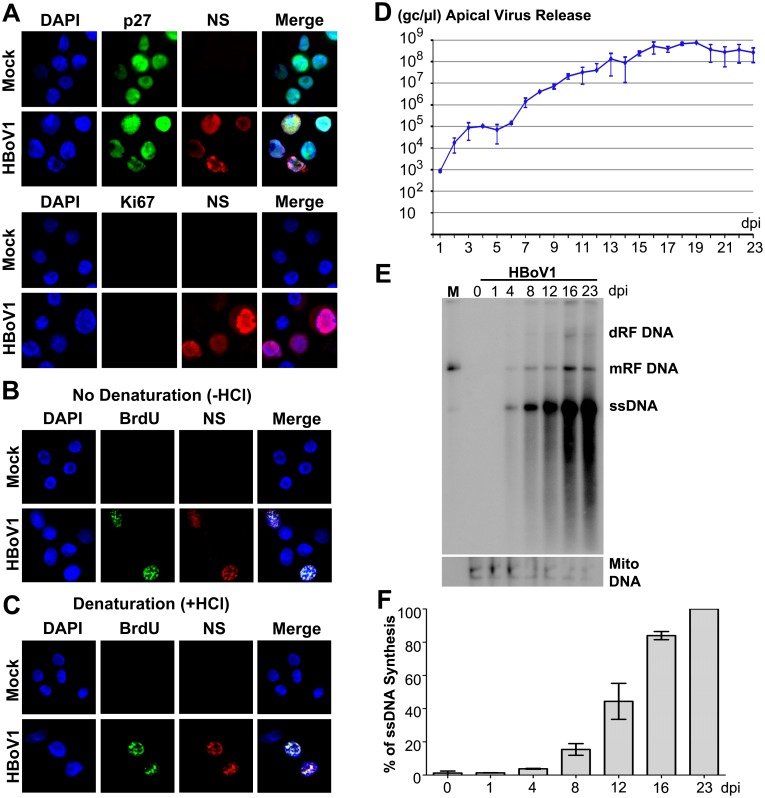
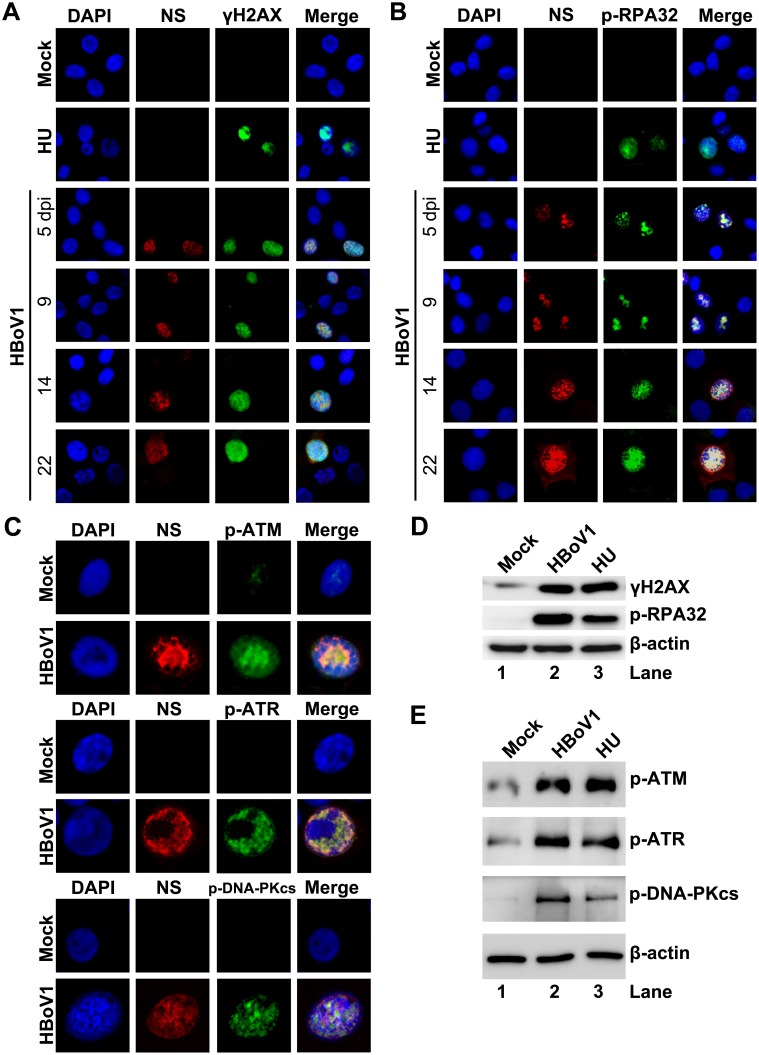
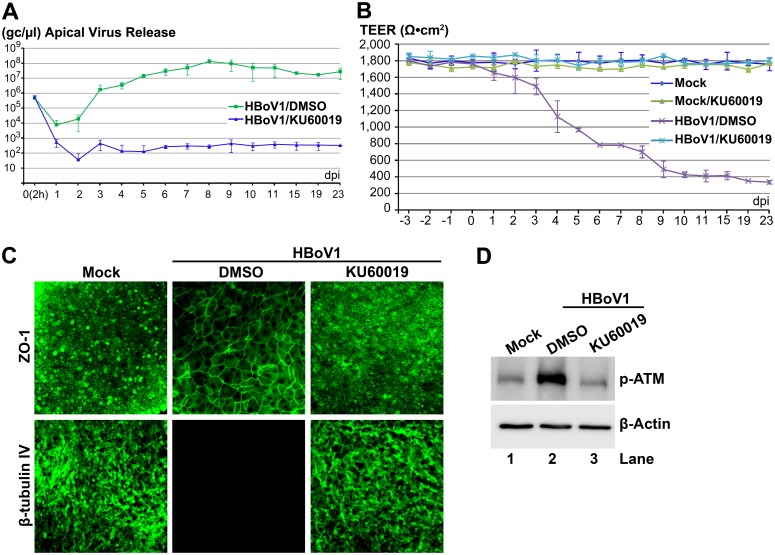
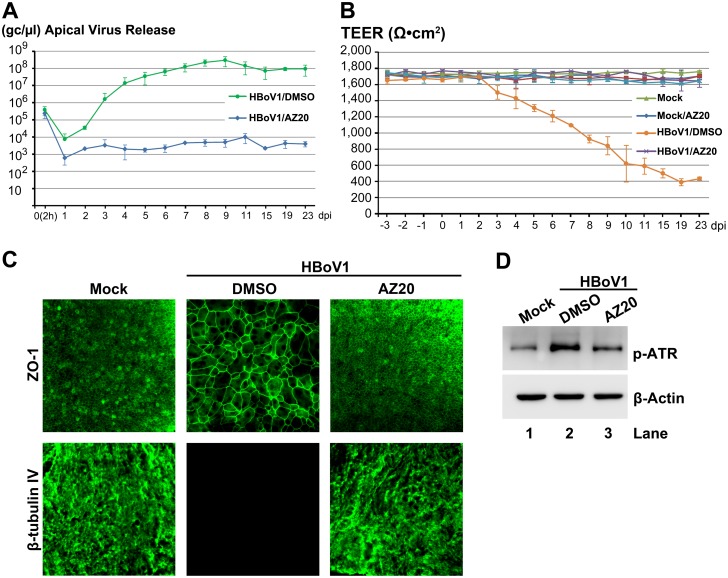
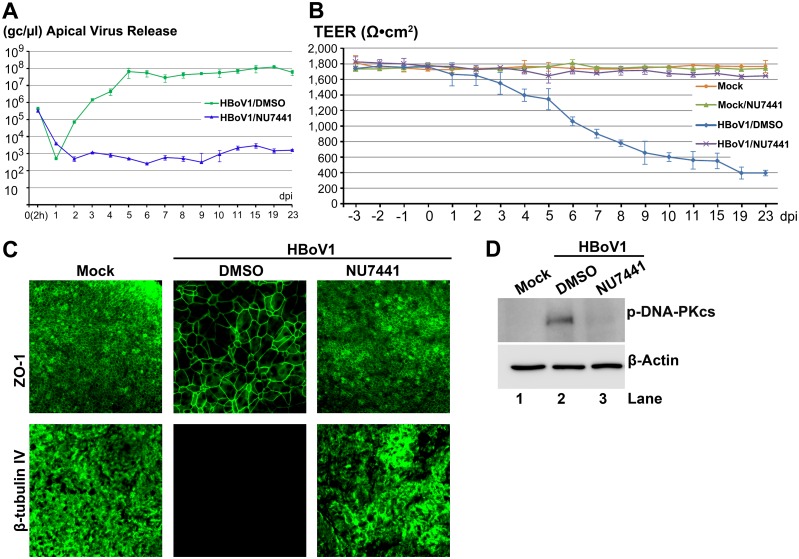
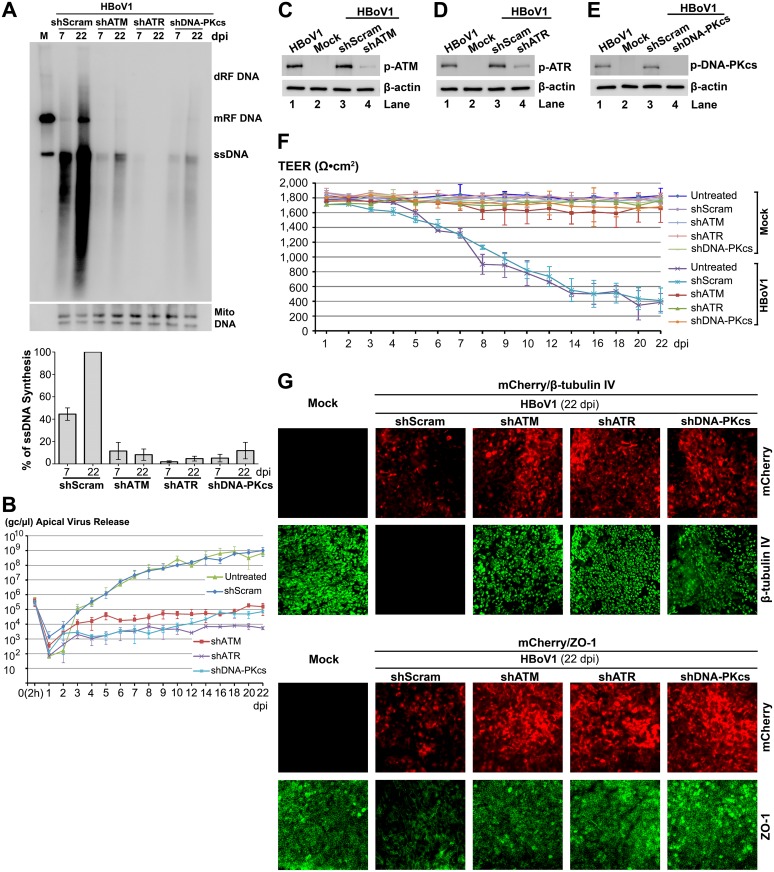
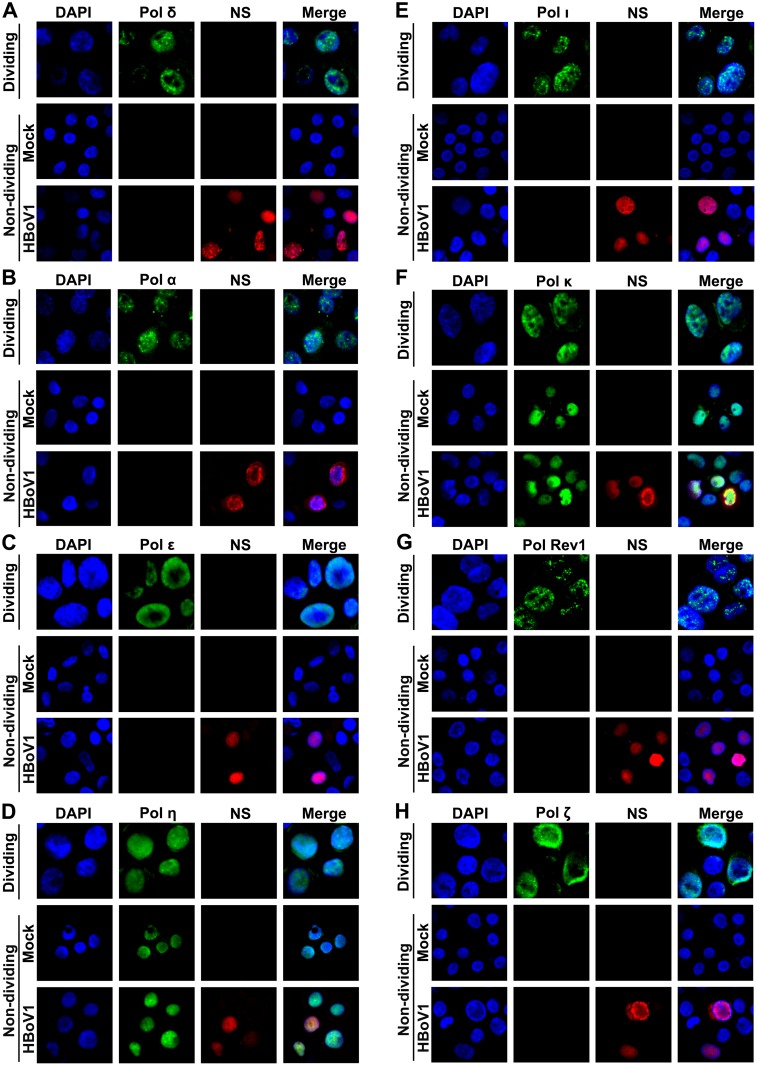
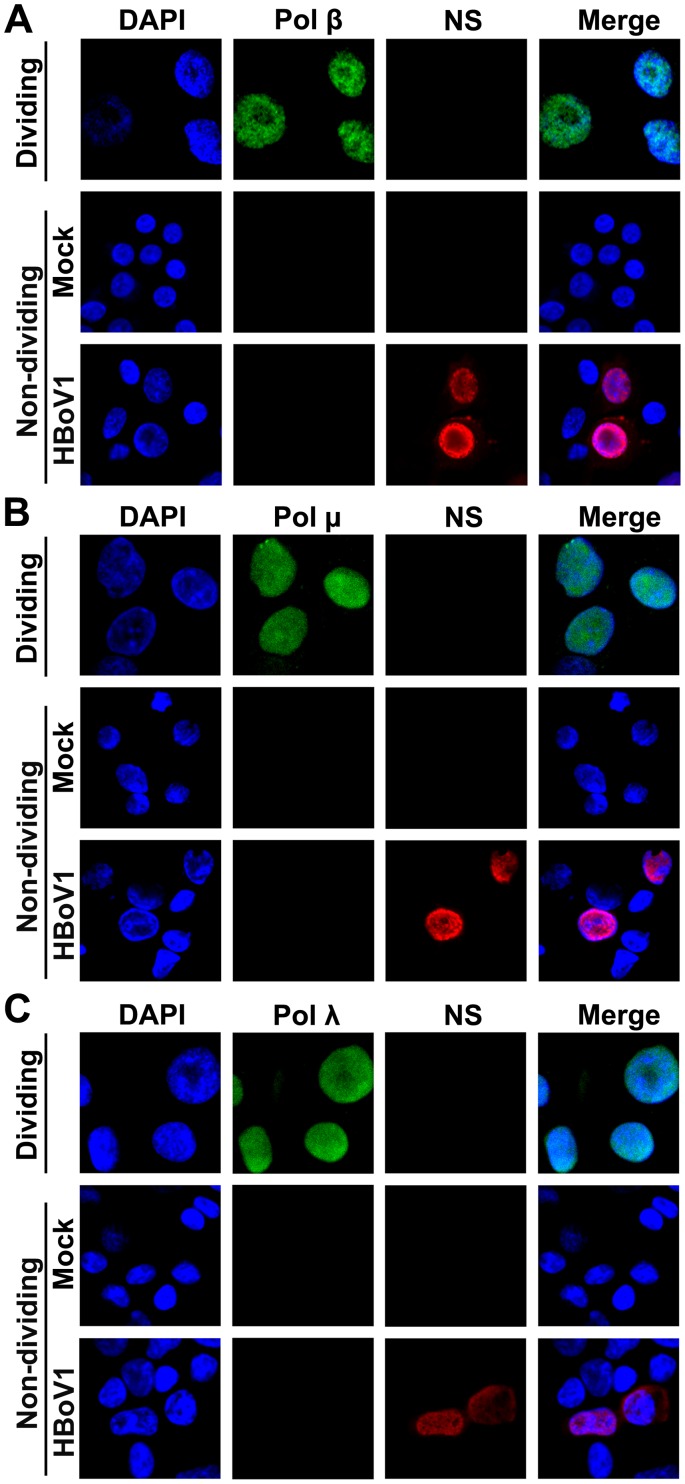
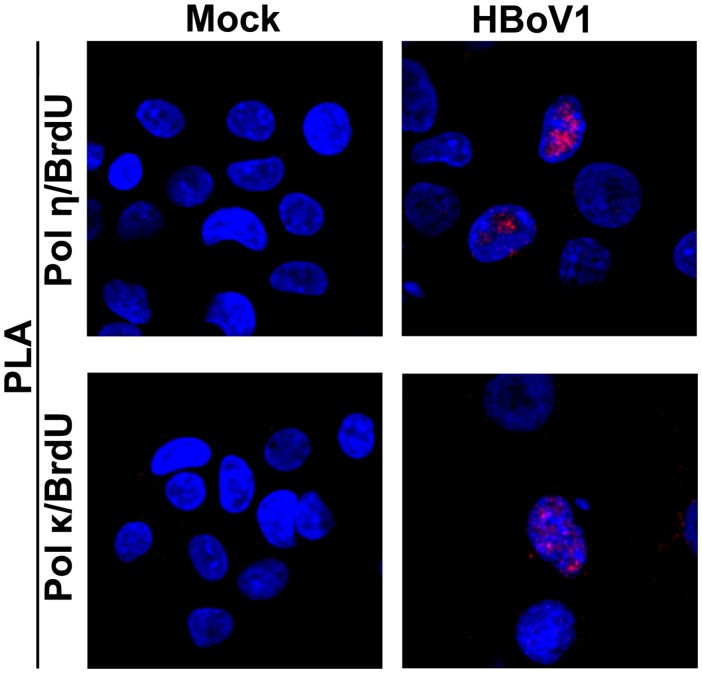
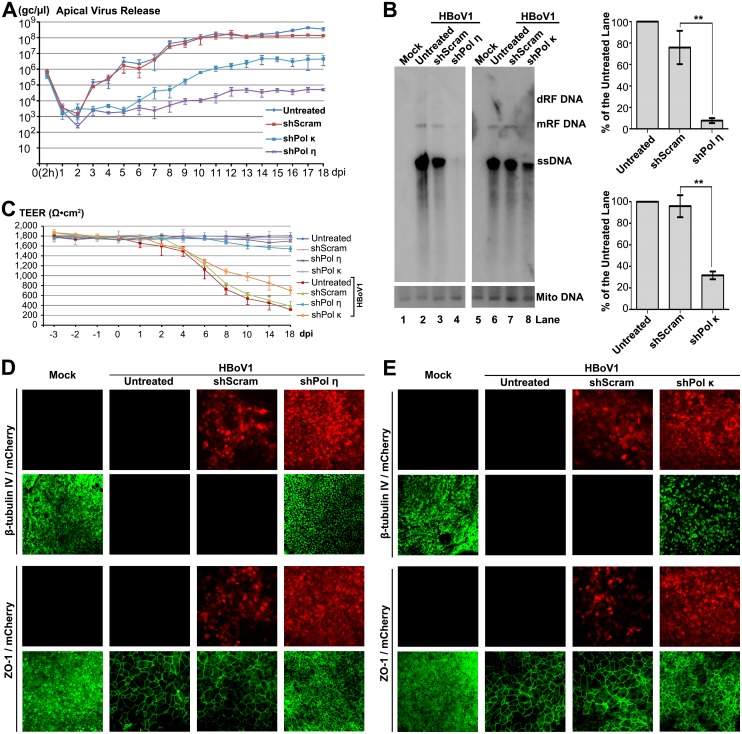
Human bocavirus 1 (HBoV1) belongs to the genus Bocaparvovirus of the Parvoviridae family, and is an emerging human pathogenic respiratory virus. In vitro, HBoV1 infects well-differentiated/polarized primary human airway epithelium (HAE) cultured at an air-liquid interface (HAE-ALI). Although it is well known that autonomous parvovirus replication depends on the S phase of the host cells, we demonstrate here that the HBoV1 genome amplifies efficiently in mitotically quiescent airway epithelial cells of HAE-ALI cultures. Analysis of HBoV1 DNA in infected HAE-ALI revealed that HBoV1 amplifies its ssDNA genome following a typical parvovirus rolling-hairpin DNA replication mechanism. Notably, HBoV1 infection of HAE-ALI initiates a DNA damage response (DDR) with activation of all three phosphatidylinositol 3-kinase-related kinases (PI3KKs). We found that the activation of the three PI3KKs is required for HBoV1 genome amplification; and, more importantly, we identified that two Y-family DNA polymerases, Pol η and Pol κ, are involved in HBoV1 genome amplification. Overall, we have provided an example of de novo DNA synthesis (genome amplification) of an autonomous parvovirus in non-dividing cells, which is dependent on the cellular DNA damage and repair pathways.


Conflict of interest statement

The authors have declared that no competing interests exist.

Figures

Fig 1
Fig 1. HBoV1 replicates in non-dividing airway epithelial cells of HAE-ALI cultures.
(A) HBoV1 infection of non-dividing cells. At 12 dpi, both mock- and HBoV1-infected cells of HAE-ALI cultures were trypsinized off the inserts, cytospun onto a slide, and analyzed by IF with anti-HBoV1 NS1C and anti-p27 antibodies, and with anti-NS1C and anti-Ki67 antibodies, respectively. (B and C) Detection of HBoV1 DNA replication by BrdU incorporation assay. At 12 dpi, mock- and HBoV1-infected cells of the HAE-ALI cultures were trypsinized off the inserts, and were labeled with BrdU. The labeled cells were then cytospun onto a slide, treated without (B) or with HCl (C), as indicated. The cells were co-stained with anti-BrdU and anti-NS1C. Nuclei were stained with DAPI (blue), and the cells were visualized by confocal microscopy at a magnification of ×100. (D) Quantification of apical virus release. At the indicated dpi, the apical surface was washed with 100 μl of PBS to collect the released virus. DNase I digestion-resistant HBoV1 genome copy numbers were quantified by qPCR (Y-axis) and plotted to the dpi as shown. Means and standard deviations from three independent experiments (n = 3) are shown. (E&F) Analysis of viral DNA replication by Southern blotting. (E) At the indicated dpi, Hirt DNA samples isolated from infected-HAE-ALI cultures were analyzed by Southern blotting with a probe spanning the HBoV1 NS and Cap genes (upper panel), and with a probe specifically used to detect mitochondrial DNA (Mito DNA; lower panel), respectively. dRF DNA, double replicative form (RF) DNA; mRF DNA, monomer RF DNA; ssDNA, single stranded DNA. An HBoV1 RF DNA (M), which was digested from pIHBoV1, was used as a marker (5.4 kb). (F) The level of viral ssDNA detected in the blot was quantified and normalized to the Mito DNA detected in the same sample, and the % of the viral ssDNA relative to that at 23 dpi is shown. Averages and standard deviations (n = 3) were shown.
Fig 2
Fig 2. HBoV1 infection of HAE-ALI cultures induces phosphorylation of H2AX and RPA32 and activates ATM, ATR, and DNA-PKcs.
HAE-ALI cultures were infected with HBoV1 or mock-infected. (A, B, and C) IF analysis. (A and B) At the indicated dpi, the infected cells trypsinized off the insert were cytospun and co-immunostained with anti-NS1C and anti-γH2AX (A), and with anti-NS1C and anti-p-RPA32 (B). (C) At 10 dpi, infected cells trypsinized off the ALI membrane were used for IF analysis with anti-NS1C and p-ATM, with anti-NS1C and anti-p-ATR, and with anti-NS1C and anti-p-DNA-PKcs, as indicated. Nuclei were stained with DAPI (blue), and the cells were visualized by confocal microscopy at a magnification of × 100. (D and E) Western-blot analysis. At 10 dpi, cells of the mock-, HBoV1-infected, or HU-treated HAE-ALI cultures were lysed in 1 × SDS-containing loading buffer. Equivalent volumes of the lysate were used for Western blot using anti-γH2AX, and reprobed with p-RPA32 and anti-β-actin, sequentially (D), and using with anti-p-ATM, anti-p-ATR, anti-p-DNA-PKcs, and anti-β-actin, respectively (E). HAE-ALI cultures treated with HU at a final concentration of 2 mM for 2 days were used as positive control.
Fig 3
Fig 3. An ATM-specific inhibitor decreases HBoV1 infection of HAE-ALI.
Two days prior to apical infection of HBoV1, HAE-ALI cultures were treated with KU60019 at a final concentration of 40 μM in the basolateral chamber, which was refreshed every three days along with the ALI medium in the basolateral chamber. (A) Quantification of apical virus release. At the indicated dpi, apical washes were collected and quantified for HBoV1 genome copy numbers (Y-axis), which are plotted to the dpi as shown. Averages and standard deviations (n = 3) are shown. (B) TEER measurement. At the indicated dpi, the TEER of drug-treated mock-/HBoV1-infected HAE-ALI cultures, as indicated, was measured. Means and standard deviations (n = 3) are shown. (C) IF analysis. At 23 dpi, the ALI membrane of the infected HAE-ALI cultures was stained with anti-β-tubulin IV or with anti-ZO-1, as indicated. The stained membranes were visualized for β-tubulin IV/ZO-1 (green) expression by confocal microscopy at a magnification of × 40. (D) Analysis of phosphorylated ATM. At 23 dpi, equivalent cells of the infected HAE-ALI cultures were analyzed by Western blot for expression of p-ATM and β-actin, respectively.
Fig 4
Fig 4. An ATR-specific inhibitor decreases HBoV1 infection of HAE-ALI.
At two days prior to infection, HAE-ALI cultures were treated with AZ20 at 20 μM from the basolateral side. The treated cultures were then infected with HBoV1. (A) Quantification of apical virus release. At the indicated dpi, the apical washes were quantified for HBoV1 genome copies by qPCR (Y-axis) and plotted to the dpi as shown. Means and standard deviations (n = 3) are shown. (B) TEER measurement. At the indicated dpi, the TEER of infected HAE-ALI cultures, as indicated, was measured. Means and standard deviations (n = 3) are shown. (C) IF analysis. At 23 dpi, the ALI membrane of the infected HAE-ALI cultures were stained with anti-β-tubulin IV or with anti-ZO-1, as indicated. The stained membranes were visualized for β-tubulin IV/ZO-1 (green) expression by confocal microscopy at a magnification of × 40. (D) Analysis of phosphorylated ATR. At 23 dpi, equivalent cells of the infected HAE-ALI cultures were analyzed by Western blot for expression of p-ATR and β-actin, respectively.
Fig 5
Fig 5. A DNA-PKcs-specific inhibitor decreases HBoV1 infection of HAE-ALI.
At two days prior to apical infection of HBoV1, HAE-ALI cultures were incubated with NU7441 at 20 μM in the basolateral chamber. (A) Quantification of apical virus release. At the indicated dpi, apical washes were quantified for HBoV1 genome copies qPCR (Y-axis) and plotted to the dpi as shown. Means and standard deviations (n = 3) are shown. (B) TEER measurement. At the indicated dpi, the TEER of infected HAE-ALI cultures, as indicated, was determined. Means and standard deviations (n = 3) are shown. (C) IF analysis. At 23 dpi, the ALI membrane of the infected HAE-ALI cultures was stained with anti-β-tubulin IV or with anti-ZO-1, as indicated. The stained membranes were visualized for β-tubulin IV/ZO-1 (green) expression by confocal microscopy at a magnification of × 40. (D) Analysis of phosphorylated DNA-PKcs. At 23 dpi, equivalent cells of the infected HAE-ALI cultures were analyzed by Western blotting for expression of p-DNA-PKcs and β-actin, respectively.
Fig 6
Fig 6. ATM-, ATR-, and DNA-PKcs-specific shRNAs inhibit HBoV1 DNA replication and attenuate the epithelial damage caused by HBoV1 infection.
The HAE-ALI cultures, which expressed shScram, shATM, shATR, and shDNA-PKcs, as indicated, were infected with HBoV1. (A) Southern blot analysis of viral DNA replication. At the indicated dpi, Hirt DNA was extracted from infected cultures and analyzed by Southern blotting using the HBoV1 NSCap probe (upper) and the mitochondrial DNA probe (lower). A representative blot is shown. The level of viral ssDNA detected in the blot was further quantified and normalized to the Mito DNA detected in the same sample. The % of the viral ssDNA relative to that of the shScram-applied sample at 22 dpi is shown. Averages and standard deviations (n = 3) were shown at the bottom. (B) Quantification of apical virus release. At the indicated dpi, apical washes were quantified for HBoV1 genome copy numbers by qPCR (Y-axis) and plotted to the dpi as shown. Means and standard deviations (n = 3) are shown. (C, D, and E) Western blot analysis of p-ATM, p-ATR, and p-DNA-PKcs expression. At 22 dpi, cells in the infected HAE-ALI cultures were analyzed by Western blotting for expression of p-ATM (C), p-ATR (D) and p-DNA-PKcs (E). β-actin was probed as a loading control. (F) TEER measurement. At the indicated dpi, the TEER of infected HAE-ALI cultures, as indicated, was measured. Means and standard deviations (n = 3) are shown. (G) IF analysis. At 22 dpi, mock-infected and HBoV1-infected HAE-ALI cultures transduced with various shRNA/mCherry-expressing lentiviruses, as indicated, were stained with anti-β-tubulin IV or with anti-ZO-1. The stained membranes were visualized for β-tubulin IV/ZO-1 (green) and mCherry (red) expression by confocal microscopy at a magnification of × 40.
Fig 7
Fig 7. IF analysis of DNA polymerases, Pol δ, Pol α, Pol ε, Pol η, Pol ι, Pol κ, REV1, and Pol ζ, in the cells of HAE-ALI.
HAE-ALI cultures, labeled as “Non-dividing,” were infected with HBoV1 or mock-infected. At 12 dpi, HAE cells trypsinized off the Transwell inserts were analyzed by IF using anti-Pol δ (A), anti-Pol α (B), anti-Pol ε (C), anti-Pol η (D), anti-Pol ι (E), anti-Pol κ (F), anti-Pol Rev1 (G), and anti-Pol ζ (H) antibodies. Primary airway epithelial cells, labeled as “Dividing,” cultured as monolayer in a flask were stained with the above antibodies as antibody positive control. Nuclei were stained with DAPI (blue), and the stained cells were visualized by confocal microscopy at a magnification of ×100.
Fig 8
Fig 8. IF analysis of DNA polymerases, Pol β, Pol μ, and Pol λ, in the cells of HAE-ALI.
HAE-ALI cultures, labeled as “Non-dividing,” were infected with HBoV1 or mock-infected. At 12 dpi, HAE cells trypsinized off the Transwell inserts were analyzed by IF using anti-Pol β (A), anti-Pol μ (B), and anti-Pol λ (C) antibodies. Primary airway epithelial cells, labeled as “Dividing,” cultured as monolayer in a flask were stained with the above antibodies as antibody positive control. Nuclei were stained with DAPI (blue), and the stained cells were visualized by confocal microscopy at a magnification of ×100.
Fig 9
Fig 9. Pol η and Pol κ colocalize with the replicating HBoV1 genome.
HAE-ALI cultures were infected with HBoV1 or mock-infected. At 12 dpi, infected HAE cells were trypsinized off the Transwell insert, and labeled with BrdU. The treated cells were then cytospun onto a slide, and were co-stained with a mouse anti-BrdU and a rabbit anti-Pol η antibody, or with a mouse anti-BrdU and a rabbit anti-Pol κ antibody. Proximity ligation assay (PLA) was performed following the manufacturer’s instructions. Amplified signals were visualized by confocal microscopy at a magnification of ×100.
Fig 10
Fig 10. Pol η- and Pol κ-specific shRNAs inhibit HBoV1 DNA replication and attenuate the epithelial damage caused by HBoV1 infection.
The HAE-ALI cultures either untreated or treated with shScram, shPol η, and shPol κ, as indicated, were infected with HBoV1. (A) Quantification of apical virus release. At the indicated dpi, daily apical washes were quantified for viral genome copies, which are plotted to the dpi as shown. Means and standard deviations (n = 3) are shown. (B) Southern blot analysis of viral DNA replication. At 18 dpi, Hirt DNA samples were extracted from infected cultures, and analyzed for viral DNA (upper) by Southern blot. Mito DNA was probed as a recovery control. A representative blot is shown. The levels of viral ssDNA in the blot were quantified and normalized to the level of Mito DNA in the same sample. The % of the viral ssDNA relative to that of the “Untreated” sample is shown. Averages and standard deviations (n = 3) were shown to the right. P values are calculated using a Student’s “t” test (** P<0.05). N.S. (P>0.1) indicates no statistically significant difference. (C) TEER measurement. At the indicated dpi, the TEER of infected HAE-ALI cultures, which expressed various shRNAs, as indicated, was measured. Means and standard deviations (n = 3) are shown. (D and E) IF analysis. At 18 dpi, infected HAE-ALI was stained with anti-β-tubulin IV or with anti-ZO-1. The stained membranes were visualized for β-tubulin IV/ZO-1 (green) and mCherry (red) expression by confocal microscopy at a magnification of × 40.

Similar articles

Cited by

References

    1. Allander T, Tammi MT, Eriksson M, Bjerkner A, Tiveljung-Lindell A, Andersson B (2005) Cloning of a human parvovirus by molecular screening of respiratory tract samples. Proc Natl Acad Sci U S A 102: 12891–12896. - PMC - PubMed
    1. Cotmore SF, Agbandje-McKenna M, Chiorini JA, Mukha DV, Pintel DJ, Qiu J, Soderlund-Venermo M, Tattersall P, Tijssen P, Gatherer D, Davison AJ (2014) The family Parvoviridae. Arch Virol 159: 1239–1247. 10.1007/s00705-013-1914-1 - DOI - PMC - PubMed
    1. Allander T, Jartti T, Gupta S, Niesters HG, Lehtinen P, Osterback R, Vuorinen T, Waris M, Bjerkner A, Tiveljung-Lindell A, van den Hoogen BG, Hyypia T, Ruuskanen O (2007) Human bocavirus and acute wheezing in children. Clin Infect Dis 44: 904–910. - PMC - PubMed
    1. Meriluoto M, Hedman L, Tanner L, Simell V, Makinen M, Simell S, Mykkanen J, Korpelainen J, Ruuskanen O, Ilonen J, Knip M, Simell O, Hedman K, Soderlund-Venermo M (2012) Association of Human Bocavirus 1 Infection with Respiratory Disease in Childhood Follow-up Study, Finland. Emerg Infect Dis 18: 264–271. 10.3201/eid1802.111293 - DOI - PMC - PubMed
    1. Kantola K, Hedman L, Allander T, Jartti T, Lehtinen P, Ruuskanen O, Hedman K, Soderlund-Venermo M (2008) Serodiagnosis of human bocavirus infection. Clin Infect Dis 46: 540–546. 10.1086/526532 - DOI - PMC - PubMed

Publication types