Clinical Trial
. 2016 Jan;3(1):e22-9.
doi: 10.1016/S2352-3026(15)00227-6. Epub 2015 Dec 17.

Alemtuzumab in T-cell large granular lymphocytic leukaemia: interim results from a single-arm, open-label, phase 2 study

Affiliations
Clinical Trial

Alemtuzumab in T-cell large granular lymphocytic leukaemia: interim results from a single-arm, open-label, phase 2 study

Bogdan Dumitriu et al. Lancet Haematol. 2016 Jan.

Abstract

Background: T-cell large granular lymphocytic leukaemia (T-LGL) is a lymphoproliferative disease that presents with immune-mediated cytopenias and is characterised by clonal expansion of cytotoxic CD3+ CD8+ lymphocytes. Use of methotrexate, ciclosporin, or cyclophosphamide as first therapy improves cytopenias in 50% of patients, but long-term use of these can lead to toxicity. We aimed to explore the activity and safety of alemtuzumab, an anti-CD52 monoclonal antibody, in patients with T-LGL.

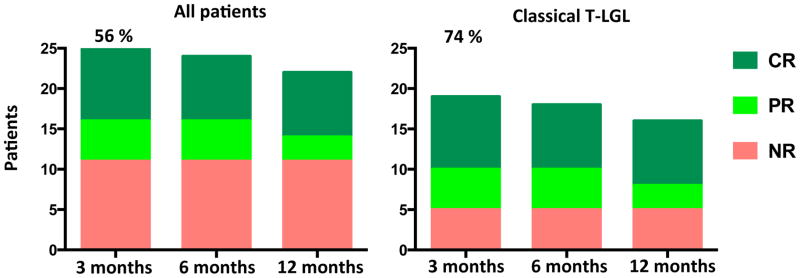
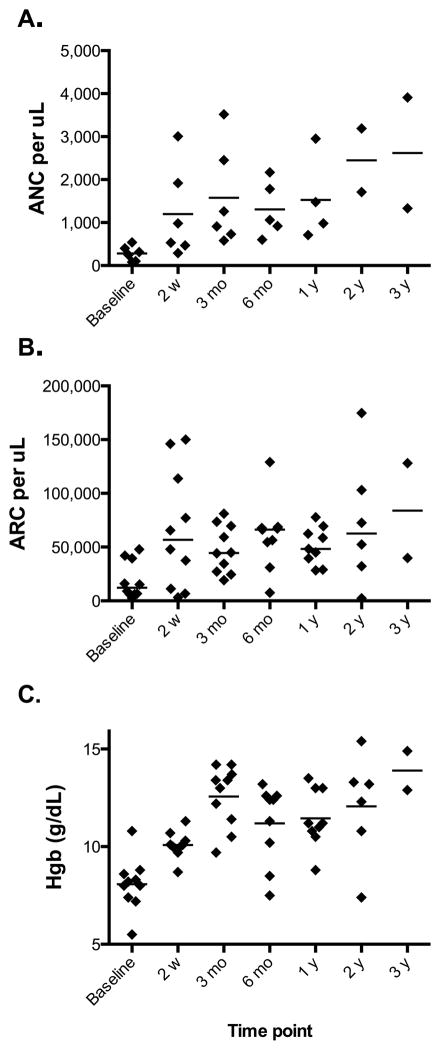
Methods: We did this single-arm, phase 2 trial in consecutively enrolled adults with T-LGL referred to the National Institutes of Health in Bethesda, MD, USA. Alemtuzumab was given intravenously at 10 mg per day for 10 days. The primary endpoint was haematological response at 3 months after infusion. A complete response was defined as normalisation of all affected lineages, and a partial response was defined in neutropenic patients as 100% increase in the absolute neutrophil count to more than 5 × 10(8) cells per L, and in those with anaemia, as any increase in haemoglobin of 20 g/L or higher observed in at least two serial measurements 1 week apart and sustained for 1 month or longer without exogenous growth factors support or transfusions. Analysis was by intention to treat. We report results from the first stage of this Simon two-stage design trial; enrolment into the second stage is continuing. This study is registered with ClinicalTrials.gov, number NCT00345345.

Findings: From Oct 1, 2006, to March 1, 2015, we enrolled 25 patients with T-LGL. 14 patients (56%; 95% CI 35-76) had a haematological response at 3 months. Four patients with associated myelodysplastic syndrome and two who had received haemopoietic stem cell transplantation had either no response or were not evaluable, meaning 14 (74% [49-91]) of the 19 patients with classic T-LGL responded. All patients had an infusion reaction (24 [96%] patients grade 1-2, one [4%] patient grade 3), which improved with symptomatic therapy. All patients developed lymphopenia, with 22 (88%) patients having grade 3 or 4 lymphopenia. The other most common grade 3 and 4 adverse events were leukopenia (eight [32%]) and neutropenic infections (five [20%]). Seven patients died; all were non-responders.

Interpretation: This is the largest and only prospective study of alemtuzumab in patients with T-LGL. The activity reported with a single course of a lymphocytotoxic drug in patients with mainly relapsed and refractory disease suggests that haematological response can be achieved without continued use of oral immunosuppression.

Funding: National Heart, Lung, and Blood Institute.


Conflict of interest statement

DISCLOSURE OF CONFLICTS

The authors have no conflicts to disclose.

Figures

Figure 1
Figure 1
Haematologic response at 3 months (primary end point) and at 6 and 12 months to treatment with alemtuzumab in all patients (n=25; left panel), and “classical” T-LGL (n=19; right panel). “Classical” T-LGL was defined as T-LGL without associated myelodysplastic syndromes (n=4) or developing after allogeneic hematopoietic stem cell transplantation (n=2). The overall response rate for all patients was 56% and for the classical T-LGL 74% as depicted above.
Figure 2
Figure 2. Blood counts in responders to alemtuzumab
A rapid and sustained improvement in absolute neutrophil count (n=6) (A) and in patients with anaemia (n=10) (B, C) was observed in over half of responding cases. In total there were 14 patients who responded at 3 months; 2 had both anaemia and neutropenia and are depicted in the corresponding panels. In relapsed patients, blood counts are depicted until the time of relapse. Scattered plot with corresponding median for each patient is depicted for each time point. ANC, absolute neutrophil count; ARC, absolute reticulocyte count; Hgb, haemoglobin.
Figure 3
Figure 3. Lymphocyte depletion and viral reactivations
Lymphodepletion affected both helper (A) and cytotoxic (B) T-lymphocytes. Available samples before alemtuzumab and at 3, 6, 12, 24, 36 and 48 months after treatment were stained for CD4+ and CD8+ markers and absolute numbers were determined based on the absolute lymphocyte count from that day. Day 0 represents baseline prior to alemtuzumab therapy. Mean ± SEM is depicted for each time point. (C) EBV and CMV reactivations following alemtuzumab. All patients were seropositive for EBV and nearly half seropositive for CMV at baseline. About half of EBV seropositive and one-third of CMV seropositive patients reactivated (bottom right panel). These reactivations were self-limited and did not associate with disease. (D) EBV and CMV viremia was monitored only until copy numbers became negative. A positive PCR was defined as more than 250 EBV copies/mL of blood or more than 250 CMV copies/mL blood. Scattered plot with peak EBV and CMV copy numbers with respective median is depicted on right lower panel.
Figure 4
Figure 4. Activation of JAK-STAT pathway and plasma cytokine profiles are abnormal in T-LGL but do not correlate with response to alemtuzumab
A) Expression of 84 genes in the JAK-STAT pathway quantified before treatment with alemtuzumab in CD8+CD57+ lymphocytes in T-LGL subjects compared to healthy volunteers. B) Plasma cytokine multiplex bead assay quantification before treatment with alemtuzumab in T-LGL subjects compared to healthy volunteers. Responders to alemtuzumab are shown as Res, non-responders N-Res, and healthy controls as HC. Heat maps of gene expression and cytokines were created by two-way hierarchical cluster analysis using Ward’s method. Red colour represents high levels, and blue colour low levels. N=14 for the plasma cytokine multiplex analysis.

Comment in

Similar articles

Cited by

References

    1. McKenna RW, Parkin J, Kersey JH, Gajl-Peczalska KJ, Peterson L, Brunning RD. Chronic lymphoproliferative disorder with unusual clinical, morphologic, ultrastructural and membrane surface marker characteristics. The American journal of medicine. 1977;62(4):588–96. - PubMed
    1. Loughran TP, Jr, Kadin ME, Starkebaum G, et al. Leukemia of large granular lymphocytes: association with clonal chromosomal abnormalities and autoimmune neutropenia, thrombocytopenia, and hemolytic anaemia. Annals of internal medicine. 1985;102(2):169–75. - PubMed
    1. Lamy T, Loughran TP., Jr How I treat LGL leukemia. Blood. 2011;117(10):2764–74. - PMC - PubMed
    1. Ahern MJ, Roberts-Thomson PJ, Bradley J, Story C, Seshadri P. Phenotypic and genotypic analysis of mononuclear cells from patients with Felty’s syndrome. Annals of the rheumatic diseases. 1990;49(2):103–6. - PMC - PubMed
    1. Pandolfi F, Loughran TP, Jr, Starkebaum G, et al. Clinical course and prognosis of the lymphoproliferative disease of granular lymphocytes. A multicenter study. Cancer. 1990;65(2):341–8. - PubMed

Publication types

Associated data