. 2016 Jan 11;29(1):5-16.
doi: 10.1016/j.ccell.2015.12.003.

The Interaction of Myc with Miz1 Defines Medulloblastoma Subgroup Identity

Affiliations

The Interaction of Myc with Miz1 Defines Medulloblastoma Subgroup Identity

BaoHan T Vo et al. Cancer Cell. .

Abstract

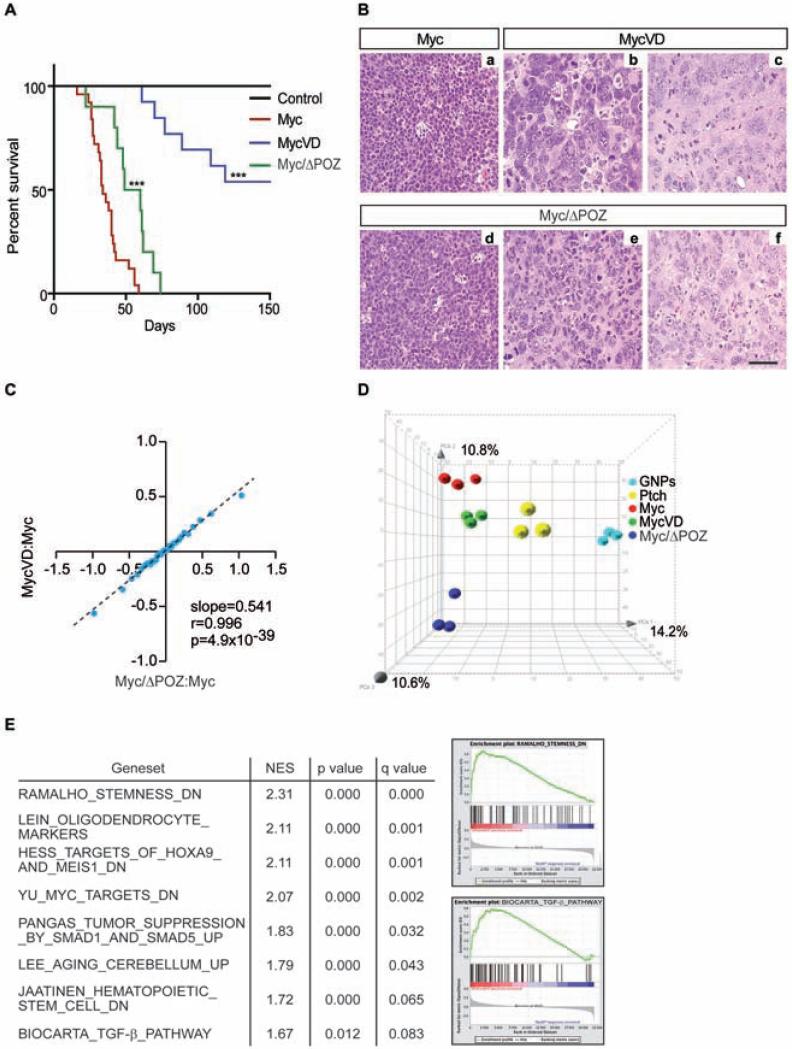
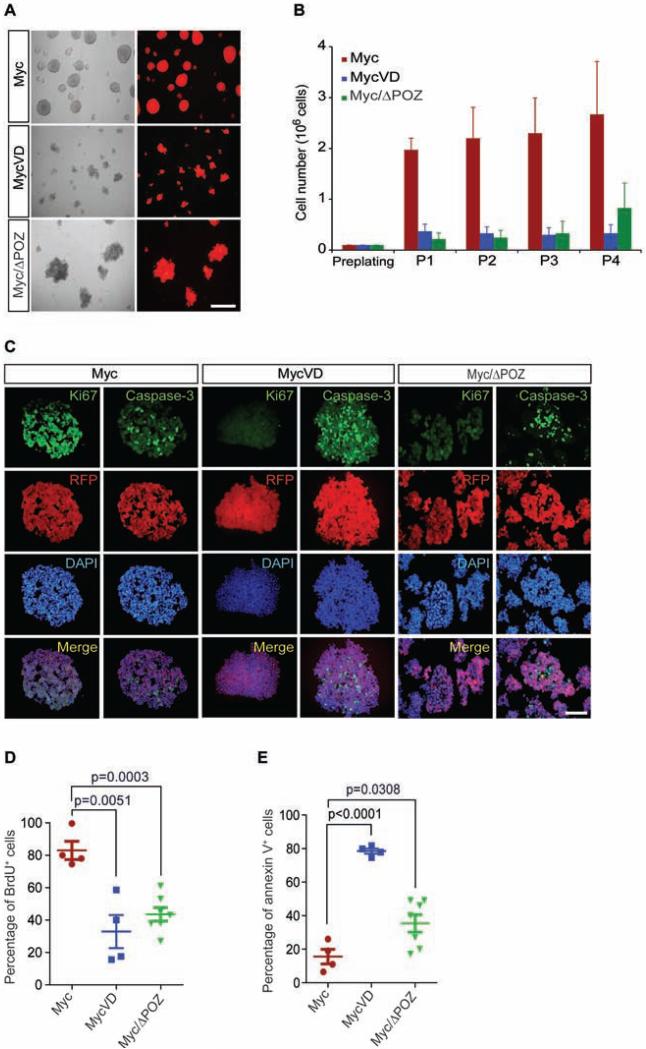
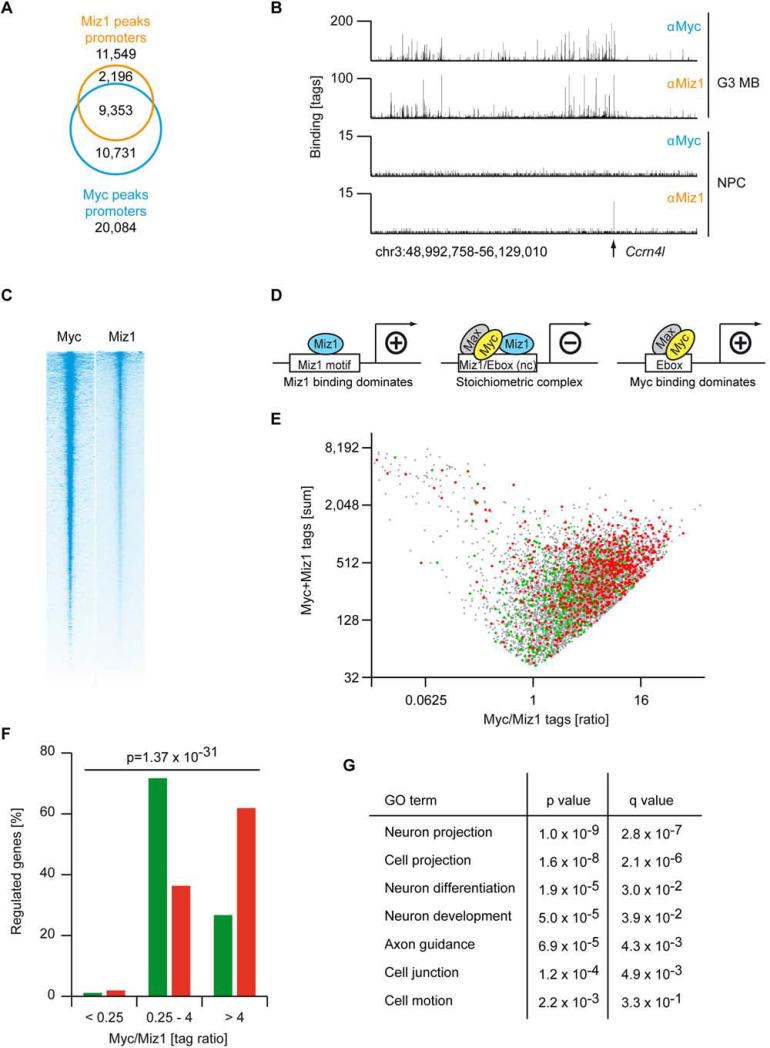
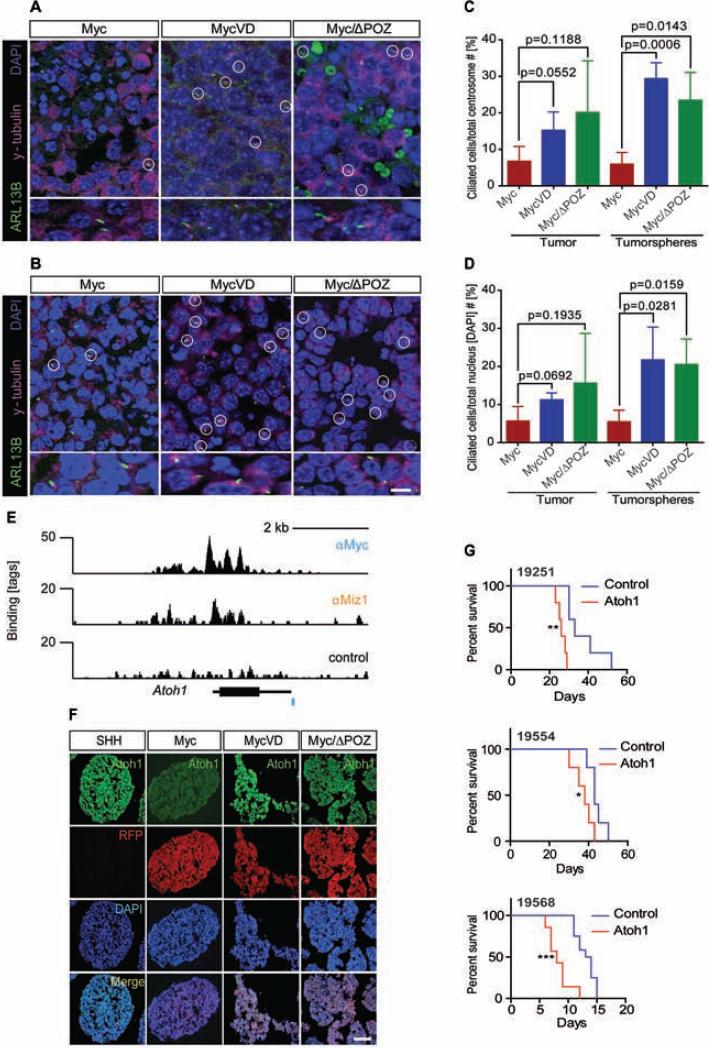
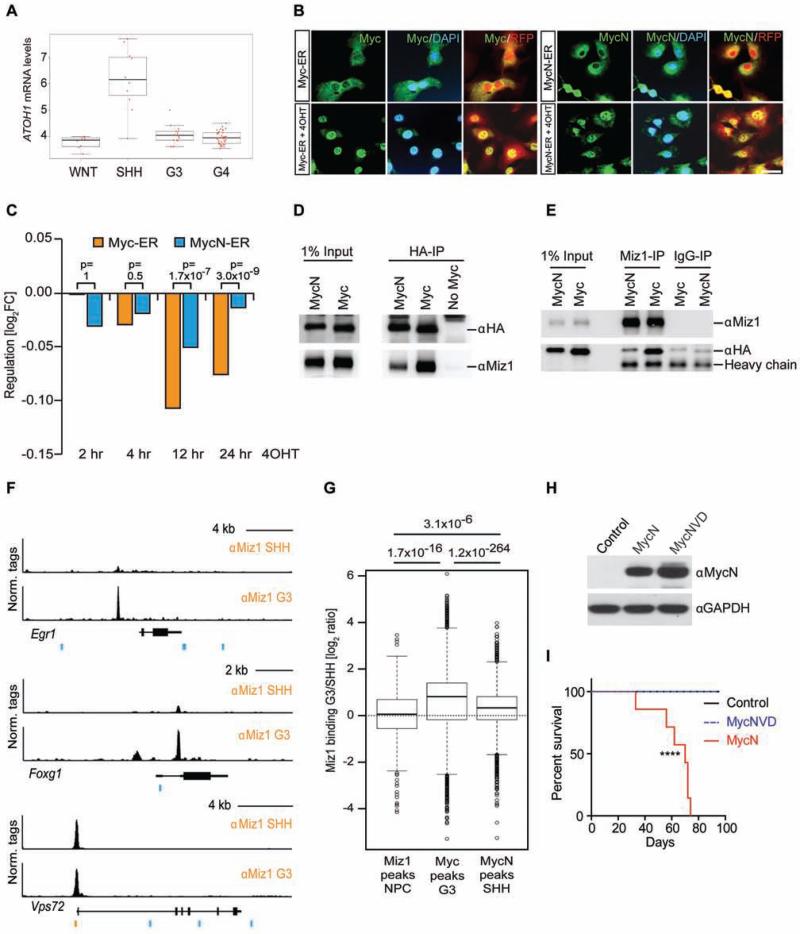
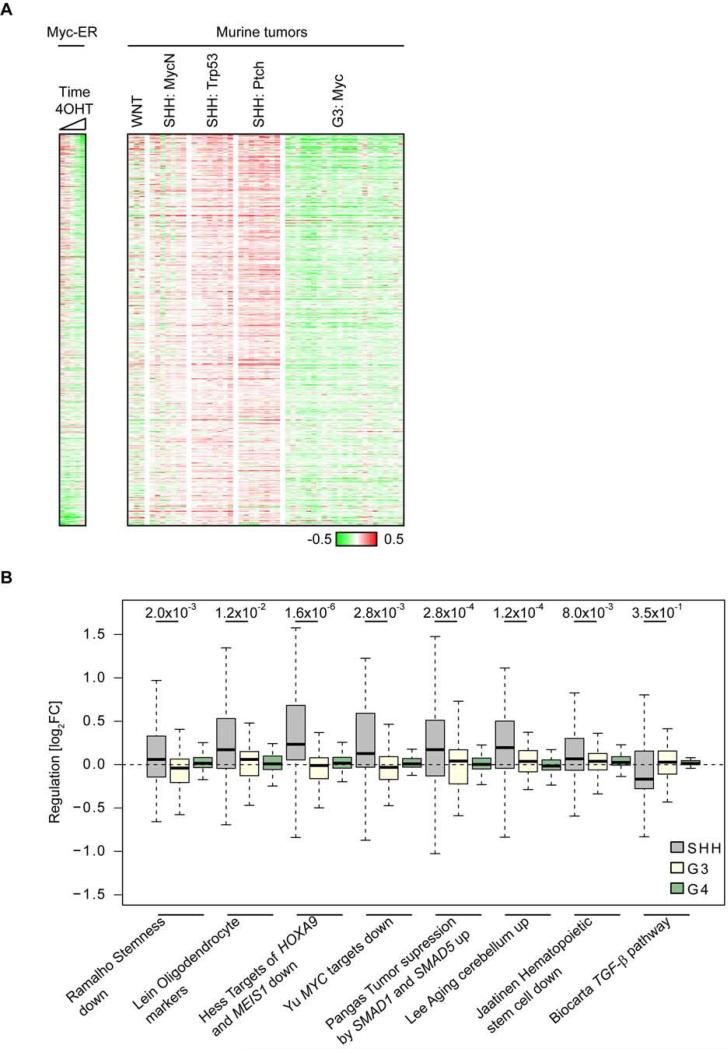
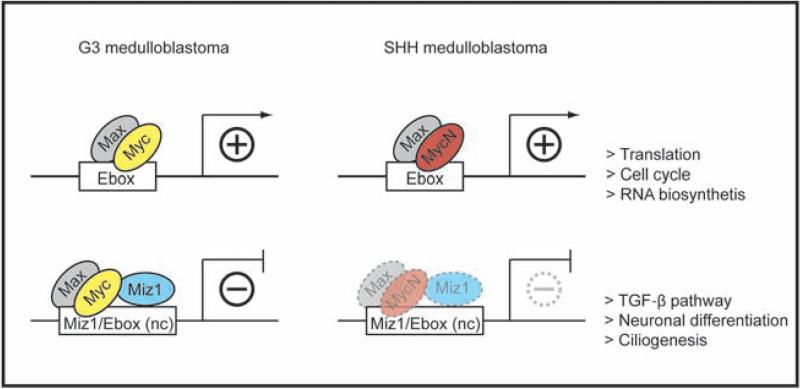
Four distinct subgroups of cerebellar medulloblastomas (MBs) differ in their histopathology, molecular profiles, and prognosis. c-Myc (Myc) or MycN overexpression in granule neuron progenitors (GNPs) induces Group 3 (G3) or Sonic Hedgehog (SHH) MBs, respectively. Differences in Myc and MycN transcriptional profiles depend, in part, on their interaction with Miz1, which binds strongly to Myc but not MycN, to target sites on chromatin. Myc suppresses ciliogenesis and reprograms the transcriptome of SHH-dependent GNPs through Miz1-dependent gene repression to maintain stemness. Genetic disruption of the Myc/Miz1 interaction inhibited G3 MB development. Target genes of Myc/Miz1 are repressed in human G3 MBs but not in other subgroups. Therefore, the Myc/Miz1 interaction is a defining hallmark of G3 MB development.


Figures

Figure 1
Figure 1. Characterization of Myc, MycVD and Myc/ΔPOZ engineered tumors
(A) Kaplan-Meier survival curves of mice transplanted with cerebellar cells purified from (i) Trp53−/−;Cdkn2c−/− mice infected with Myc (red line), MycVD (blue line), or empty vector (black line) and (ii) Myc/ΔPOZ mice infected with Myc (green line). ***, p<0.0001 MycVD or Myc/ΔPOZ versus Myc. (B) H&E staining of sections from mouse Myc, MycVD and Myc/ΔPOZ tumors: (a) An example of Myc tumors showing anaplastic morphology with cell molding and abundant mitotic figures and apoptotic bodies. (b, c) Examples of MycVD tumors showing large, pleomorphic nuclei with abundant cytoplasm. (d-f) Examples of Myc/ΔPOZ tumors showing a proliferating cell population with anaplastic/large cell features (d) or a population of cells comprised of anaplastic cells with pleomorphic nuclei with a scattering of large and bizarre nuclei and abundant cytoplasm (e, f). Morphology of the cell population in (e, f) shows an unclassifiable type. Scale bar = 100 μm. (C) Microarray analysis of gene expression induced by MycVD versus Myc and Myc/ΔPOZ versus Myc. The plot shows values of all genes by grouping them into 30 equally sized bins. The x-axis shows change in expression between tumors that arise in a Myc/ΔPOZ-background in comparison to control G3 MB, both of which are induced by overexpression of wild-type Myc. The y-axis shows changes in expression between MycVD induced tumors in comparison to Myc/G3 MB. Slope: regression coefficient, r: Pearson correlation coefficient, p value (two-tailed t-test). (D) Principal component analysis (PCA) for GNPs (n = 3), SHH MB (Ptch1+/−;Cdkn2c−/−) (n = 3), Myc (n = 3), MycVD (n = 3), and Myc/ΔPOZ (n = 3) tumors. Percentages represent the proportion of variance in each vector. (E) Gene Set Enrichment Analysis (GSEA) of gene expression in four Myc/ΔPOZ tumors and four MycVD tumors in comparison to three Myc tumors. List and examples of selected gene sets of up-regulated genes shown. See also Figure S1 and Table S1.
Figure 2
Figure 2. Myc/Miz1 interaction is required for proliferation of tumorspheres
(A) Representative images of Myc, MycVD, and Myc/ΔPOZ tumorspheres, scale bar = 200μm. (B) Proliferation of tumorsphere cells passaged in vitro. (C) Immunofluorescence of RFP marked Myc, MycVD, and Myc/ΔPOZ tumorspheres with antibodies to cleaved caspase-3 (cell death), Ki67 (proliferation), and DAPI (nuclei), scale bar = 50 μm. (D) BrdU pulse and FACS analysis to measure tumorspheres proliferation. (E) Apoptosis measured by Annexin V staining and FACS analysis. p values (shown at the top) are calculated by an unpaired two-tailed t-test from three independent experiments. Data are represented as the mean ± SD. See also Figure S2.
Figure 3
Figure 3. Promoter binding of Myc and Miz1 determines the transcriptional output
(A) Venn diagram displaying the number of binding sites for Myc and Miz1 in promoter regions (+/− 5 kb) of RNA polymerase II transcribed genes in G3 MB. (B) Genome browser picture documenting binding of Miz1 and Myc to a large genomic region (chr3:48,99,758-56,129,010) in G3 MB and neuronal progenitor cells (NPCs) (Wolf et al., 2013). The arrow indicates the position of the Ccrn4l promoter, which contains a Miz1 binding motif. (C) Heat map documenting binding of Myc and Miz1 to genes transcribed by RNA-Pol-II in G3 MB. All 31,194 refseq genes are shown and Myc/Miz1-peaks are centred to the adjacent transcriptional start site (TSS, +/− 5 kb). Genes are sorted according to the occupancy by Miz1. (D) Schematic representation of DNA binding motifs and transcriptional function of Miz1 alone, Miz1 bound to the Myc/Max, complex and Myc bound to Max (“nc”: non-consensus). (E) The diagram shows the sum of Myc and Miz1 binding tags versus the ratio of Myc/Miz1 tags for promoters that are bound by Myc and Miz1 in G3 MB. Colour dots designate regulated genes after 12 hr of activation of Myc-ER with 4OHT in GNPs: grey dot, Myc/Miz1 bound; red dot, Myc activated; green dot, Myc repressed. Microarray analysis identified 475 down- (log2FC<−0.322, green dots) and 696 up-regulated (log2FC>0.322, red dots) genes upon activation of Myc. (F) Quantification of the distribution of repressed (green bars) and induced (red bars) genes in respect to the Myc/Miz1 ratio. p value (shown at the top) was calculated by a Chi-squared test. (G) GO terms (DAVID) of the analysis of the 475 genes that are repressed (log2FC<−0.322) 12 hr after the activation of Myc with 4OHT. See also Figure S3.
Figure 4
Figure 4. MycVD and Myc/ΔPOZ tumors and tumorspheres express primary cilia which loss did not affect tumor onset or penetrance
(A, B) Detection of primary cilia in tumor sections (A) and tumorspheres (B) from indicated tumors by immunofluorescence staining for Arl13b (green), to detect primary cilia, and γ-tubulin (purple), to identify basal bodies. DAPI (blue) was used to detect nuclei. Scale bar = 50 μm. (C, D) The numbers of the basal body (C) or nuclei (D) were used as a denominator to calculate the percentage of ciliated cells. p values were calculated by an unpaired two-tailed t-test. Data are represented as the mean ± SD. (E) ChIP-Seq analysis for Myc and Miz1 binding to the Atoh1 locus (black bar). A canonical E box-sequence is shown as a blue bar below the binding trace. (F) Immunofluorescence of RFP marked Myc, MycVD, and Myc/ΔPOZ tumorspheres with antibodies against Atoh1, scale bar = 50 μm. (G) Kaplan-Meier survival curves of mice transplanted with three individual G3 tumorsphere lines (# 19251, 19554, and 19568) infected with retroviruses empty vector control (blue) and encoding Atoh1 (red). Top panel, line #19251 median survival (ms) 33 days for control (n = 5) and 26 days for Atoh1 (n = 5). **, p = 0.0018 control versus Atoh1. Medium panel, line #19554, ms = 43 days for control (n = 5) and ms = 38 days for Atoh1 (n = 5). *, p = 0.0373 control versus Atoh1. Line #19568, ms = 13.5 days for control (n = 12) and ms = 8 days for Atoh1 (n = 7). ***, p = 0.0001 control versus Atoh1. See also Figure S4 and Table S1.
Figure 5
Figure 5. Myc/Miz1 mediated repression discriminate G3 MB from other subgroups
(A) ATOH1 expression in WNT, SHH, G3, G4 MBs from St. Jude Children's Research Hospital–Washington University Pediatric Cancer Genome Project (PCGP) database. The black line represents the median value, the boxes reflect first and third quartile of the interquartile range, and jitter outliers represent the red dots. (B) Immunofluorescence of Myc or MycN (green) in GNPs cells from Trp53−/−;Cdkn2c−/− mice expressing a conditional Myc-ER or MycN-ER chimeric construct and RFP, before and after treatment with 4OHT. Co-expression of Myc and RFP (red and yellow). DAPI (blue) was used to detect nuclei, scale bar = 50 μm. (C) The median regulation of all genes (n = 713) that are bound by Myc and Miz1 in G3 MB and are repressed in G3 MB and re-expressed in MycVD and Myc/ΔPOZ tumors after 2 hr, 4 hr, 12 hr and 24 hr activation of Myc- and MycN-ER by 4OHT. p values (above each time point) depict if target genes are more repressed by Myc than by MycN (non-parametric 1-tailed 2-sample Wilcoxon signed rank test). (D, E) Co-IP of exogenous HA-tagged versions of Myc (MycN or Myc) and untagged Miz1 expressed in HEK293 cells by precipitation of Myc with HA antibody (D, αHA) or of Miz1 with a Miz1 antibody (E, αMiz1). (F) Binding of Miz1 at Vsp72, Foxg1, and Egr1 loci in G3 and SHH MB tumorspheres. Miz1 binding motifs (orange bars) and canonical Ebox-sequences (blue bars) are shown below the binding traces. (G) Box plot comparing Miz1 binding in Myc-driven G3 and SHH tumorspheres (log ratio) of Miz1 target genes in NPCs, Myc target genes in G3 tumors and MycN target genes in SHH tumorspheres. The black line indicates the median value, bottom and top of the boxes reflect first and third quartile, whiskers represent 1.5 interquartile range, and outliers are shown as dots (Tukey box plot). p values (shown at the top) are calculated by an unpaired two-tailed t-test. (H) Protein expression in GNPs from the cerebella of 7 days old Trp53−/−;Cdkn2c−/− mice infected or not with retroviruses encoding Myc or MycN and RFP. (I) Survival of mice transplanted with GNPs transduced with MSCV-IRES-GFP vector empty (control, black line, n = 5), encoding MycN (red line, n = 7) or MycNVD (dashed blue line, n=10). ****, p< 0.0001 control versus MycN. See also Figure S5.
Figure 6
Figure 6. Comparison of global gene expression between murine MB subgroups
(A) Gene expression profiles using publicly available data sets of the mouse WNT-subgroup (Ctnnb1+/lox(ex3);Blbp-Cre;Trp53−/−), of murine SHH MBs engineered by enforced expression of MycN in GNPs from Trp53−/−;Cdkn2c−/− mice (MycN) or spontaneously arisen from Trp53−/−;Cdkn2c−/− (Trp53), and Ptch1+/−;Cdkn2c−/− (Ptch), and of G3 MBs (Uziel et al., 2005). The heatmaps contain genes that are repressed by the Myc/Miz1 complex (bound by Myc and Miz1, repressed by Myc in tumors and re-expressed in MycVD- and Myc/ΔPOZ-genes: n=713) and are sorted according to fold expression after 2 hr, 4 hr, 12 hr and 24 hr induction of Myc-ER (left). (B) Expression data from different MB subgroups (GSE37382) were RMA normalized, median centered and the expression of each gene was averaged within the subgroups. The black line indicates the median value, bottom and top of the boxes reflect first and third quartile, whiskers represent 1.5 interquartile range, and outliers are not shown (Tukey box plot). p values were calculated using a paired two-tailed Wilcoxon signed-rank. See also Figure S6.
Figure 7
Figure 7. Schematic model of the Myc/Max/Miz1 transcriptional network in G3 and SHH MBs
Both Myc/Max and MycN/Max complexes bind to E-boxes to activate transcription in G3 and SHH MBs, respectively. The Myc/Max/Miz1 complex also binds to non-canonical (“nc”) Myc/Max and Miz1 binding sites to repress transcription whereas the reduced interaction of MycN/Max with Miz1 attenuates gene repression. The lighter shades of the MycN/Max/Miz1 represent the weaker but significant interaction with Miz1.

Comment in

  • Parsing Myc Paralogs in Oncogenesis.
    Mathsyaraja H, Eisenman RN. Mathsyaraja H, et al. Cancer Cell. 2016 Jan 11;29(1):1-2. doi: 10.1016/j.ccell.2015.12.009. Cancer Cell. 2016. PMID: 26766585

References

    1. Adhikary S, Peukert K, Karsunky H, Beuger V, Lutz W, Elsasser HP, Moroy T, Eilers M. Miz1 is required for early embryonic development during gastrulation. Mol. Cell Biol. 2003;23:7648–7657. - PMC - PubMed
    1. Ayrault O, Zhao H, Zindy F, Qu C, Sherr CJ, Roussel MF. Atoh1 inhibits neuronal differentiation and collaborates with Gli1 to generate medulloblastoma-initiating cells. Cancer Res. 2010;70:5618–5627. - PMC - PubMed
    1. Conacci-Sorrell M, McFerrin L, Eisenman RN. An overview of MYC and its interactome. Cold Spring Harb Perspect. Med. 2014;4:a014357. - PMC - PubMed
    1. Dang CV. MYC on the path to cancer. Cell. 2012;149:22–35. - PMC - PubMed
    1. Dastidar SG, Landrieu PM, D'Mello SR. FoxG1 promotes the survival of postmitotic neurons. J. Neurosci. 2011;31:402–413. - PMC - PubMed

Publication types

MeSH terms