

Cancer statistics for Asian Americans, Native Hawaiians, and Pacific Islanders, 2016: Converging incidence in males and females
- PMID: 26766789
- PMCID: PMC5325676
- DOI: 10.3322/caac.21335
Cancer statistics for Asian Americans, Native Hawaiians, and Pacific Islanders, 2016: Converging incidence in males and females
Abstract
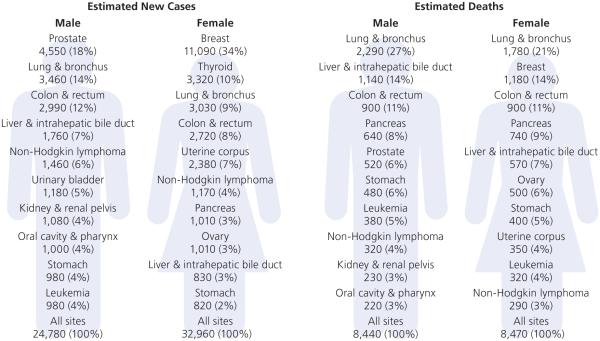
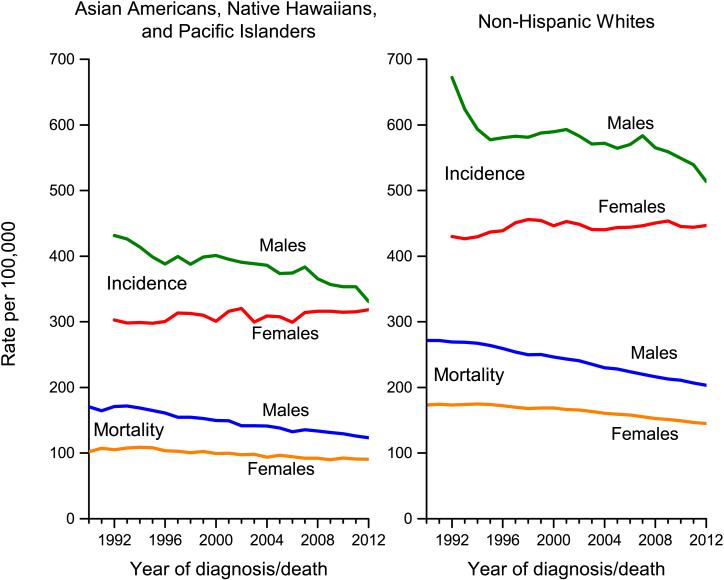
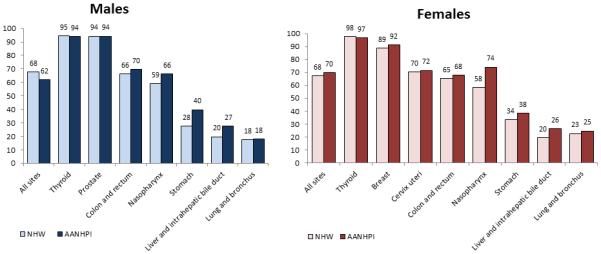
Cancer is the leading cause of death among Asian Americans, Native Hawaiians, and Pacific Islanders (AANHPIs). In this report, the American Cancer Society presents AANHPI cancer incidence data from the National Cancer Institute, the Centers for Disease Control and Prevention, and the North American Association of Central Cancer Registries and mortality data from the National Center for Health Statistics. Among AANHPIs in 2016, there will be an estimated 57,740 new cancer cases and 16,910 cancer deaths. While AANHPIs have 30% to 40% lower incidence and mortality rates than non-Hispanic whites for all cancers combined, risk of stomach and liver cancers is double. The male-to-female incidence rate ratio among AANHPIs declined from 1.43 (95% confidence interval, 1.36-1.49) in 1992 to 1.04 (95% confidence interval, 1.01-1.07) in 2012 because of declining prostate and lung cancer rates in males and increasing breast cancer rates in females. The diversity within the AANHPI population is reflected in the disparate cancer risk by subgroup. For example, the overall incidence rate in Samoan men (526.5 per 100,000) is more than twice that in Asian Indian/Pakistani men (216.8). Variations in cancer rates in AANHPIs are related to differences in behavioral risk factors, use of screening and preventive services, and exposure to cancer-causing infections. Cancer-control strategies include improved use of vaccination and screening; interventions to increase physical activity and reduce excess body weight, tobacco use, and alcohol consumption; and subgroup-level research on burden and risk factors. CA Cancer J Clin 2016;66:182-202. © 2016 American Cancer Society.
Keywords: Asian Americans; Native Hawaiians; Pacific Islanders; cancer statistics; incidence; mortality.
© 2016 American Cancer Society, Inc.
Figures


Comment in
-
Some thoughts on health surveillance data, race, and population categorization.CA Cancer J Clin. 2016 May;66(3):179-81. doi: 10.3322/caac.21346. Epub 2016 Mar 21. CA Cancer J Clin. 2016. PMID: 26998579 No abstract available.
References
-
- Colby SL, Ortman JM. Projections of the Size and Composition of the U.S. Population: 2014 to 2060, Current Population Reports, P25-1143. U.S. Census Bureau; Washington, DC: 2014.
-
- Hoeffel EM, Rastogi S, Kim MO, Shahid H. 2010 Census Briefs. U.S. Department of Commerce, Economics and Statistics Administration, U.S. Census Bureau; 2012. The Asian Population: 2010.
-
- Brown A. U.S. Hispanic and Asian populations growing, but for different reasons. Available at: http://www.pewresearch.org/fact-tank/2014/06/26/u-s-hispanic-and-asian-p.... Accessed September 15, 2015.
-
- Hixson L, Hepler BB, Kim MO. 2010 Census Briefs. U.S. Department of Commerce, Economics and Statistics Administration, U.S. Census Bureau; 2012. The Native Hawaiian and Other Pacific Islander Population: 2010.
-
- Kagawa-Singer M, Kho C. Asian-American Health and Disease: An Overview. In: Huff RM, Kline MV, Peterson DV, editors. Health Promotion in Multicultural Populations. Third Sage Publications; Washington, DC: 2015.
Publication types
MeSH terms
Grants and funding
LinkOut - more resources
Full Text Sources
Other Literature Sources
