

Intranasal brain delivery of cationic nanoemulsion-encapsulated TNFα siRNA in prevention of experimental neuroinflammation
- PMID: 26767514
- PMCID: PMC4837036
- DOI: 10.1016/j.nano.2015.12.374
Intranasal brain delivery of cationic nanoemulsion-encapsulated TNFα siRNA in prevention of experimental neuroinflammation
Abstract
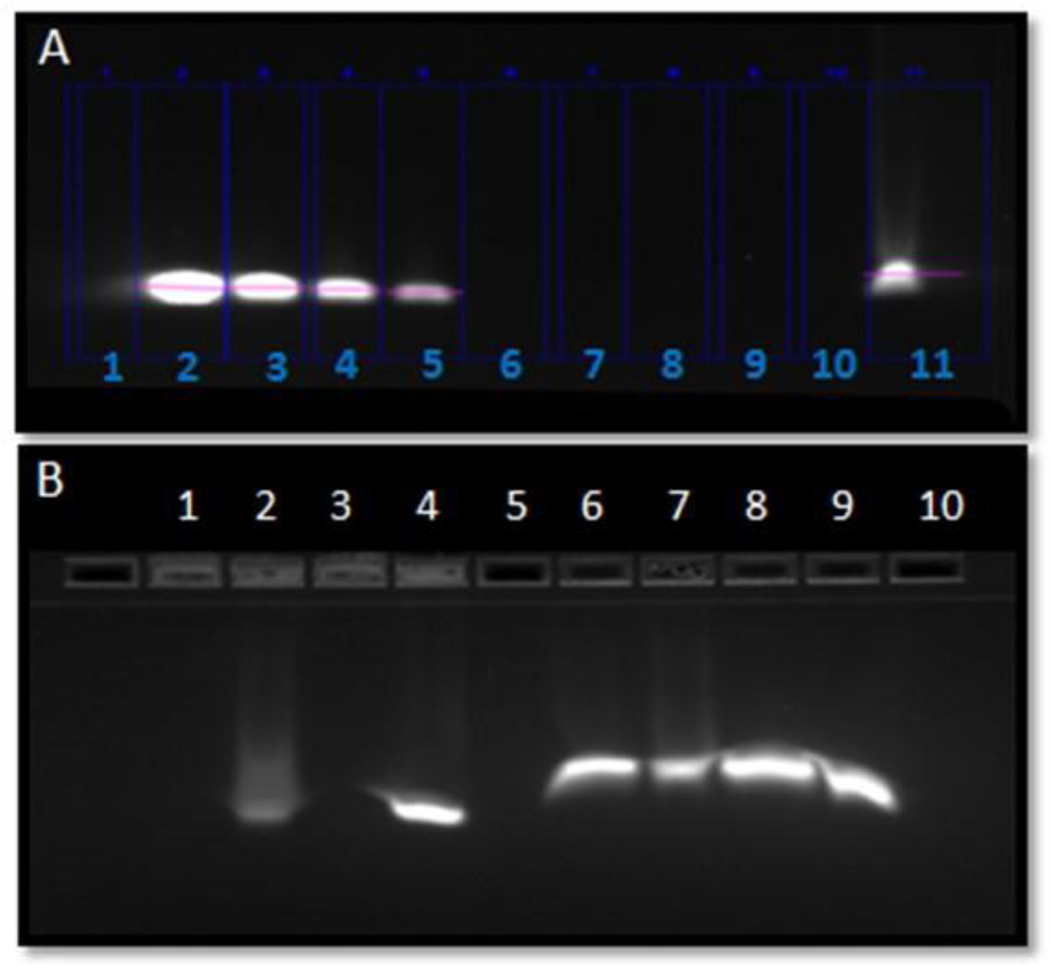
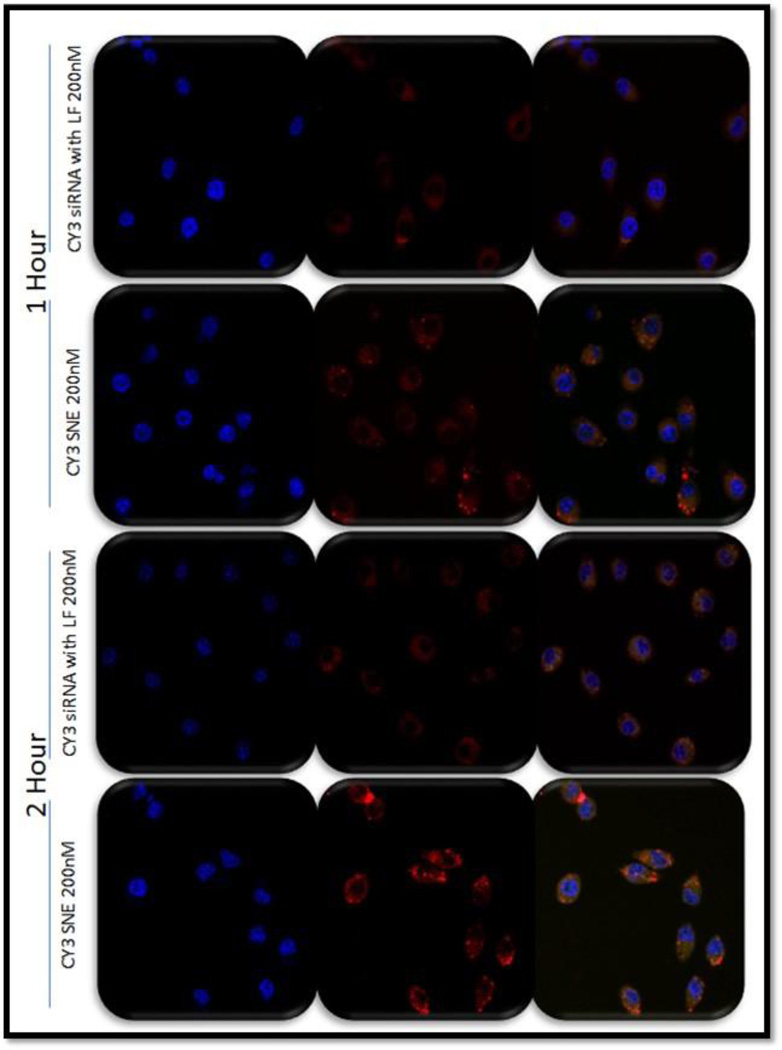
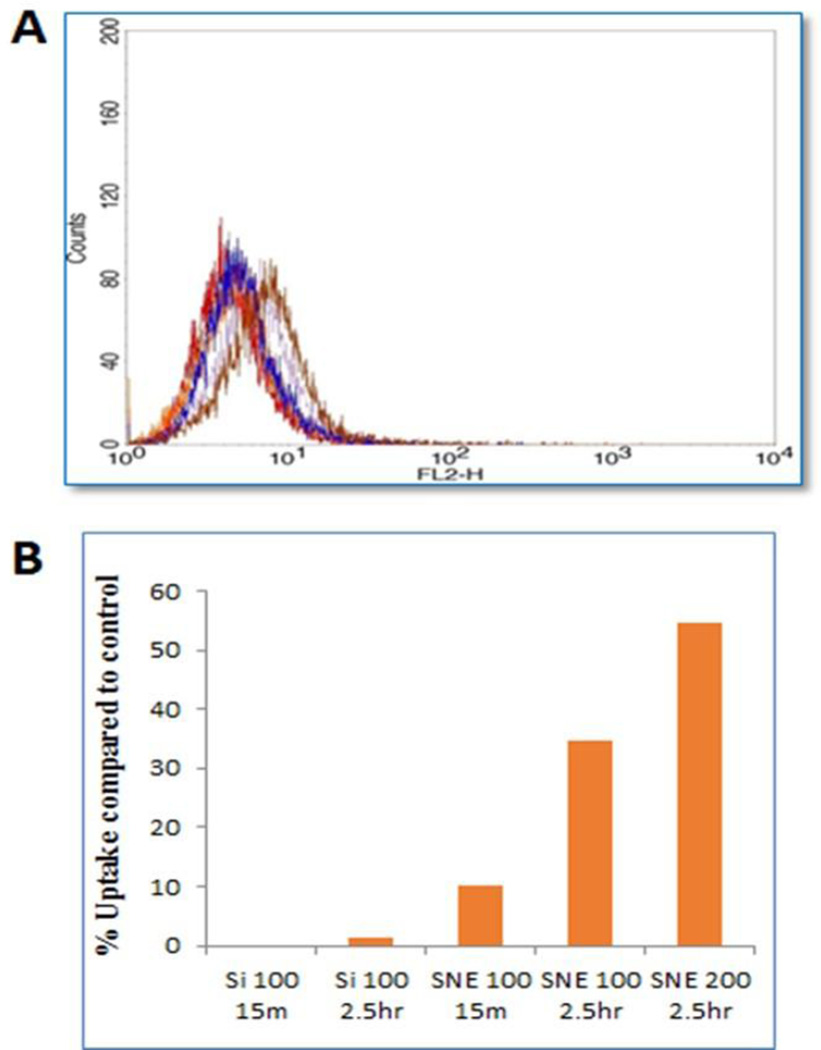
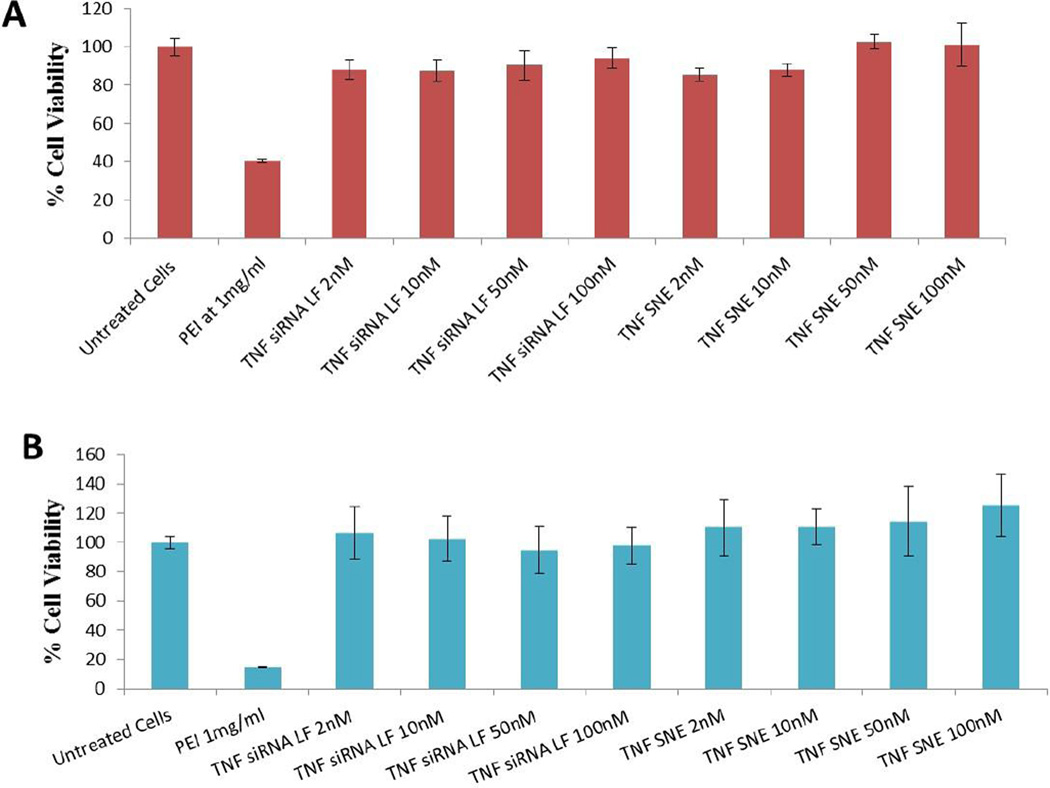
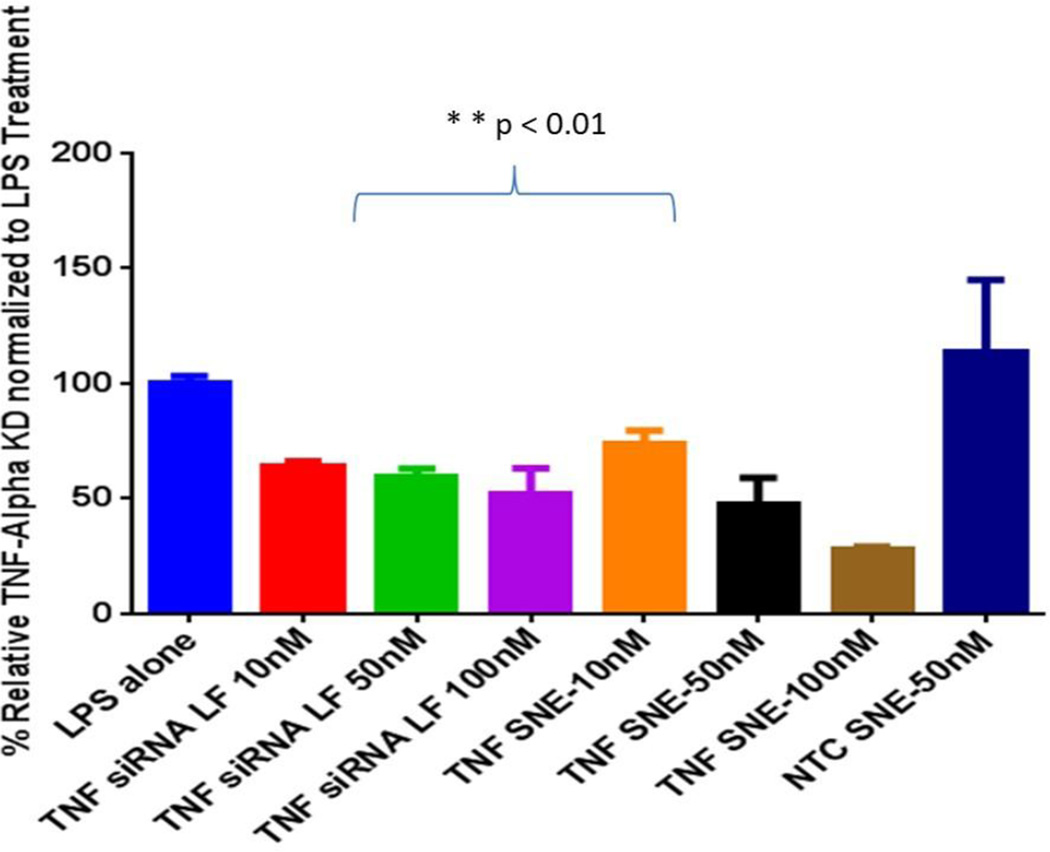
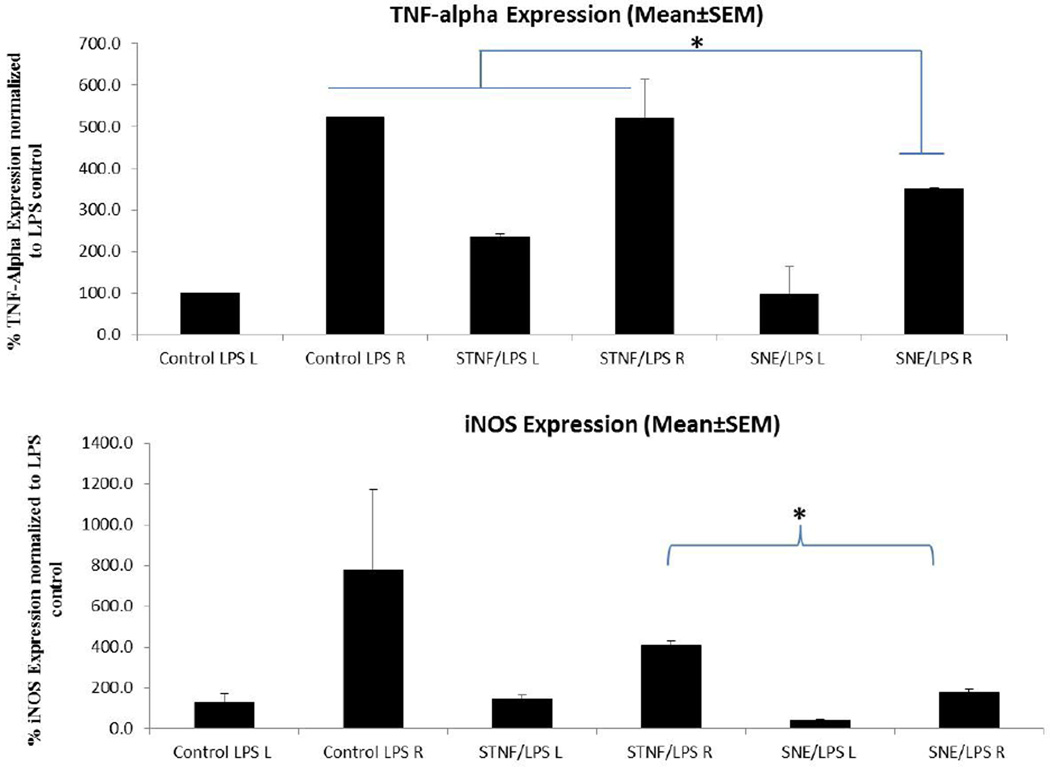
Neuroinflammation is a hallmark of acute and chronic neurodegenerative disorders. The main aim of this study was to evaluate the therapeutic efficacy of intranasal cationic nanoemulsion encapsulating an anti-TNFα siRNA, for potential anti-inflammatory therapy. TNFα siRNA nanoemulsions were prepared and characterized for particle size, surface charge, morphology, and stability and encapsulation efficiency. Qualitative and quantitative intracellular uptake studies by confocal imaging and flow cytometry, respectively, showed higher uptake compared to Lipofectamine® transfected siRNA. Nanoemulsion significantly lowered TNFα levels in LPS-stimulated cells. Upon intranasal delivery of cationic nanoemulsions almost 5 fold higher uptake was observed in the rat brain compared to non-encapsulated siRNA. More importantly, intranasal delivery of TNFα siRNA nanoemulsions in vivo markedly reduced the unregulated levels of TNFα in an LPS-induced model of neuroinflammation. These results indicate that intranasal delivery of cationic nanoemulsions encapsulating TNFα siRNA offered an efficient means of gene knockdown and this approach has significant potential in prevention of neuroinflammation.
From the clinical editor: Neuroinflammation is often seen in patients with neurodegenerative disorders and tumor necrosis factor-alpha (TNFα) plays a significant role in contributing to neuronal dysfunction. As a result, inhibition of TNFα may alleviate disease severity. In this article, the authors investigated using a cationic nanoemulsion system carrying TNFα siRNA intra-nasally to protect against neuroinflammation. This new method may provide a future approach in this clinical setting.
Keywords: Brain delivery; Cationic nanoemulsion; Gene silencing; Neuroinflammation; Small interfering RNA; Tumor necrosis factor-alpha.
Copyright © 2016 Elsevier Inc. All rights reserved.
Conflict of interest statement
Figures

Similar articles
-
Nasal Administration of Cationic Nanoemulsions as CD73-siRNA Delivery System for Glioblastoma Treatment: a New Therapeutical Approach.Mol Neurobiol. 2020 Feb;57(2):635-649. doi: 10.1007/s12035-019-01730-6. Epub 2019 Aug 12. Mol Neurobiol. 2020. PMID: 31407144
-
Therapeutic aerosol bioengineering of siRNA for the treatment of inflammatory lung disease by TNFα gene silencing in macrophages.Mol Pharm. 2014 Nov 3;11(11):4270-9. doi: 10.1021/mp500473d. Epub 2014 Oct 13. Mol Pharm. 2014. PMID: 25243784
-
Effects of particle size and binding affinity for small interfering RNA on the cellular processing, intestinal permeation and anti-inflammatory efficacy of polymeric nanoparticles.J Gene Med. 2015 Oct-Dec;17(10-12):244-56. doi: 10.1002/jgm.2866. J Gene Med. 2015. PMID: 26418829
-
Functional TNFα gene silencing mediated by polyethyleneimine/TNFα siRNA nanocomplexes in inflamed colon.Biomaterials. 2011 Feb;32(4):1218-28. doi: 10.1016/j.biomaterials.2010.09.062. Biomaterials. 2011. PMID: 20970849 Free PMC article.
-
Efficient new cationic liposome formulation for systemic delivery of small interfering RNA silencing tumor necrosis factor alpha in experimental arthritis.Arthritis Rheum. 2006 Jun;54(6):1867-77. doi: 10.1002/art.21876. Arthritis Rheum. 2006. PMID: 16729293
Cited by
-
The impact of high and low dose ionising radiation on the central nervous system.Redox Biol. 2016 Oct;9:144-156. doi: 10.1016/j.redox.2016.08.002. Epub 2016 Aug 10. Redox Biol. 2016. PMID: 27544883 Free PMC article. Review.
-
Nasal Administration of Cationic Nanoemulsions as CD73-siRNA Delivery System for Glioblastoma Treatment: a New Therapeutical Approach.Mol Neurobiol. 2020 Feb;57(2):635-649. doi: 10.1007/s12035-019-01730-6. Epub 2019 Aug 12. Mol Neurobiol. 2020. PMID: 31407144
-
CNS Delivery of Nucleic Acid Therapeutics: Beyond the Blood-Brain Barrier and Towards Specific Cellular Targeting.Pharm Res. 2023 Jan;40(1):77-105. doi: 10.1007/s11095-022-03433-5. Epub 2022 Nov 15. Pharm Res. 2023. PMID: 36380168 Review.
-
Advanced Drug Delivery Systems: From Microsponges to Nanotechnologies.Recent Adv Inflamm Allergy Drug Discov. 2025;19(1):2-4. doi: 10.2174/277227081901241223145542. Recent Adv Inflamm Allergy Drug Discov. 2025. PMID: 39819593 No abstract available.
-
Impact of nanoparticles on neuron biology: current research trends.Int J Nanomedicine. 2018 May 9;13:2767-2776. doi: 10.2147/IJN.S165675. eCollection 2018. Int J Nanomedicine. 2018. PMID: 29780247 Free PMC article. Review.
References
-
- Barchet TM, Amiji MM. Challenges and opportunities in CNS delivery of therapeutics for neurodegenerative diseases. Expert opinion on drug delivery. 2009;6:211–225. - PubMed
-
- Glass JD, Johnson RT. Human immunodeficiency virus and the brain. Annual review of neuroscience. 1996;19:1–26. - PubMed
-
- Raine CS. Multiple sclerosis: immune system molecule expression in the central nervous system. Journal of neuropathology and experimental neurology. 1994;53:328–337. - PubMed
-
- Rogers J, Luber-Narod J, Styren SD, Civin WH. Expression of immune system-associated antigens by cells of the human central nervous system: relationship to the pathology of Alzheimer's disease. Neurobiology of aging. 1988;9:339–349. - PubMed
-
- McGeer PL, Itagaki S, Boyes BE, McGeer EG. Reactive microglia are positive for HLA-DR in the substantia nigra of Parkinson's and Alzheimer's disease brains. Neurology. 1988;38:1285–1291. - PubMed
Publication types
MeSH terms
Substances
Grants and funding
LinkOut - more resources
Full Text Sources
Other Literature Sources
Research Materials
