. 2016 Jan 15:8:2.
doi: 10.1186/s13195-016-0172-3.

Reference tissue normalization in longitudinal (18)F-florbetapir positron emission tomography of late mild cognitive impairment

Collaborators, Affiliations

Reference tissue normalization in longitudinal (18)F-florbetapir positron emission tomography of late mild cognitive impairment

Sepideh Shokouhi et al. Alzheimers Res Ther. .

Abstract

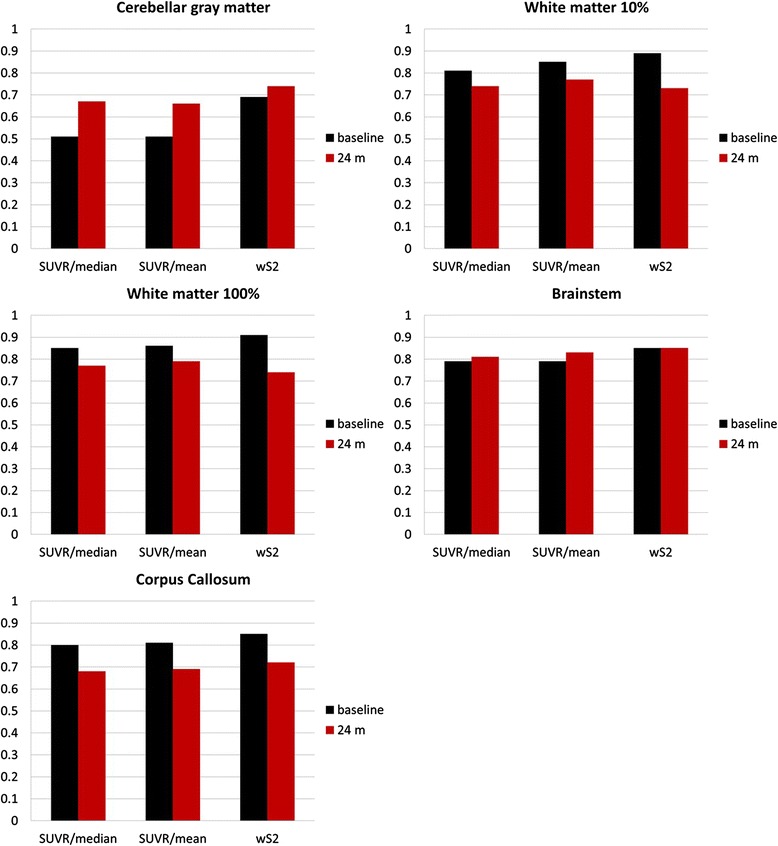
Background: Semiquantitative methods such as the standardized uptake value ratio (SUVR) require normalization of the radiotracer activity to a reference tissue to monitor changes in the accumulation of amyloid-β (Aβ) plaques measured with positron emission tomography (PET). The objective of this study was to evaluate the effect of reference tissue normalization in a test-retest (18)F-florbetapir SUVR study using cerebellar gray matter, white matter (two different segmentation masks), brainstem, and corpus callosum as reference regions.

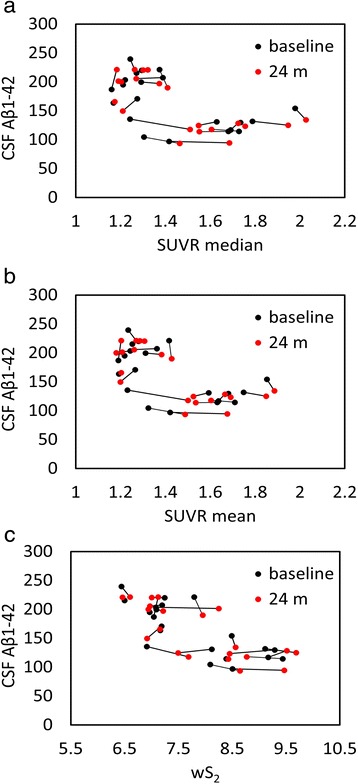
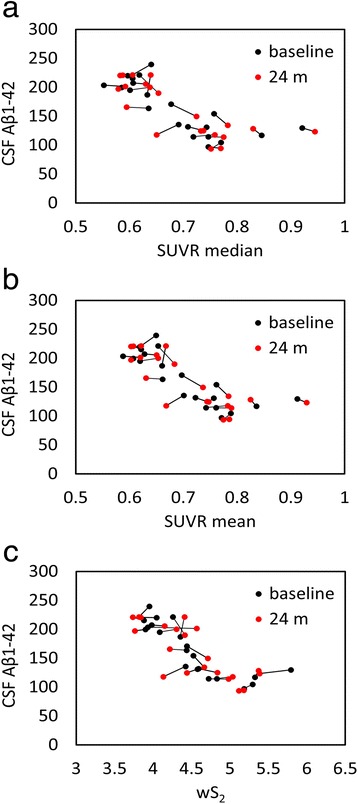
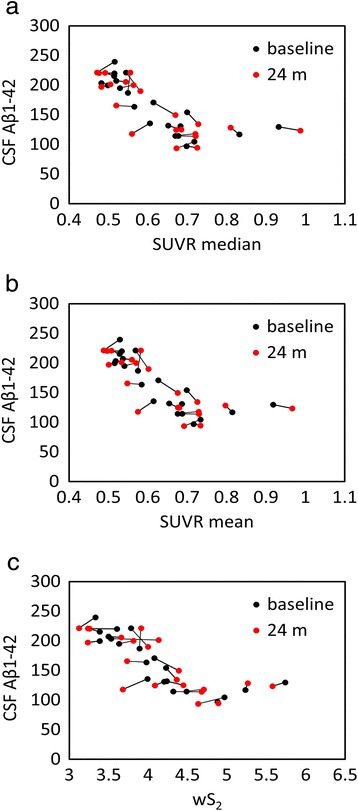
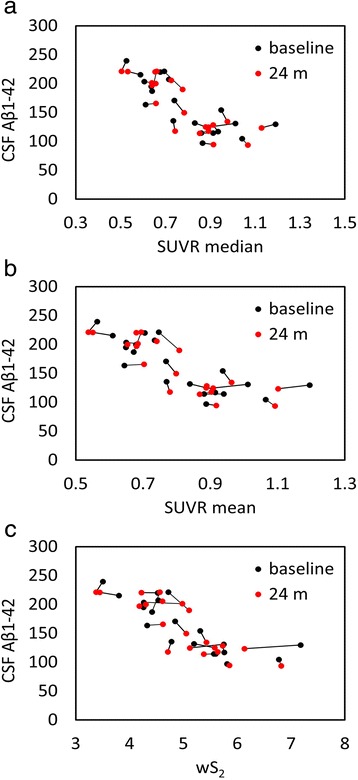
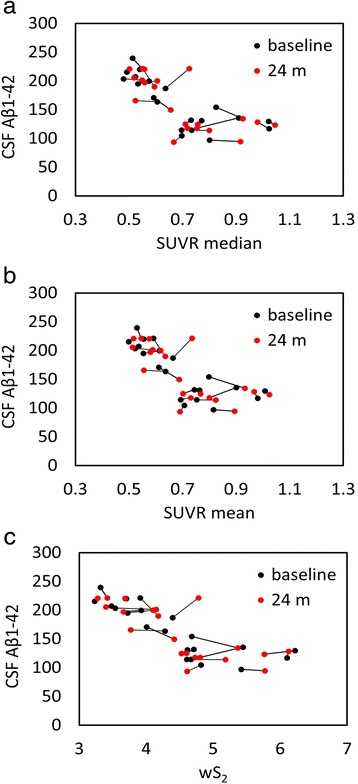
Methods: We calculated the correlation between (18)F-florbetapir PET and concurrent cerebrospinal fluid (CSF) Aβ1-42 levels in a late mild cognitive impairment cohort with longitudinal PET and CSF data over the course of 2 years. In addition to conventional SUVR analysis using mean and median values of normalized brain radiotracer activity, we investigated a new image analysis technique-the weighted two-point correlation function (wS2)-to capture potentially more subtle changes in Aβ-PET data.

Results: Compared with the SUVRs normalized to cerebellar gray matter, all cerebral-to-white matter normalization schemes resulted in a higher inverse correlation between PET and CSF Aβ1-42, while the brainstem normalization gave the best results (high and most stable correlation). Compared with the SUVR mean and median values, the wS2 values were associated with the lowest coefficient of variation and highest inverse correlation to CSF Aβ1-42 levels across all time points and reference regions, including the cerebellar gray matter.

Conclusions: The selection of reference tissue for normalization and the choice of image analysis method can affect changes in cortical (18)F-florbetapir uptake in longitudinal studies.


Figures

Fig. 1
Fig. 1
Box plots of the Alzheimer’s Disease Neuroimaging Initiative composite memory score (ADNI-MEM), combining the Rey Auditory Verbal Learning Test, the Logical Memory Test of the Wechsler Memory Scale, the Mini Mental State Examination and the Alzheimer’s Disease Assessment Scale–Cognitive subscale
Fig. 2
Fig. 2
Reference tissue masks. Cerebellar gray matter (a), 100 % threshold white matter mask (b), 10 % threshold white matter mask (c) , brainstem (d), and splenium of corpus callosum (e)
Fig. 3
Fig. 3
18F-florbetapir positron emission tomographic images (zoomed over an axial slice located in the frontal lobe) from two subjects (a) with low tracer uptake and (b) with high tracer uptake, as well as (c) the weighted two-point correlation function (wS2) calculated from whole-brain images of these two subjects
Fig. 4
Fig. 4
Scatterplots of all cerebrospinal fluid (CSF) amyloid-β1–42 (Aβ1–42) versus standardized uptake value ratio (SUVR) median (a), mean (b), and weighted two-point correlation function (wS2) (c) values obtained by normalization of positron emission tomography activity to cerebellar gray matter at baseline (black dots) and 24-month follow-up (red dots)
Fig. 5
Fig. 5
Scatterplots of all cerebrospinal fluid (CSF) amyloid-β1–42 (Aβ1–42) versus standardized uptake value ratio (SUVR) median (a), mean (b), and weighted two-point correlation function (wS2) (c) values obtained by normalization of positron emission tomography activity to white matter (10 %) at baseline (black dots) and 24-month follow-up (red dots)
Fig. 6
Fig. 6
Scatterplots of all cerebrospinal fluid (CSF) amyloid-β1–42 (Aβ1–42) versus standardized uptake value ratio (SUVR) median (a), mean (b), and weighted two-point correlation function (wS2) (c) values obtained by normalization of positron emission tomography activity to white matter (100 %) at baseline (black dots) and 24-month follow-up (red dots)
Fig. 7
Fig. 7
Scatterplots of all cerebrospinal fluid (CSF) amyloid-β1–42 (Aβ1–42) versus standardized uptake value ratio (SUVR) median (a), mean (b), and weighted two-point correlation function (wS2) (c) values obtained by normalization of positron emission tomography activity to brainstem at baseline (black dots) and 24 months follow-up (red dots)
Fig. 8
Fig. 8
Scatterplots of all cerebrospinal fluid (CSF) amyloid-β1–42 (Aβ1–42) versus standardized uptake value ratio (SUVR) median (a), mean (b), and weighted two-point correlation function (wS2) (c) values obtained by normalization of positron emission tomography activity to corpus callosum at baseline (black dots) and 24-month follow-up (red dots)
Fig. 9
Fig. 9
Spearman’s rank correlation between cerebrospinal fluid (CSF) amyloid-β1–42 (Aβ1–42) and 18F-florbetapir standardized uptake value ratio (SUVR) median and mean and weighted two-point correlation function (wS2) measures at baseline (black bars) and 24-month follow-up (red bars) for five different reference tissue normalization schemes

References

    1. Braak H, Braak E. Neuropathological stageing of Alzheimer-related changes. Acta Neuropathol. 1991;82:239–59. doi: 10.1007/BF00308809. - DOI - PubMed
    1. Hardy J, Selkoe DJ. The amyloid hypothesis of Alzheimer’s disease: progress and problems on the road to therapeutics. Science. 2002;297:353–6. doi: 10.1126/science.1072994. - DOI - PubMed
    1. Thal DR, Rüb U, Orantes M, Braak H. Phase of Aβ-deposition in the human brain and its relevance for the development of AD. Neurology. 2002;58:1791–800. doi: 10.1212/WNL.58.12.1791. - DOI - PubMed
    1. Jagust WJ, Mormino EC. Lifespan brain activity, β-amyloid, and Alzheimer’s disease. Trends Cogn Sci. 2011;15:520–6. doi: 10.1016/j.tics.2011.09.004. - DOI - PMC - PubMed
    1. Sperling RA, Aisen PS, Beckett LA, Bennett DA, Craft S, Fagan AM, et al. Toward defining the preclinical stages of Alzheimer’s disease: recommendations from the National Institute on Aging-Alzheimer’s Association workgroups on diagnostic guidelines for Alzheimer’s disease. Alzheimers Dement. 2011;7:280–92. doi: 10.1016/j.jalz.2011.03.003. - DOI - PMC - PubMed

Publication types