

Pathways of retinoid synthesis in mouse macrophages and bone marrow cells
- PMID: 26768478
- PMCID: PMC4952016
- DOI: 10.1189/jlb.2HI0415-146RR
Pathways of retinoid synthesis in mouse macrophages and bone marrow cells
Abstract
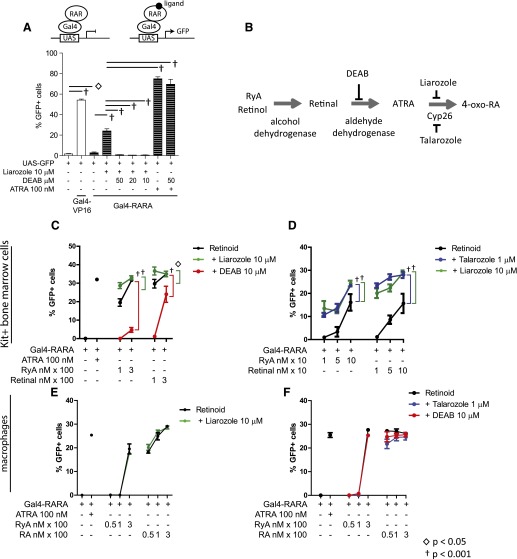
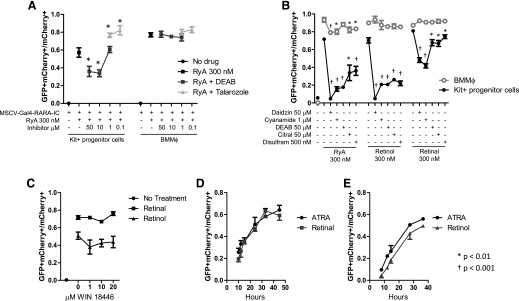
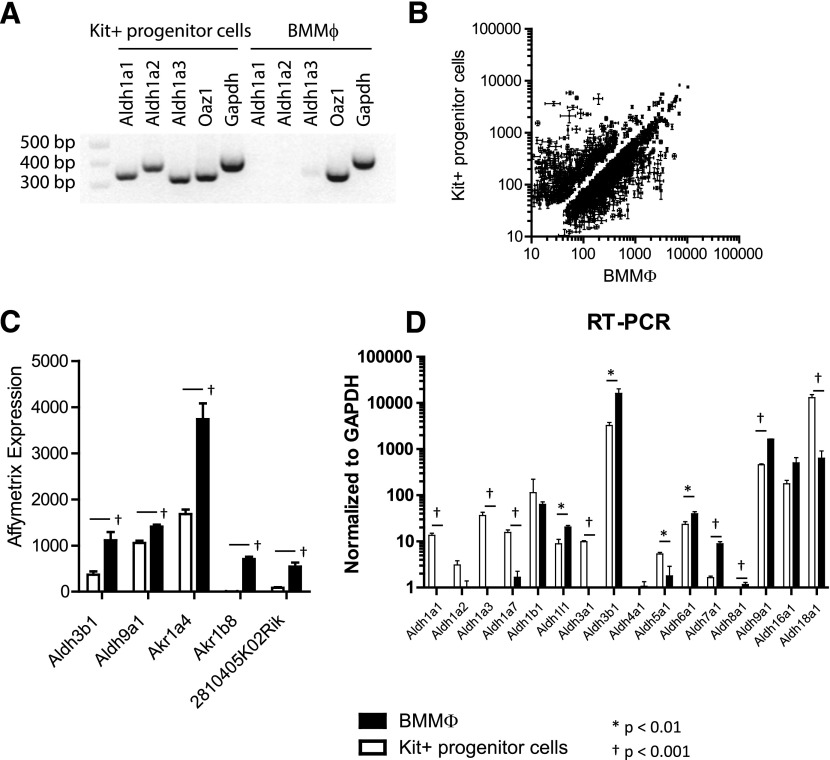
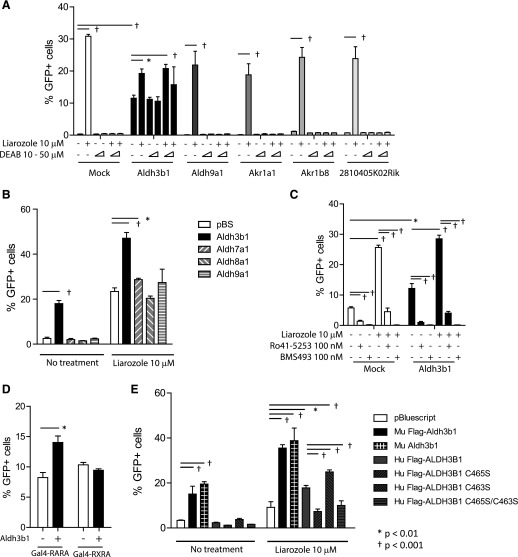
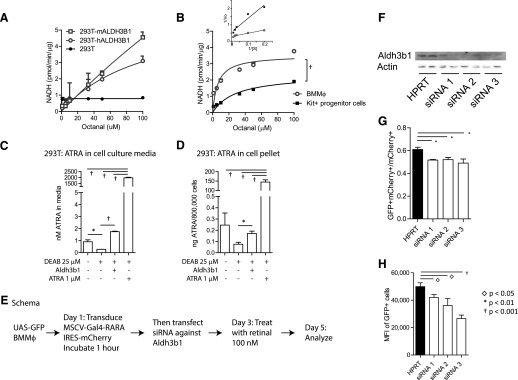
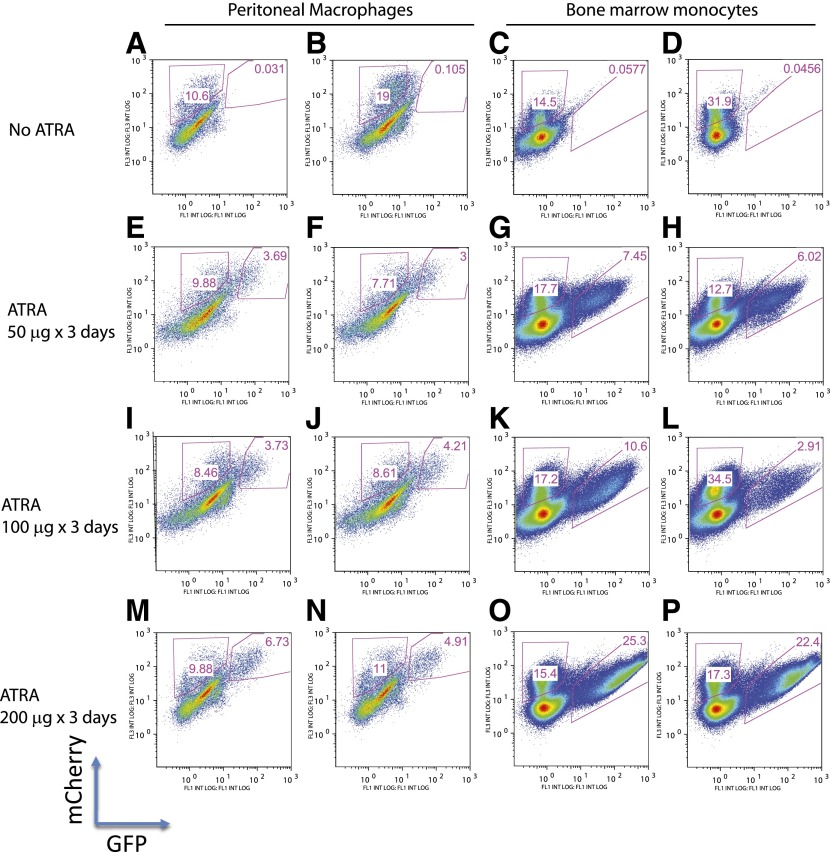
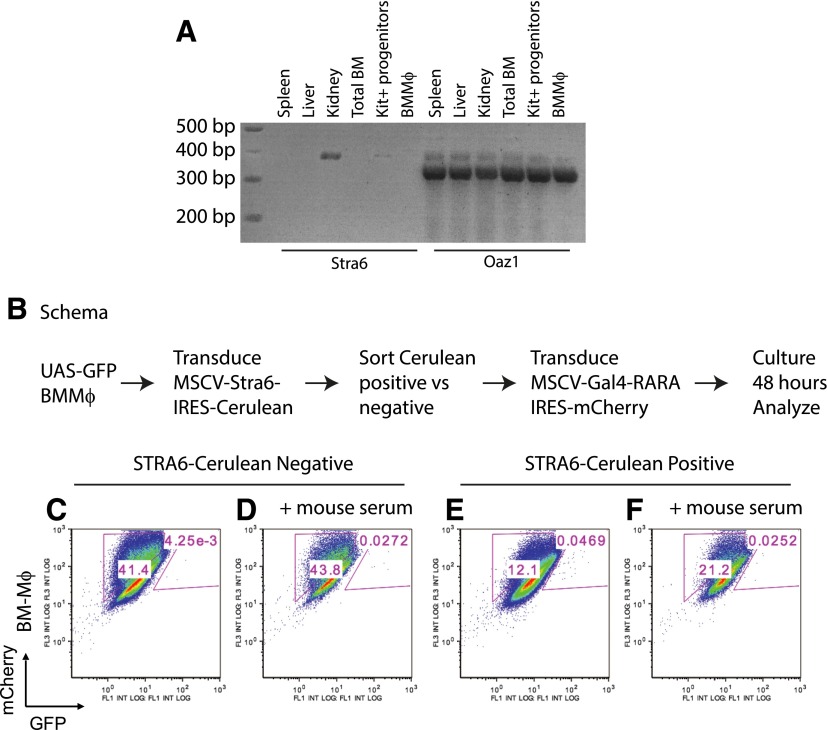
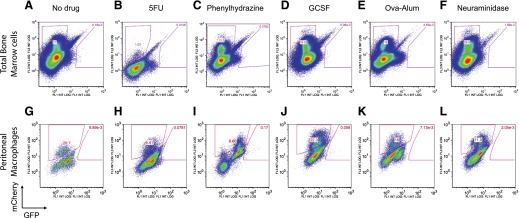
In vivo pathways of natural retinoid metabolism and elimination have not been well characterized in primary myeloid cells, even though retinoids and retinoid receptors have been strongly implicated in regulating myeloid maturation. With the use of a upstream activation sequence-GFP reporter transgene and retrovirally expressed Gal4-retinoic acid receptor α in primary mouse bone marrow cells, we identified 2 distinct enzymatic pathways used by mouse myeloid cells ex vivo to synthesize retinoic acid receptor α ligands from free vitamin A metabolites (retinyl acetate, retinol, and retinal). Bulk Kit(+) bone marrow progenitor cells use diethylaminobenzaldehyde-sensitive enzymes, whereas bone marrow-derived macrophages use diethylaminobenzaldehyde-insensitive enzymes to synthesize natural retinoic acid receptor α-activating retinoids (all-trans retinoic acid). Bone marrow-derived macrophages do not express the diethylaminobenzaldehyde-sensitive enzymes Aldh1a1, Aldh1a2, or Aldh1a3 but instead, express Aldh3b1, which we found is capable of diethylaminobenzaldehyde-insensitive synthesis of all trans-retinoic acid. However, under steady-state and stimulated conditions in vivo, diverse bone marrow cells and peritoneal macrophages showed no evidence of intracellular retinoic acid receptor α-activating retinoids, despite expression of these enzymes and a vitamin A-sufficient diet, suggesting that the enzymatic conversion of retinal is not the rate-limiting step in the synthesis of intracellular retinoic acid receptor α-activating retinoids in myeloid bone marrow cells and that retinoic acid receptor α remains in an unliganded configuration during adult hematopoiesis.
Keywords: ATRA; Aldh3b1; aldehyde dehydrogenase; retinoid receptor.
© Society for Leukocyte Biology.
Figures
Comment in
-
Editorial: An ATRA oddity: new questions revealed on retinoid synthesis in bone marrow cells.J Leukoc Biol. 2016 Jun;99(6):791-4. doi: 10.1189/jlb.3CE0116-030R. J Leukoc Biol. 2016. PMID: 27252521 No abstract available.
Similar articles
-
Molecular and metabolic retinoid pathways in the human ocular surface.Mol Vis. 2007 Sep 11;13:1641-50. Mol Vis. 2007. PMID: 17893666
-
Identification of endogenous retinoids, enzymes, binding proteins, and receptors during early postimplantation development in mouse: important role of retinal dehydrogenase type 2 in synthesis of all-trans-retinoic acid.Dev Biol. 2000 Apr 15;220(2):379-91. doi: 10.1006/dbio.2000.9634. Dev Biol. 2000. PMID: 10753524
-
Differential regulation of human ectocervical epithelial cell line proliferation and differentiation by retinoid X receptor- and retinoic acid receptor-specific retinoids.Cell Growth Differ. 1996 Apr;7(4):521-30. Cell Growth Differ. 1996. PMID: 9052993
-
Retinoic acid biosynthesis and metabolism.FASEB J. 1996 Jul;10(9):993-1001. doi: 10.1096/fasebj.10.9.8801182. FASEB J. 1996. PMID: 8801182 Review.
-
Regulation of gene expression by retinoids.Curr Med Chem. 2011;18(9):1405-12. doi: 10.2174/092986711795029618. Curr Med Chem. 2011. PMID: 21366525 Review.
Cited by
-
[ALDH3B1 expression is correlated with histopathology and long-term prognosis of gastric cancer].Nan Fang Yi Ke Da Xue Xue Bao. 2022 May 20;42(5):633-640. doi: 10.12122/j.issn.1673-4254.2022.05.02. Nan Fang Yi Ke Da Xue Xue Bao. 2022. PMID: 35673905 Free PMC article. Chinese.
-
Endogenous retinoid X receptor ligands in mouse hematopoietic cells.Sci Signal. 2017 Oct 31;10(503):eaan1011. doi: 10.1126/scisignal.aan1011. Sci Signal. 2017. PMID: 29089448 Free PMC article.
-
Retinoic Acid (RA): A Critical Immunoregulatory Molecule in Asthma and Allergies.Immun Inflamm Dis. 2024 Oct;12(10):e70051. doi: 10.1002/iid3.70051. Immun Inflamm Dis. 2024. PMID: 39466149 Free PMC article. Review.
-
All trans retinoic acid as a host-directed immunotherapy for tuberculosis.Curr Res Immunol. 2022 Mar 30;3:54-72. doi: 10.1016/j.crimmu.2022.03.003. eCollection 2022. Curr Res Immunol. 2022. PMID: 35496824 Free PMC article. Review.
-
Aldehyde dehydrogenases contribute to skeletal muscle homeostasis in healthy, aging, and Duchenne muscular dystrophy patients.J Cachexia Sarcopenia Muscle. 2020 Aug;11(4):1047-1069. doi: 10.1002/jcsm.12557. Epub 2020 Mar 10. J Cachexia Sarcopenia Muscle. 2020. PMID: 32157826 Free PMC article.
References
Publication types
MeSH terms
Substances
Grants and funding
LinkOut - more resources
Full Text Sources
Other Literature Sources
Molecular Biology Databases
Research Materials
Miscellaneous
