. 2016 Jan 15:17:61.
doi: 10.1186/s12864-015-2291-9.

Complex regulation of ADAR-mediated RNA-editing across tissues

Affiliations

Complex regulation of ADAR-mediated RNA-editing across tissues

Melanie A Huntley et al. BMC Genomics. .

Abstract

Background: RNA-editing is a tightly regulated, and essential cellular process for a properly functioning brain. Dysfunction of A-to-I RNA editing can have catastrophic effects, particularly in the central nervous system. Thus, understanding how the process of RNA-editing is regulated has important implications for human health. However, at present, very little is known about the regulation of editing across tissues, and individuals.

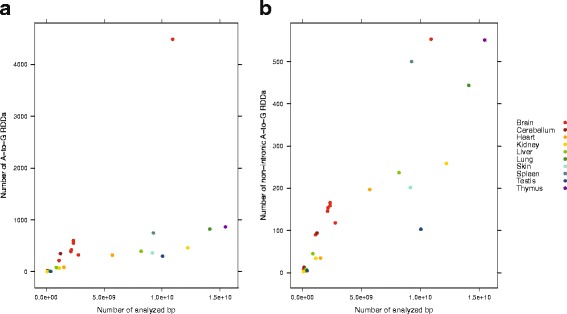
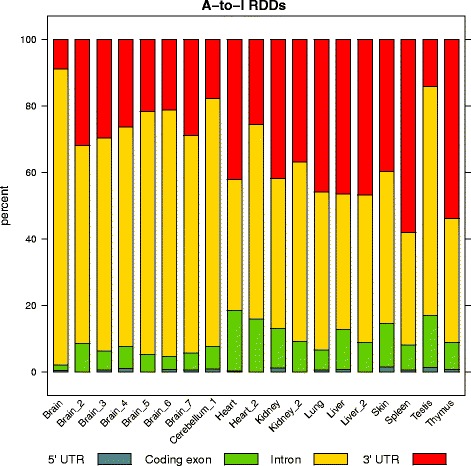
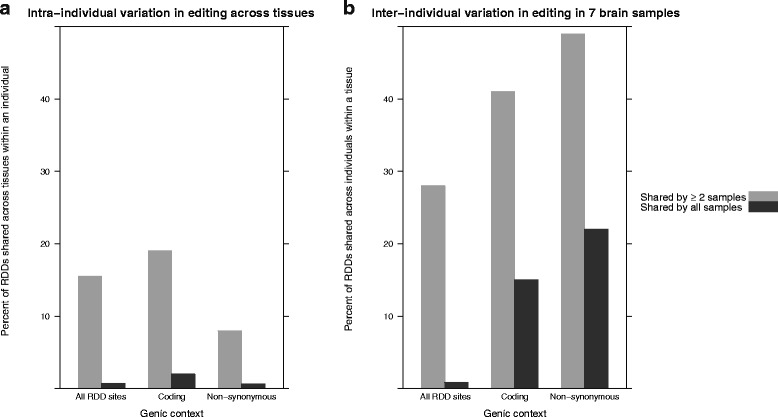
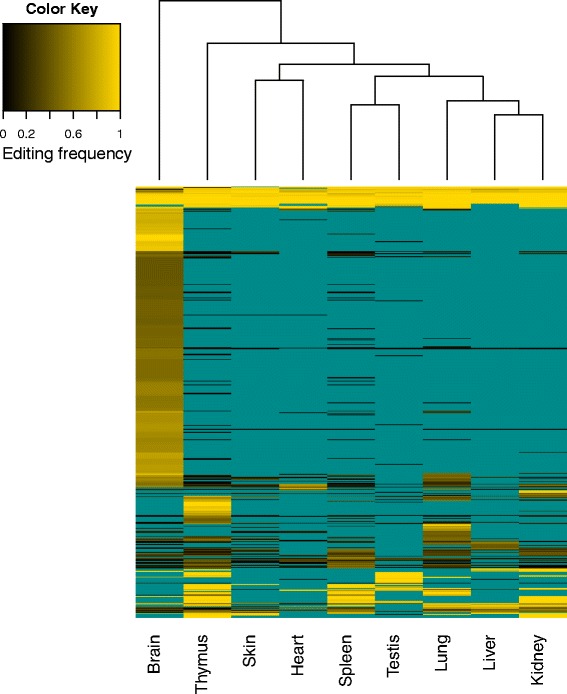
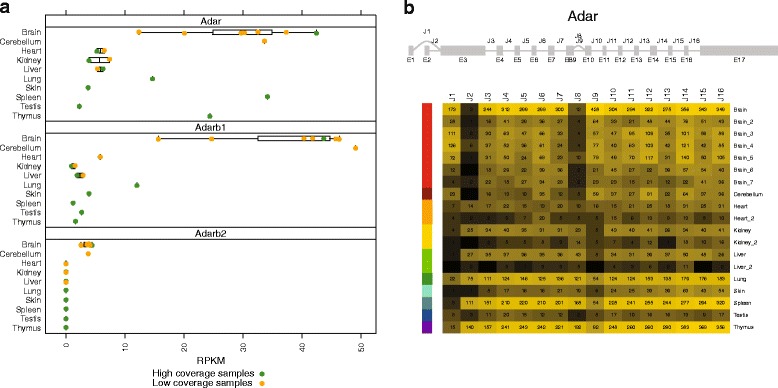
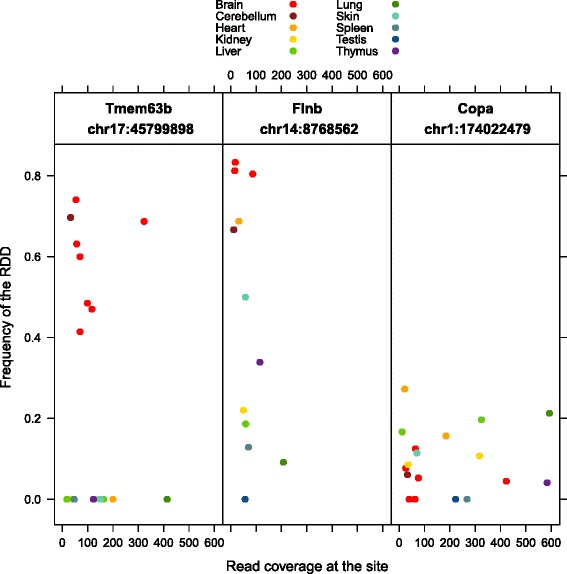
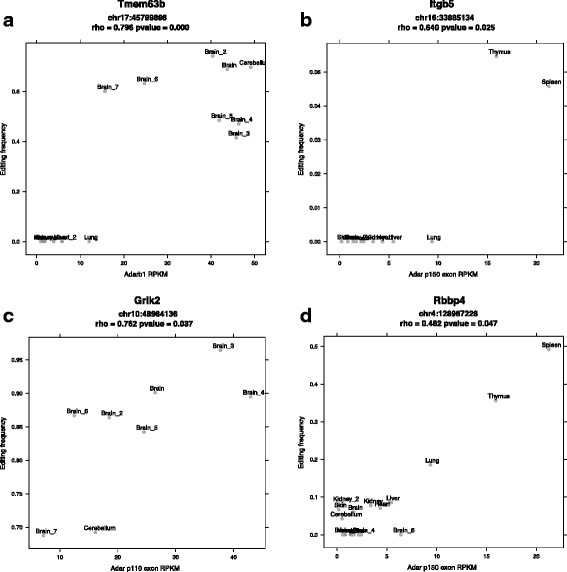
Results: Here we present an analysis of RNA-editing patterns from 9 different tissues harvested from a single mouse. For comparison, we also analyzed data for 5 of these tissues harvested from 15 additional animals. We find that tissue specificity of editing largely reflects differential expression of substrate transcripts across tissues. We identified a surprising enrichment of editing in intronic regions of brain transcripts, that could account for previously reported higher levels of editing in brain. There exists a small but remarkable amount of editing which is tissue-specific, despite comparable expression levels of the edit site across multiple tissues. Expression levels of editing enzymes and their isoforms can explain some, but not all of this variation.

Conclusions: Together, these data suggest a complex regulation of the RNA-editing process beyond transcript expression levels.


Figures

Fig. 1
Fig. 1
Experimental design (a) and sequencing processing workflow to call RNA-DNA differences (RDDs) (b). Tissues were harvested from an 8 week old male C57BL/6J mouse. RNA was isolated from 9 tissues and individually used for 100 bp paired-end RNA-sequencing. After alignment to the mm9 genome the number of uniquely mapped reads (umr) was between 28 million and 77 million for each tissue sample. DNA was extracted from the brain and spleen tissues, and sent for 75 bp paired end whole genome sequencing, to average depths of 31X and 23X coverage (586 and 445 million uniquely mapped reads, respectively)
Fig. 2
Fig. 2
The total number of A-to-G RNA-DNA differences (RDDs) called in each sample, versus the number or analyzed base pairs (number of uniquely mapped reads × length of reads) (a). The nine samples with the largest number of analyzed base pairs correspond with the high coverage samples generated in this study. The lower coverage samples were derived from previously published datasets. The high coverage brain sample in this study is remarkable for having a higher amount of RDDs. However, when all RDDs that overlap an intron are discarded the high coverage brain sample is no longer a strong outlier compared to the other high coverage tissues (b)
Fig. 3
Fig. 3
Relative proportions of where A-to-I RDDs are located within genes (5’ UTR, coding exons, introns, and 3’ UTR), across samples. The lower coverage samples derived from previously published datasets are denoted by an underscore and number following the tissue name. The percent of A-to-I RDDs that are intronic is consistently higher within brain samples, including the lower coverage brain samples
Fig. 4
Fig. 4
Variation in editing sites across 9 tissues within an individual (a). Inter-individual variation in editing within a tissue, across 7 individuals (b). An editing site was considered shared if it was called as an RDD in more than one sample, regardless of the editing frequency. RDD sites were further classified as coding and non-synonymous according to RefSeq gene annotations
Fig. 5
Fig. 5
A-to-I editing frequency at 575 sites across nine tissues, represented as a heatmap. These sites were selected on the basis of having at least 10X coverage and an editing frequency > 0.4 in at least one tissue. Tissues for which the coverage was < 10X at a site appear as cyan, and these correspond to sites that would have been removed during the variant filtering process for calling RDDs. Very few sites are highly edited across all nine tissues. Most sites that are edited in only one tissue are often not expressed (insufficient read coverage) in the other tissues
Fig. 6
Fig. 6
Expression level of Adar, Adarb1, and Adarb2 genes across tissues, as measured by RPKM (a). Splice junction usage across samples for ADAR transcripts (b). Raw counts of reads supporting each splice junction in each sample are included as text in the cells of the isoform heatmap. The heatmap color gradient represents the l o g2(F P K M+1) for each junction and scales from minimum (black) to maximum (yellow). ADAR is known to have a shorter, typically brain specific protein isoform (referred to as p110), and a more ubiquitously expressed longer protein isoform (p150). These two isoform variants are distinguished by the alternate 5’ UTRs that are used by the J1 and J2 mutually exclusive splicing events. J1 produces the shorter p110 isform while J2 produces the longer p150 isoform. Of note, an internal alternative splicing event, J8, tends to co-occur with the p150 isoform, while the J9 splice appears more frequently in samples with higher p110 isoform usage
Fig. 7
Fig. 7
The variability in editing frequency per site across tissues. Three sites where the RDD encodes a non-synonymous change were selected and presented here (Tmem63b, Flnb, and Copa). Only samples with ≥ 10X coverage at these sites are plotted
Fig. 8
Fig. 8
The correlation of editing frequency per site across samples with editing enzyme expression. Binary (edited vs. not edited) correlation patterns were observed for the non-synonymous edits in Tmem63b and Itgb5 with Adarb1 and Adar p150, respectively (a, b). Continuous correlation patterns were observed for the exonic editing sites in Grik2 and Rbbp4 with Adar p110 and Adar p150, respectively (c, d). Only samples with ≥ 10X coverage at these sites are plotted

Similar articles

Cited by

References

    1. Gott JM, Emeson RB. Functions and mechanisms of RNA editing. Annu Rev Genet. 2000;34:499–531. doi: 10.1146/annurev.genet.34.1.499. - DOI - PubMed
    1. Polson AG, Crain PF, Pomerantz SC, McCloskey JA, Bass BL. The mechanism of adenosine to inosine conversion by the double-stranded RNA unwinding/modifying activity: a high-performance liquid chromatography-mass spectrometry analysis. Biochemistry. 1991;30:11507–14. doi: 10.1021/bi00113a004. - DOI - PubMed
    1. Savva YA, Rieder LE, Reenan RA. The ADAR protein family. Genome Biol. 2012;13:252–2012. doi: 10.1186/gb-2012-13-12-252. - DOI - PMC - PubMed
    1. Bass BL. RNA editing by adenosine deaminases that act on RNA. Annu Rev Biochem. 2002;71:817–46. doi: 10.1146/annurev.biochem.71.110601.135501. - DOI - PMC - PubMed
    1. Nishikura K. Functions and regulation of RNA editing by ADAR deaminases. Annu Rev Biochem. 2010;79:321–49. doi: 10.1146/annurev-biochem-060208-105251. - DOI - PMC - PubMed