. 2016 Feb 23;110(4):860-9.
doi: 10.1016/j.bpj.2015.10.053. Epub 2016 Jan 5.

Site-Specific Cryo-focused Ion Beam Sample Preparation Guided by 3D Correlative Microscopy

Affiliations

Site-Specific Cryo-focused Ion Beam Sample Preparation Guided by 3D Correlative Microscopy

Jan Arnold et al. Biophys J. .

Abstract

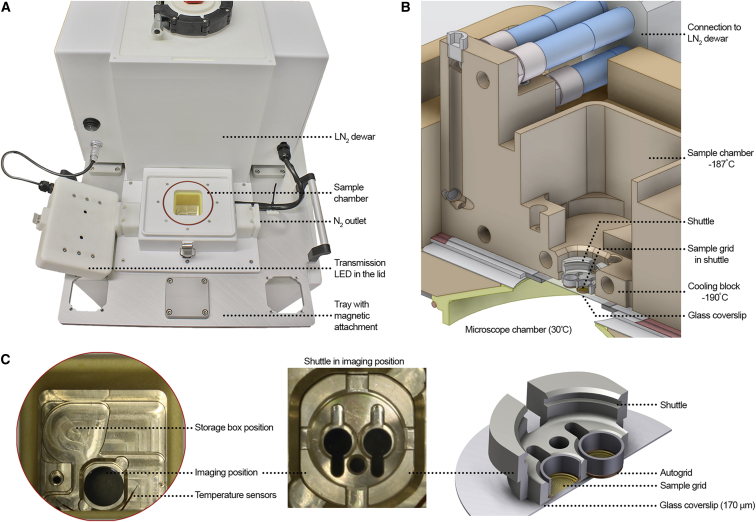
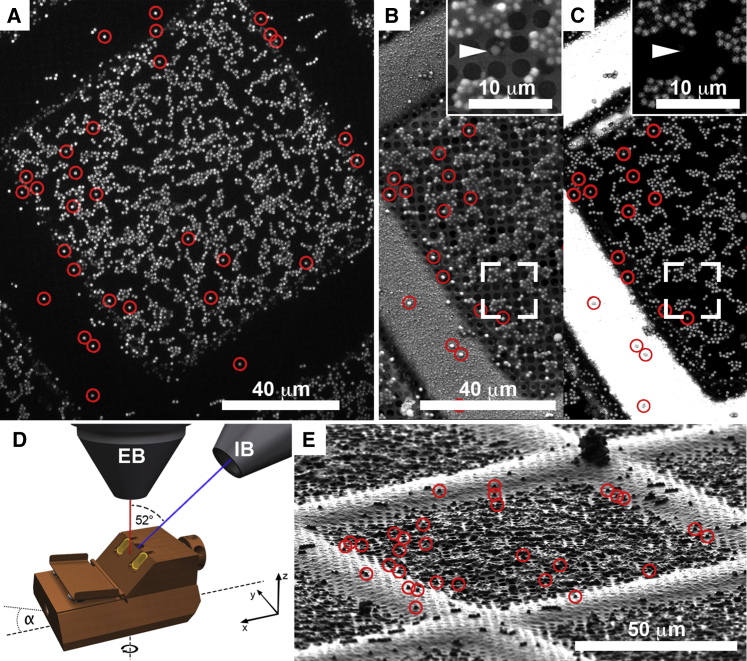
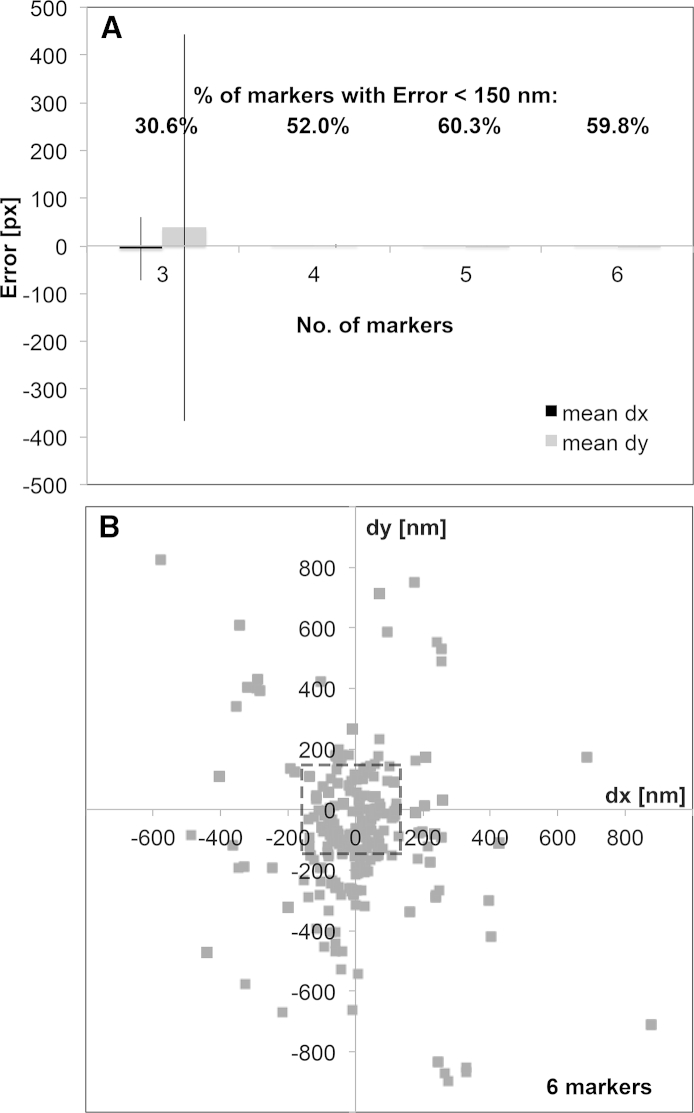
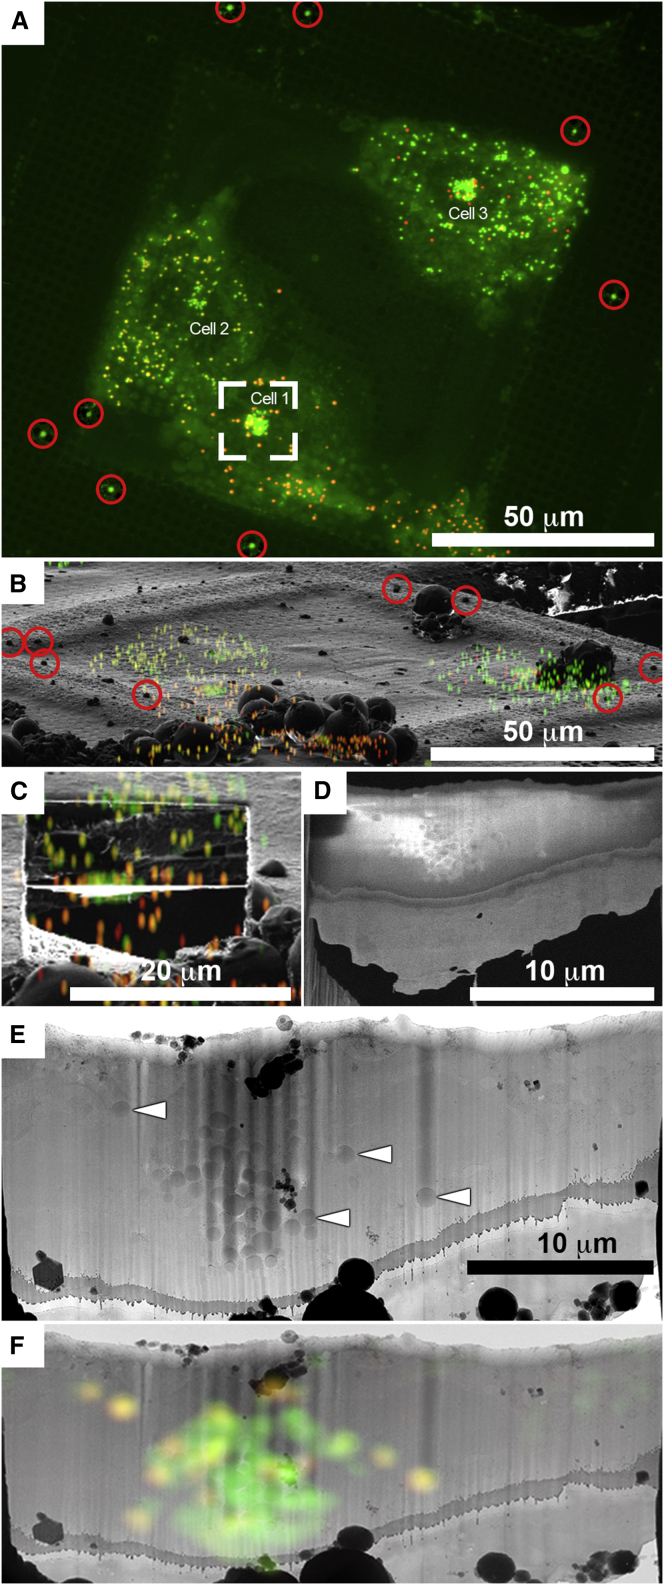
The development of cryo-focused ion beam (cryo-FIB) for the thinning of frozen-hydrated biological specimens enabled cryo-electron tomography (cryo-ET) analysis in unperturbed cells and tissues. However, the volume represented within a typical FIB lamella constitutes a small fraction of the biological specimen. Retaining low-abundance and dynamic subcellular structures or macromolecular assemblies within such limited volumes requires precise targeting of the FIB milling process. In this study, we present the development of a cryo-stage allowing for spinning-disk confocal light microscopy at cryogenic temperatures and describe the incorporation of the new hardware into existing workflows for cellular sample preparation by cryo-FIB. Introduction of fiducial markers and subsequent computation of three-dimensional coordinate transformations provide correlation between light microscopy and scanning electron microscopy/FIB. The correlative approach is employed to guide the FIB milling process of vitrified cellular samples and to capture specific structures, namely fluorescently labeled lipid droplets, in lamellas that are 300 nm thick. The correlation procedure is then applied to localize the fluorescently labeled structures in the transmission electron microscopy image of the lamella. This approach can be employed to navigate the acquisition of cryo-ET data within FIB-lamellas at specific locations, unambiguously identified by fluorescence microscopy.


Figures

Figure 1
Figure 1
Design of cryo-stage and shuttle system. (A) FEI CorrSight Cryo-Module (cryo-stage). (B) Schematic representation of the cryo-stage in cross sections. (C) Left: magnified view of the sample chamber. Center: shuttle in imaging position. Right: schematic representation of the magnified shuttle with samples in autogrids. Distance between vitrified sample and glass cover slip is 200 μm.
Figure 2
Figure 2
Magnetic beads with 1 μm diameter used as fiducial markers for FLM and SEM/FIB correlation. (A) Maximum intensity projection of a spinning-disk confocal stack at an excitation wavelength of 488 nm. Beads are autofluorescent at this wavelength. (B) SE SEM image shows the grid surface topography corresponding to the left half of (A). Inset: higher magnification of area within frame. (C) EBSD SEM image of the same area as in (B). The signal from the iron oxide in the magnetic beads is detectable by the back-scattered electron detector. Inset: magnified view of frame. One ice crystal is marked in the magnified secondary electron image (B) is not visible in the EBSD image (arrowhead). (D). Schematic representation of the SEM/FIB chamber with respect to the FIB shuttle. The FIB shuttle at the grid position has a pretilt of 45°. α, stage tilt. (E) Ion beam view at an angle of 18° with respect to the grid plane (α: 25°). Red circles in (A)–(C) and (E) indicate representative markers used for calculating the correlation accuracy.
Figure 3
Figure 3
Measurement of the correlation accuracy from FLM to FIB. (A) Mean ± SD of deviation from prediction in x and y (error) as a function of the number of markers used for calculating the correlation. px = 161.25 nm. Percentages represent the fraction of markers for which the average deviation was smaller than 150 nm. (B) Scatter plot of errors in x and y when six markers are used for correlation. Almost 60% of the cross-validated markers are localized with an accuracy better than 150 nm (dashed box).
Figure 4
Figure 4
Three-dimensional correlation applied to synchronized HeLa cell culture for targeting fluorescently labeled lipid droplets. (A) Maximum intensity projection of the spinning-disk confocal volume. Green shows general neutral lipid droplets dye and magnetic beads used as fiducials (levels were adjusted separately inside red circles for better visualization of the fiducials). Red shows neutral fatty acids dye. (B) FIB image at the same sample position overlaid with FLM data after applying transformation. Three-dimensional correlation was performed with the encircled eight beads in (A) and (B). (C and D) A thin lamella was produced by FIB milling. (C) FIB view overlaid with FLM data after applying transformation. (D) SEM top view. (E) Cryo-TEM montage of lamella. Lamella orientation as in (D). Arrowheads indicate some of the electron dense LDs. (F) Overlay of cryo-TEM montage of lamella with a computer-generated oblique slice through the confocal volume. LDs stained in green or red are distinguishable within the lamella.

References

    1. Mahamid J., Baumeister W. Cryo-electron tomography: the realization of a vision. Microsc. Microanal. 2012;26:45–48.
    1. Dubochet J., Adrian M., Schultz P. Cryo-electron microscopy of vitrified specimens. Q. Rev. Biophys. 1988;21:129–228. - PubMed
    1. Lucić V., Förster F., Baumeister W. Structural studies by electron tomography: from cells to molecules. Annu. Rev. Biochem. 2005;74:833–865. - PubMed
    1. Hsieh C., Schmelzer T., Marko M. Practical workflow for cryo focused-ion-beam milling of tissues and cells for cryo-TEM tomography. J. Struct. Biol. 2014;185:32–41. - PMC - PubMed
    1. Mahamid J., Schampers R., Plitzko J.M. A focused ion beam milling and lift-out approach for site-specific preparation of frozen-hydrated lamellas from multicellular organisms. J. Struct. Biol. 2015;192:262–269. - PubMed

Publication types

MeSH terms