

Antisense transcription as a tool to tune gene expression
- PMID: 26769567
- PMCID: PMC4731013
- DOI: 10.15252/msb.20156540
Antisense transcription as a tool to tune gene expression
Abstract
A surprise that has emerged from transcriptomics is the prevalence of genomic antisense transcription, which occurs counter to gene orientation. While frequent, the roles of antisense transcription in regulation are poorly understood. We built a synthetic system in Escherichia coli to study how antisense transcription can change the expression of a gene and tune the response characteristics of a regulatory circuit. We developed a new genetic part that consists of a unidirectional terminator followed by a constitutive antisense promoter and demonstrate that this part represses gene expression proportionally to the antisense promoter strength. Chip-based oligo synthesis was applied to build a large library of 5,668 terminator-promoter combinations that was used to control the expression of three repressors (PhlF, SrpR, and TarA) in a simple genetic circuit (NOT gate). Using the library, we demonstrate that antisense promoters can be used to tune the threshold of a regulatory circuit without impacting other properties of its response function. Finally, we determined the relative contributions of antisense RNA and transcriptional interference to repressing gene expression and introduce a biophysical model to capture the impact of RNA polymerase collisions on gene repression. This work quantifies the role of antisense transcription in regulatory networks and introduces a new mode to control gene expression that has been previously overlooked in genetic engineering.
Keywords: antisense transcription; design automation; genetic circuits; synthetic biology; systems biology.
© 2016 The Authors. Published under the terms of the CC BY 4.0 license.
Figures
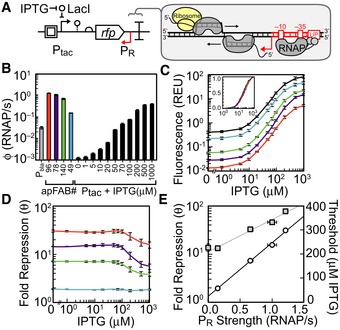
A schematic showing the antisense transcription reporter system. A constitutive promoter (red) at the 3′‐end of rfp represses gene expression by firing polymerases at the forward promoter Ptac (black).
Strengths of the constitutive promoters used as
PR (colors) and the forward promoter (Ptac) at different inducer concentrations. The reference promoter (Pbla) used to calculate promoter strength in units of polymerase firings per second is shown (see Appendix for methods, promoter sequences, and plasmid maps).Response functions for Ptac with different antisense promoters located at the 3′‐end of
RFP : no promoter, black; antisense promoters of different strength, colors as in (B). The inset is the log10 transform of the same data normalized by min and max.The fold repression (equation (1)) is shown as a function of the induction of the forward promoter. The colors correspond to antisense promoters of different strength (B).
The maximum fold repression (white circles) or threshold (gray squares) is shown as a function of antisense promoter strength. The induction threshold K was calculated by fitting equation (1) to the data in (C). The lines are linear and exponential fits to the threshold (R2 = 0.9876) and repression (R2 = 0.99737) data, respectively.
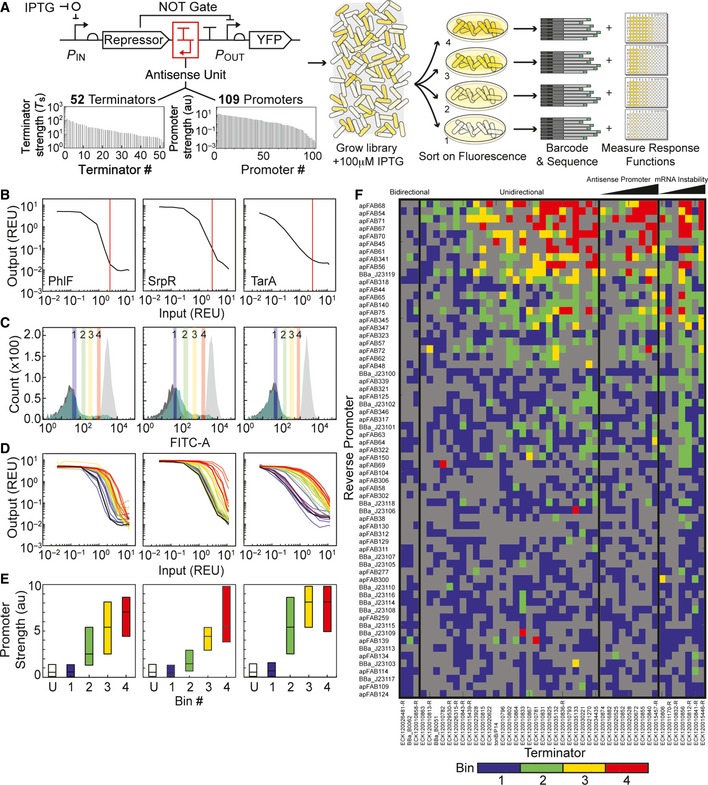
Library construction and flow‐seq screening used to measure the impact of terminator/antisense promoter pairs on NOT gate performance. All combinations of 52 unidirectional terminators and 109 promoters were constructed to create a library of 5,668 transcriptional interference constructs. The terminator and promoter strengths shown were measured previously (Chen et al, 2013; Kosuri et al, 2013; Mutalik et al, 2013). The library was synthesized as oligonucleotides, then cloned into genetic
NOT gates at the 3′‐end of the repressor gene (red box). Each library was transformed into Escherichia coli, grown with 100 μMIPTG , and sorted into bins of varyingYFP fluorescence to find constructs with increased induction thresholds. Bacteria from each bin were plated on solid media, and individual colonies were selected to measure the full response function of sorted variants. Plates were scraped to isolate plasmids from bacteria in each bin, and plasmidDNA was barcoded and deep‐sequenced (Materials and Methods).Response functions of the starting
NOT gates (no antisense promoters) built with TetR homologs: PhlF (left), SrpR (center), TarA (right). The response functions are measured using Ptac activity as the input andYFP as the output. Ptac activity was measured using a separate plasmid system and converted intoREU with a reference standard (see Appendix for plasmid maps). Vertical lines (red) demarcate Ptac activity with 100 μMIPTG , the inducer concentration used to sort libraries.Fluorescence histograms of the unmodified
NOT gates and libraries before sorting. Eachunmodified NOT gate was grown with 0 μM (light gray) and 100 μM (dark gray)IPTG to set upper and lower bounds for sorting, respectively. Libraries (green) were sorted into four bins, shown as colored vertical bars and numbered by increasing fluorescence.Response functions of twenty four randomly selected clones from the sorted libraries colored by the bin in which they were found (coloring is same as in C). The response functions of the
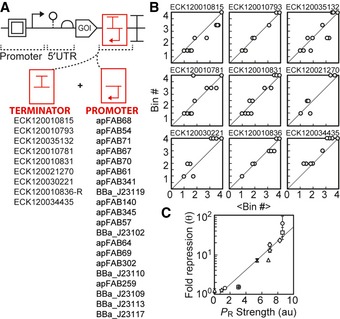
NOT gates lacking antisense promoters are shown in black.Deep sequencing revealed the identities of antisense promoters in each bin. Previously measured values, shown in (A), were used to calculate the median promoter strength of parts sorted into each bin. Box plots display the median, with hinges indicating the first and third quartiles. The unsorted library is marked “U”.
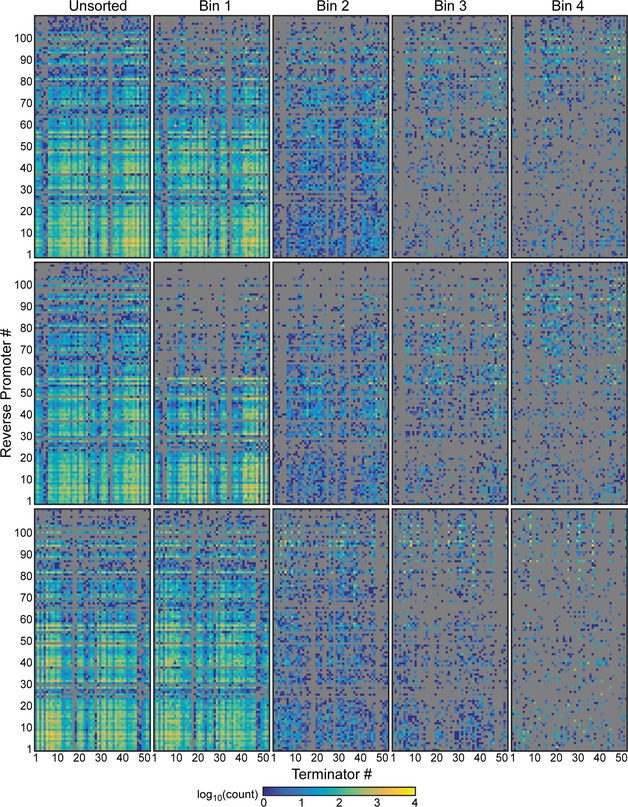
Heat map shows the bin in which each terminator/promoter pair was most enriched. Promoters are rank ordered by their strength, with the strongest at the top. The terminators were grouped based on known or predicted terminator features and sorted by the predicted strength of a cryptic antisense promoter or impact on
mRNA stability, if relevant (Materials and Methods). Unidirectional terminators were sorted based on similarity in their profiles across the promoter set. Terminator/promoter combinations that are not enriched in any of the bins are colored gray. Columns and rows > 90% gray were removed from the enrichment grid.
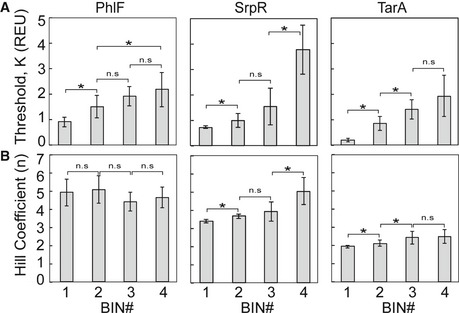
Average thresholds K for
NOT gates sorted into each bin of the PhlF (left), SrpR (middle), and TarA (right) libraries.Hill coefficients n for the same NOT gates.
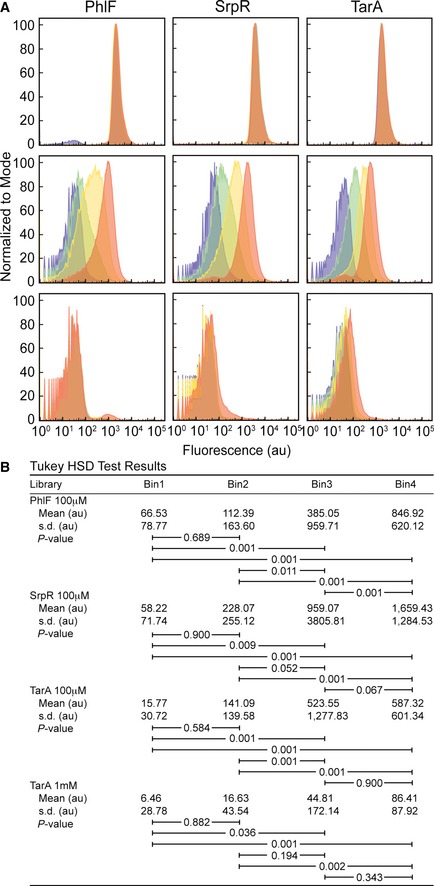
The fluorescence histogram of cells from the PhlF (left), SrpR (middle), and TarA (right) libraries. Fluorescence was measured using flow cytometry in
ON (0 μMIPTG , top), threshold (100 μMIPTG , middle), andOFF (1,000 μMIPTG , bottom) conditions. Histograms are colored by bin: 1, purple; 2, green; 3, yellow; 4, orange. One hundred randomly selected individual cells from each data set were used as input to one‐wayANOVA tests. There were no statistically significant differences between group means for the PhlFON (F(3, 396) = 1.06, P = 36.67) andOFF (F(3, 396) = 1.54, P = 20.48) conditions, the SrpRON (F(3, 396) = 1.22, P = 30.04) andOFF (F(3, 396) = 1.41, P = 23.87) conditions, or the TarAON (F(3, 396) = 1.25, P = 29.19) condition. There are significant differences between group means for the threshold conditions: PhlF (F(3, 396) = 34.67, P = 5.42E‐18), SrpR (F(3, 396) = 13.3, P = 2.65E‐8), TarA (F(3, 396) = 15.71, P = 1.13E‐9) and the TarAOFF condition (F(3, 396) = 7.85, P = 0.0042).Post hoc comparisons using the Tukey
HSD test for the PhlF threshold, SrpR threshold, TarA threshold, and TarAOFF conditions. Mean fluorescence values of the groups are shown in arbitrary units (au). Brackets indicate TukeyHSD comparisons with P‐values listed.
The flow‐seq data were used to identify a subset of promoters and terminators that could be combined to obtain a reliable reduction in gene expression.
Each graph shows a terminator (name at top), and each point is a promoter from the list in (A). The x‐axis (<Bin#>) is the average for the promoter across the complete terminator set, and the y‐axis (Bin#) is the bin for the specific terminator. The Bin# is calculated as described in Fig 2F.
Repression was explicitly measured for a subset of terminator/promoter pairs selected from (A). The pairs were cloned into the plasmid from (A) with Ptac and yfp, and fold repression (equation (1)) was measured as a function of the forward promoter activity (see Appendix Table S1 for terminator/promoter combinations tested). Maximum fold repression is plotted against the previously measured promoter activities (Kosuri et al, 2013); R 2 = 0.9275. Composite parts are marked by terminator (
ECK 120035132, circle;ECK 120010831, square;ECK 120034435, triangle;ECK 120021270, diamond;ECK 120010793, star;ECK 120030221, x;ECK 120010815, +). Data represent the mean of three experiments performed on different days, and the error bars are the standard deviation of these measurements.
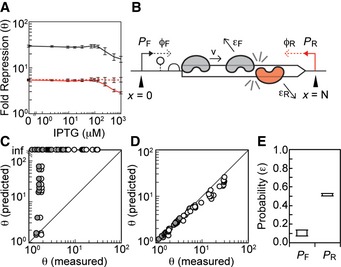
The total fold repression θ generated by the ap
FAB 96 antisense promoter is shown as a function of forward promoter activity using the characterization system in Fig 1A (black line). This is compared to the repression observed when the same promoter is used to drive the transcription of asRNA in trans from a separate plasmid (dashed red line) (Appendix Fig S5). The repression due to transcriptional interference θTI (solid red line) is inferred from the total and trans asRNA repression data (see text for details).Schematic of the transcriptional interference model. A forward
PF and antisensePR promoter are located on either side of a gene, N bases apart. The promoters fire at rates ϕF and ϕRRNAP /second. Polymerases transcribe at a constant velocity v unless they collide with polymerases fired from opposing promoter. Polymerases collide and dissociate from theDNA with a probability ε.Comparison of model predictions to experimental data when ε F = ε R = 1. Each data point shows experimentally measured repression (θ ‐ white, θ
TI ‐ gray) for eachPF /PR pair plotted against model predictions generated with the same promoter combinations. Repressions predicted by the model were calculated using equation (5).Comparison of model predictions to experimental data for the highest scoring ε F and ε R. The optimal ε F and ε R values simulate repression closest to the experimentally measured value (Materials and Methods). Data points show experimentally measured repression (θ – white, θTI – gray) for each
PF /PR pair plotted against model results generated with the optimal ε F and ε R values for each promoter combination.The range of optimal ε values that result from fitting the model to θ (which assumes that transcriptional interference is the sole mechanism of repression) or θ
TI (which is the minimum amount of repression attributable to transcriptional interference). Box plot extends from the median optimal ε F and ε R when the model is fit to θTI (<ε F> = 0.07, <ε R> = 0.52) to median optimal ε F and ε R when the model is fit to θ (<ε F> = 0.14, <ε R> = 0.47).
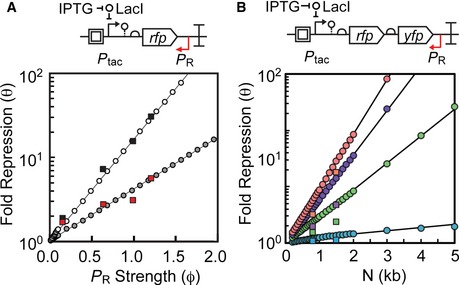
Top: schematic showing the antisense transcription reporter system. Bottom: model simulations where ϕR is varied from 0 to 2 at increments of either 0.01 or 0.1 (1/s). For these simulations, εF was set to the median value fit by θ
TI (εF = 0.07, white circles) or θ (εF = 0.14, gray circles) and ε R was held constant at 0.515. Experimental results for θ (black squares) and θTI (red squares) are also shown as a function of antisense promoter strength. Data from Fig 4A and Appendix Fig S13.Top: Schematic showing the antisense transcription reporter system with greater distance between
PF andP R. A second fluorescent protein yfp was added between the 3′‐end of rfp andPR to increase the distance between promoters from 841 to 1,500 bp. Plasmid maps in Appendix Fig S8. Bottom: model simulations where N is varied from 200 to 5,000 bp in increments of 50, 100, or 1,000 bp.PR was simulated as apFAB 49, apFAB 140, apFAB 78, and apFAB 96 by setting ϕR to values of 0.15345RNAP /s (blue circles), 0.64814RNAP /s (green circles), 1.014108RNAP /s (purple circles), and 1.231852RNAP /s (red circles), respectively. For all simulations in this figure, ϕF was held constant at 0.03976 (to simulate Ptac + 100 μMIPTG ) and εF and εR were set at the median optimum values: 0.07 and 0.515, respectively. Experimental results showRFP andYFP repression with four different antisense promoters: apFAB 49 (blue squares), apFAB 140 (green squares), apFAB 78 (purple squares), and apFAB 96 (red squares).
References
Publication types
MeSH terms
Substances
LinkOut - more resources
Full Text Sources
Other Literature Sources
