

Hydrocolloids Decrease the Digestibility of Corn Starch, Soy Protein, and Skim Milk and the Antioxidant Capacity of Grape Juice
- PMID: 26770915
- PMCID: PMC4700917
- DOI: 10.3746/pnf.2015.20.4.276
Hydrocolloids Decrease the Digestibility of Corn Starch, Soy Protein, and Skim Milk and the Antioxidant Capacity of Grape Juice
Abstract
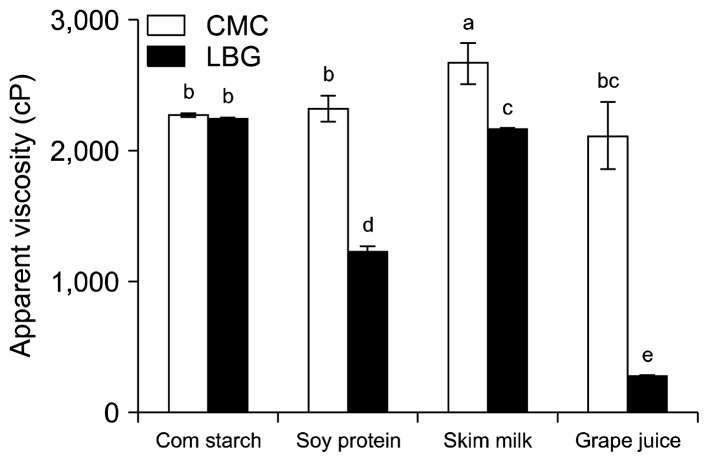
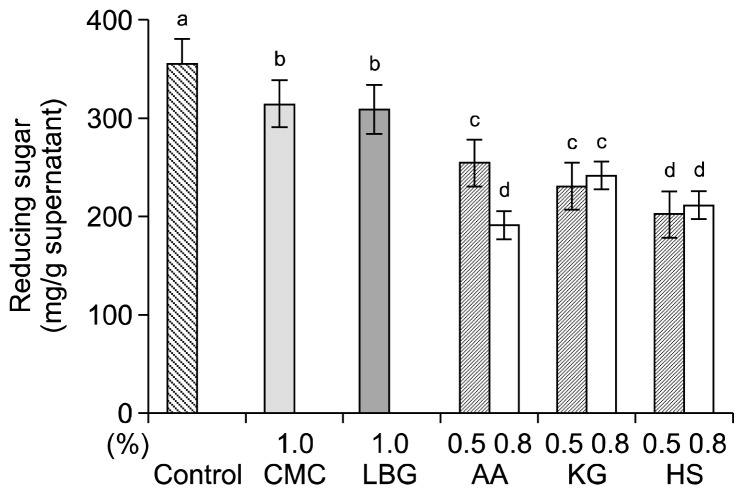
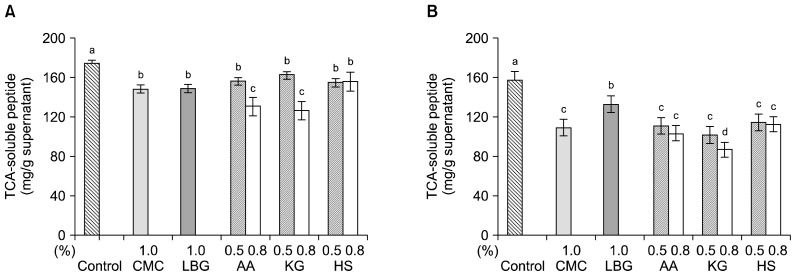
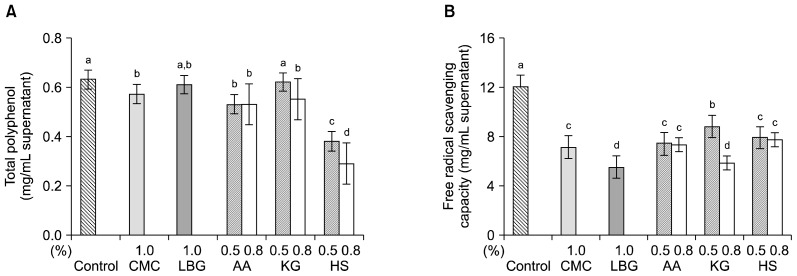
Hydrocolloids have many applications in foods including their use in dysphagia diets. We aimed to evaluate whether hydrocolloids in foods affect the digestibility of starch and protein, and their effects on antioxidant capacity. The thickening hydrocolloids: locust bean gum and carboxymethyl cellulose, and the gel-forming agents: agar agar, konjac-glucomannan, and Hot & Soft Plus were blended with corn starch and soy protein, skim milk, or grape juice and were examined for their in vitro-digestability by comparing the reducing sugar and trichloroacetic acid (TCA)-soluble peptide, for antioxidant capacity by total polyphenol contents and the 2,2-diphenyl-1-picrylhydrazyl radical scavenging activity. The hydrocolloids resulted in a decrease in starch digestibility with the gel-forming agents. Hydrocolloids diminished TCA-soluble peptides in skim milk compared to soy protein with the exception of locust bean gum and decreased free radical scavenging capacities and total phenolic contents in grape juice. Our findings may provide evidence for the use of hydro-colloids for people at risk of nutritional deficiencies such as dysphagia patients.
Keywords: hydrocolloids; in vitro-digestability; locust bean gum.
Figures
Similar articles
-
Classification of hydrocolloids based on in vitro starch digestibility and rheological properties of Segoami gel.Int J Biol Macromol. 2017 Nov;104(Pt A):442-448. doi: 10.1016/j.ijbiomac.2017.06.063. Epub 2017 Jun 13. Int J Biol Macromol. 2017. PMID: 28627390
-
Effect of hydrocolloids on starch digestion: A review.Food Chem. 2024 Jun 30;444:138636. doi: 10.1016/j.foodchem.2024.138636. Epub 2024 Feb 1. Food Chem. 2024. PMID: 38310781 Review.
-
Influence of different hydrocolloids on dough thermo-mechanical properties and in vitro starch digestibility of gluten-free steamed bread based on potato flour.Food Chem. 2018 Jan 15;239:1064-1074. doi: 10.1016/j.foodchem.2017.07.047. Epub 2017 Jul 11. Food Chem. 2018. PMID: 28873523
-
Effect of various hydrocolloids on the physical and fermentation properties of dough.Food Chem. 2019 Jan 15;271:165-173. doi: 10.1016/j.foodchem.2018.07.192. Epub 2018 Jul 26. Food Chem. 2019. PMID: 30236662
-
Structural Characterization and Functional Properties of Flaxseed Hydrocolloids and Their Application.Foods. 2022 Aug 2;11(15):2304. doi: 10.3390/foods11152304. Foods. 2022. PMID: 35954070 Free PMC article. Review.
Cited by
-
The effect of kappa-carrageenan and gum Arabic on the production of guava-banana fruit leather.J Food Sci Technol. 2022 Nov;59(11):4415-4426. doi: 10.1007/s13197-022-05521-1. Epub 2022 Jul 5. J Food Sci Technol. 2022. PMID: 35812463 Free PMC article.
-
Effects of food hydrocolloids on quality attributes of extruded red Jasmine rice noodle.PeerJ. 2020 Nov 4;8:e10235. doi: 10.7717/peerj.10235. eCollection 2020. PeerJ. 2020. PMID: 33194418 Free PMC article.
-
Effect of Intake of Food Hydrocolloids of Bacterial Origin on the Glycemic Response in Humans: Systematic Review and Narrative Synthesis.Nutrients. 2021 Jul 14;13(7):2407. doi: 10.3390/nu13072407. Nutrients. 2021. PMID: 34371917 Free PMC article.
References
-
- Kilara A, Chandan RC. Ice cream and frozen desserts. In: Chandan RC, editor. Dairy Processing and Quality Assurance. Wiley-Blackwell; Ames, IA, USA: 2008. pp. 357–386.
-
- Voragen AGJ. Technological aspects of functional food-related carbohydrates. Trends Food Sci Technol. 1998;9:328–335. doi: 10.1016/S0924-2244(98)00059-4. - DOI
-
- Linden P, Siebens AA. Dysphagia: predicting laryngeal penetration. Arch Phys Med Rehabil. 1983;64:281–284. - PubMed
LinkOut - more resources
Full Text Sources
Other Literature Sources
Medical