. 2016 Jan 15;11(1):e0146549.
doi: 10.1371/journal.pone.0146549. eCollection 2016.

LEDGF/p75 Overexpression Attenuates Oxidative Stress-Induced Necrosis and Upregulates the Oxidoreductase ERP57/PDIA3/GRP58 in Prostate Cancer

Affiliations

LEDGF/p75 Overexpression Attenuates Oxidative Stress-Induced Necrosis and Upregulates the Oxidoreductase ERP57/PDIA3/GRP58 in Prostate Cancer

Anamika Basu et al. PLoS One. .

Abstract

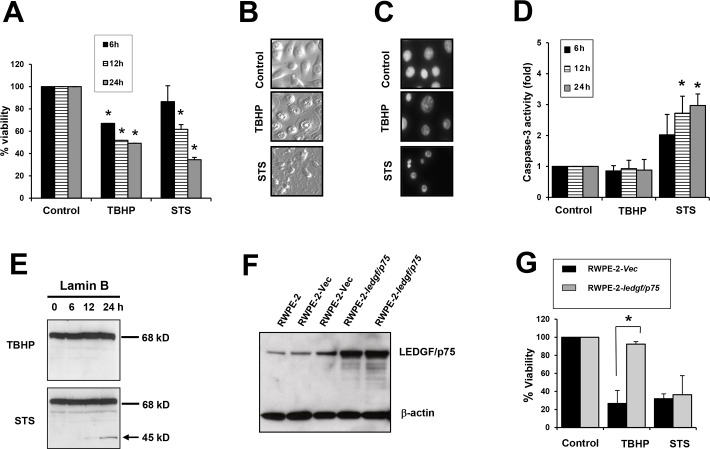
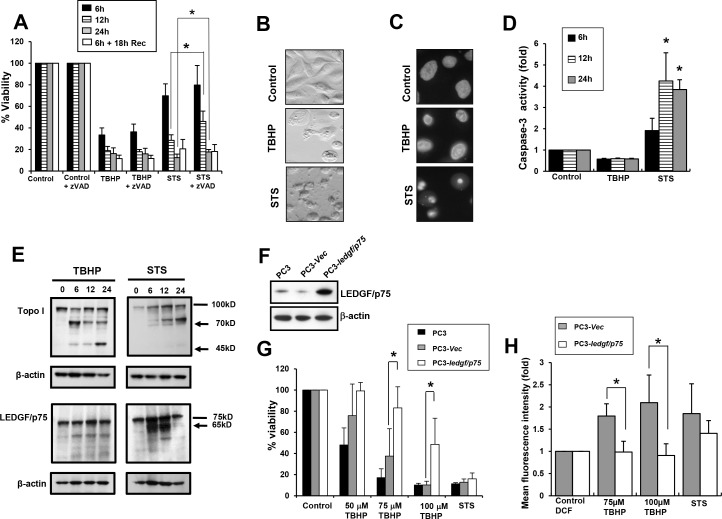
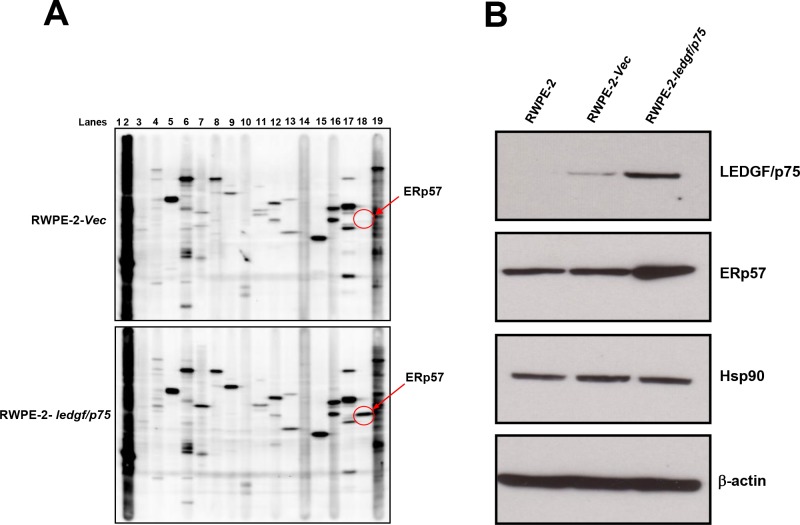
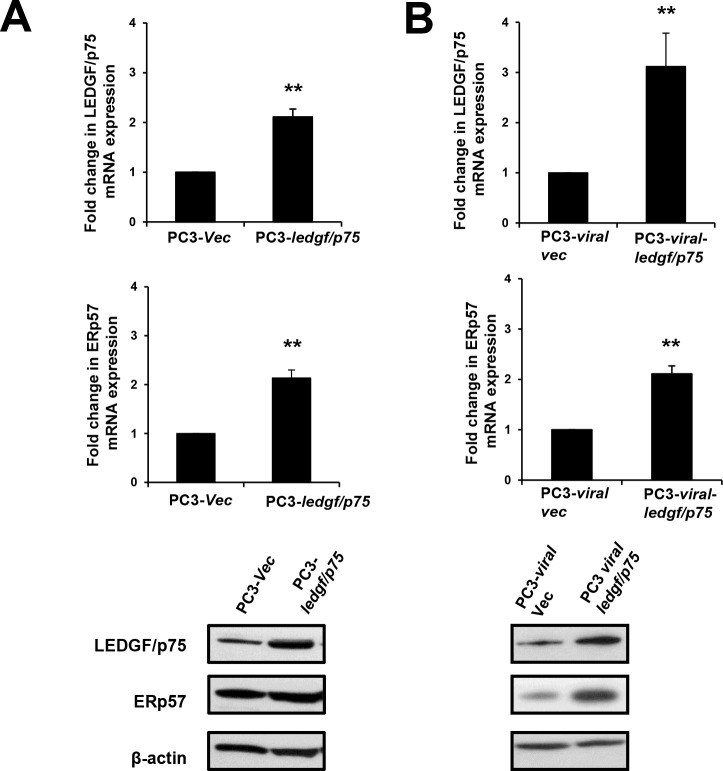
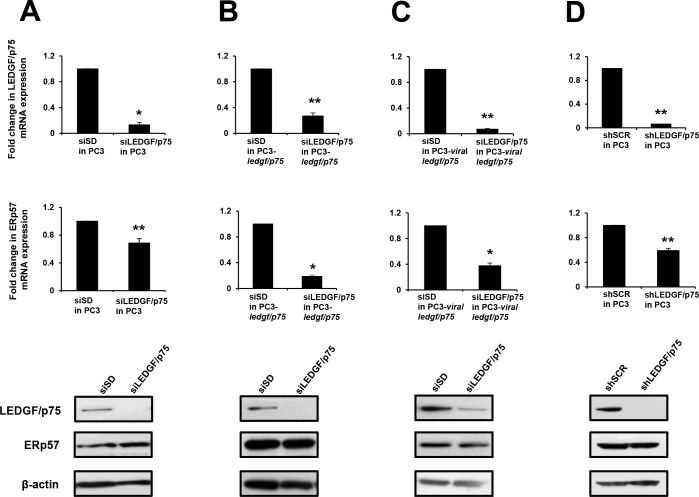
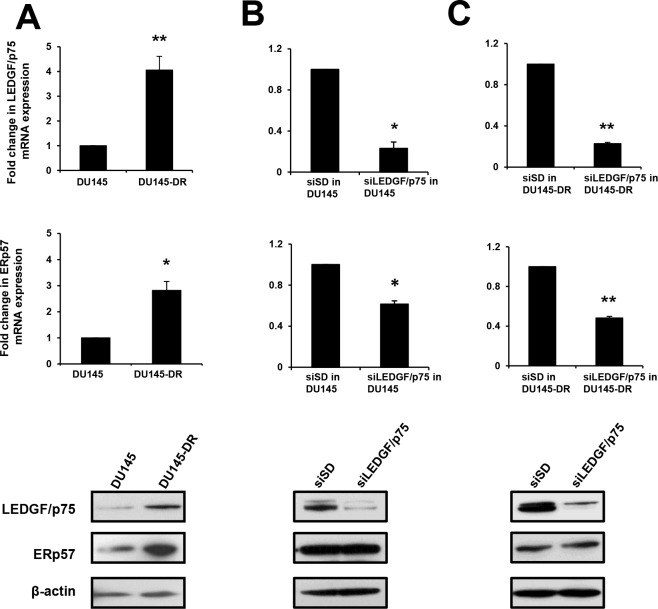
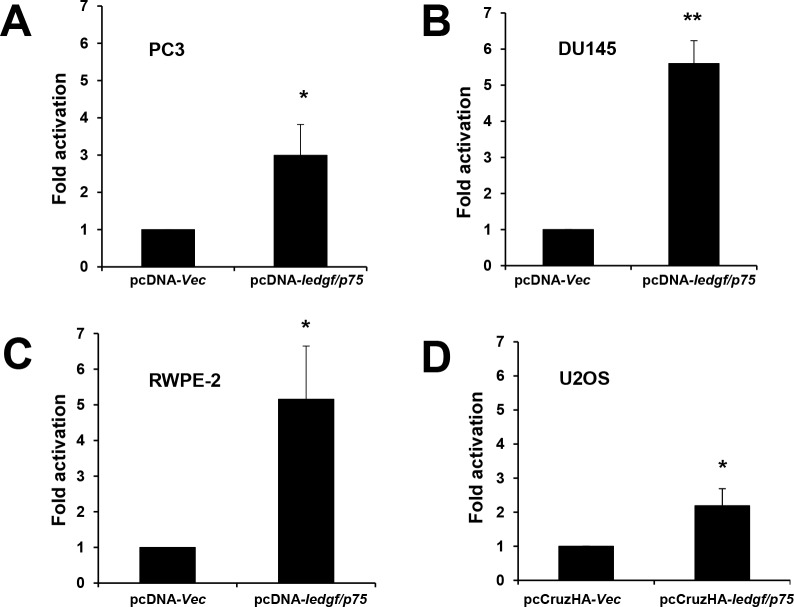
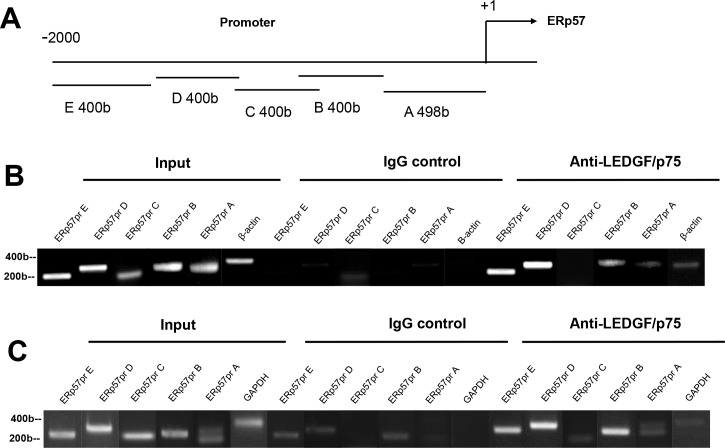
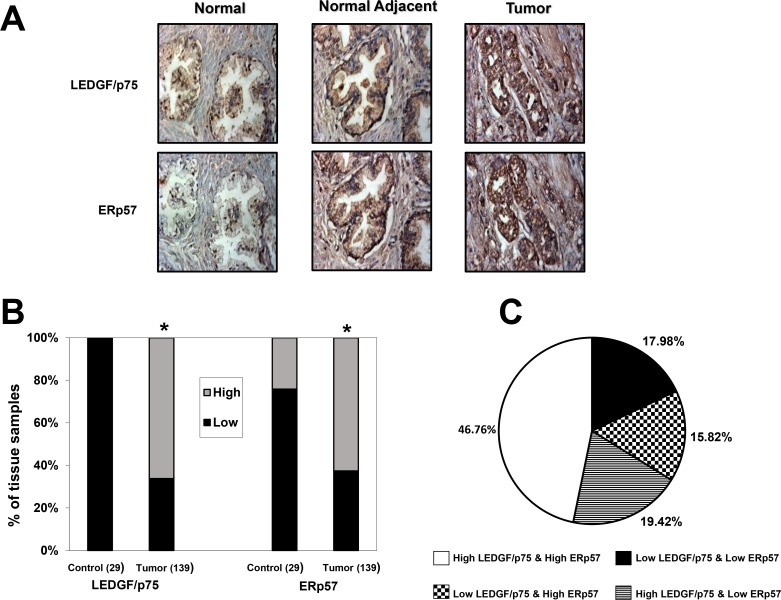
Prostate cancer (PCa) mortality is driven by highly aggressive tumors characterized by metastasis and resistance to therapy, and this aggressiveness is mediated by numerous factors, including activation of stress survival pathways in the pro-inflammatory tumor microenvironment. LEDGF/p75, also known as the DFS70 autoantigen, is a stress transcription co-activator implicated in cancer, HIV-AIDS, and autoimmunity. This protein is targeted by autoantibodies in certain subsets of patients with PCa and inflammatory conditions, as well as in some apparently healthy individuals. LEDGF/p75 is overexpressed in PCa and other cancers, and promotes resistance to chemotherapy-induced cell death via the transactivation of survival proteins. We report in this study that overexpression of LEDGF/p75 in PCa cells attenuates oxidative stress-induced necrosis but not staurosporine-induced apoptosis. This finding was consistent with the observation that while LEDGF/p75 was robustly cleaved in apoptotic cells into a p65 fragment that lacks stress survival activity, it remained relatively intact in necrotic cells. Overexpression of LEDGF/p75 in PCa cells led to the upregulation of transcript and protein levels of the thiol-oxidoreductase ERp57 (also known as GRP58 and PDIA3), whereas its depletion led to ERp57 transcript downregulation. Chromatin immunoprecipitation and transcription reporter assays showed LEDGF/p75 binding to and transactivating the ERp57 promoter, respectively. Immunohistochemical analysis revealed significantly elevated co-expression of these two proteins in clinical prostate tumor tissues. Our results suggest that LEDGF/p75 is not an inhibitor of apoptosis but rather an antagonist of oxidative stress-induced necrosis, and that its overexpression in PCa leads to ERp57 upregulation. These findings are of significance in clarifying the role of the LEDGF/p75 stress survival pathway in PCa.


Conflict of interest statement

Competing Interests: One of the authors, HB, is employed by a commercial company—Novartis Pharmaceutical Oncology. Novartis provided support in the form of salary for HB, but did not have any additional role in the study design, data collection and analysis, decision to publish, or preparation of the manuscript. This commercial affiliation does not alter the authors' adherence to PLOS ONE policies on sharing data and materials.

Figures

Fig 1
Fig 1. Overexpression of LEDGF/p75 in RWPE-2 cells attenuates TBHP-induced necrosis but not STS-induced apoptosis.
A. RWPE-2 cells were treated with 100 μM TBHP or 4 μM STS to induce necrosis or apoptosis, respectively. Cell viability was assessed by Crystal Violet assay. B. Changes in cellular morphology associated with necrosis or apoptosis in RWPE-2 cells treated with TBHP or STS, respectively, for 24 hours. C. Nuclear morphology of RWPE-2 cells (treated as in panel B) visualized by DAPI staining. D. Caspase 3 activity was measured after treatment with TBHP or STS. E. Cleavage of Lamin B into its signature apoptotic 45 kD fragment was detected by immunoblotting in RWPE-2 cells treated with STS but not in TBHP-treated cells. Lines indicate bands corresponding to intact proteins and the arrow points to the cleavage fragment. F. Immunoblot showing stable overexpression of LEDGF/p75 in RWPE-2–ledgf/p75 clones as compared to RWPE-2 Vec (empty pcDNA3.1 vector) clones and untransfected RWPE-2 cells. G. Crystal violet viability assay showing that overexpression of LEDGF/p75 in RWPE-2 cells promotes resistance to cell death induced by TBHP but not STS. Each graph represents the average of at least 3 independent experiments performed in triplicates (*P<0.05). P values were determined in comparison to control using the Student’s t-test. Data represent the average of at least independent experiments.
Fig 2
Fig 2. Overexpression of LEDGF/p75 in PC3 cells attenuates TBHP-induced necrosis but not STS-induced apoptosis.
A. PC3 cells were treated with 100 μM TBHP or 4 μM STS to induce necrotic or apoptotic cell death, respectively, in the presence and absence of the broad caspase inhibitor zVAD-fmk. Cell viability was assessed at 6, 12, 24 h post-treatment and, at 6 h treatment plus 18 h recovery. B. Changes in cellular morphology associated with necrosis or apoptosis in PC3 cells treated with TBHP and STS, respectively, for 24 h. C. Nuclear morphology of PC3 cells visualized by DAPI staining. D. Caspase 3 activity was measured after treatment with TBHP or STS. E. Cleavage of Topo I into its signature apoptotic (70 kD) and necrotic (70 kD and 45 kD) fragments was detected by immunoblotting in PC3 cells treated with STS or TBHP, respectively (upper panel). Cleavage of LEDGF/p75 into its signature apoptotic fragment (65 kD) was detected in cells treated with STS but not in cells treated with TBHP (lower panel). β-actin was used as loading control. Lines indicate bands corresponding to intact proteins and arrows point to cleavage fragments. F. Immunoblot showing stable overexpression of LEDGF/p75 in PC3–ledgf/p75 clones as compared to PC3-Vec (empty pcDNA3.1 vector) or untransfected parental PC3 cells. G. Crystal violet viability assay showing that overexpression of LEDGF/p75 in PC3 cells promotes resistance to cell death induced by 75 and 100 μM TBHP but not STS. H. DCFH-DA oxidation flow cytometric analysis to measure the ability of LEDGF/p75 to reduce ROS induced by TBHP or STS in PC3–ledgf/p75 cells as compared to cells transfected with empty vector (PC3-Vec), in the presence or absence of TBHP or STS. Each graph represents the average of at least 3 independent experiments performed in triplicates (*P<0.05). P values were determined in comparison to control using Student’s t-test.
Fig 3
Fig 3. Multi-screen immunoblotting analysis to identify candidate stress proteins upregulated by LEDGF/p75 in RWPE-2 cells.
A. Lysates from cells stably overexpressing LEDGF/p75 (RWPE-2–ledgf/p75) and RWPE-2 cells transfected with empty pcDNA3.1 vector (RWPE-2-Vec) were individually analyzed by immunoblotting using the Kinetworks™ KHSP-1.0 screen platform. Validation was performed using commercial antibodies and changes in protein expression were determined in LEDGF/p75-overexpressing RWPE-2 cells in comparison to cells transfected with empty vector. B. Untransfected RWPE-2 cells, cells transfected with empty vector, and cells stably overexpressing LEDGF/p75 were tested in-house for additional validation of upregulation of ERp57 and Hsp90. β-actin was used as loading control.
Fig 4
Fig 4. Upregulation of ERp57 expression levels in PC3 cells stably overexpressing LEDGF/p75.
LEDGF/p75 and ERp57 transcript and protein levels were assessed by qPCR and immunoblotting, respectively. PC3 cells stably overexpressing LEDGF/p75 exhibited upregulation of ERp57 transcript and protein levels in PC3-ledgf/p75 clones transfected with pcDNA3.1 plasmid (A) and in PC3-viral-ledgf/p75 clones transfected with lentiviral vector (B). β-actin was used as loading control. Each graph represents the average of at least 3 independent experiments performed in triplicates (**P <0.01). P values were determined in comparison to cells transfected with empty vector as controls using the Student’s t-test.
Fig 5
Fig 5. Effects of transient and stable knockdown of LEDGF/p75 on ERp57 expression levels in PC3 cells.
LEDGF/p75 and ERp57 transcript and protein levels were assessed by qPCR and immunoblotting, respectively. A. Untransfected, parental PC3 cells with and without siRNA-induced transient depletion of LEDGF/p75; B. PC3-ledgf/p75 clones overexpressing LEDGF/p75 with and without siRNA-induced transient depletion of LEDGF/p75; C. PC3-viral-ledgf/p75 clones overexpressing LEDGF/p75 with and without siRNA-induced transient depletion of LEDGF/p75; D. PC3 cells with shRNA induced stable depletion of LEDGF/p75. Each graph represents the average of at least 3 independent experiments performed in triplicates (*P<0.05, **P <0.01). P values were determined in comparison to cells transfected with non-specific, scrambled control siRNAs (siSD or shSCR) using the Student’s t-test.
Fig 6
Fig 6. Effects of transient depletion of LEDGF/p75 on ERp57 expression levels in DU145 cells.
A. LEDGF/p75 and ERp57 transcript and protein levels were assessed by qPCR and immunoblotting, respectively. A. Transcript and protein expression levels of LEDGF/p75 and ERp57 in DU145-DR cells, selected for their resistance to DTX, compared to parental DU145 cells. B. Parental DU145 cells with and without siRNA induced transient depletion of LEDGF/p75. C. DU145-DR cells with and without siRNA induced transient depletion of LEDGF/p75. Each graph represents the average of at least 3 independent experiments performed in triplicates (*P<0.05, **P <0.01). P values were determined in comparison to cells transfected with non-specific, scrambled control siRNAs (siSD) using the Student’s t-test.
Fig 7
Fig 7. LEDGF/p75 transactivates ERp57 promoter in luciferase-based transcription reporter assays.
ERp57pr transactivation by LEDGF/p75 in A. PC3; B. DU145; C. RWPE-2; and D. U2OS cells. Luciferase activity in PCa cells co-transfected with ERp57pr vector and pcDNA-ledgfp/75 vector was compared to activity in cells co-transfected with ERp57pr vector and pcDNA empty vector (A-C). Luciferase activity in U2OS cells co-transfected with ERp57pr vector and pCruzHA-ledgfp/75 vector was compared to activity in cells co-transfected with ERp57pr vector and pCruzHA empty vector (D). Promoter activity determined as luciferase light units/protein is expressed as fold activation compared to control activity, which was normalized to one. Each graph represents the average of at least 3 independent experiments performed in triplicates (*P<0.05, **P <0.01). P values were determined using the Student’s t-test.
Fig 8
Fig 8. LEDGF/p75 binds to ERp57 promoter in ChIP assays.
A. Schematic diagram of ERp57 promoter. PCR primers targeted ERp57pr regions A (bp –498 to +1), B (bp –898 to – 490), C (bp – 890 to – 1298), D (bp – 1290 to – 1698), and E (bp – 1690 to – 2098). ChIP analysis of LEDGF/p75 binding to ERp57pr in PC3 (B) and U2OS (C) cells. Formaldehyde-fixed cells were precipitated with nonspecific IgG antibody or antibody specific for LEDGF/p75. PCR amplifications of immunoprecipitated DNA were carried out with primer sets specific for ERp57pr regions A to E. Primers for human β-actin or GAPDH were used to control for optimal enzymatic digestion of chromatin.
Fig 9
Fig 9. Immunohistochemical analysis of LEDGF/p75 and ERp57 expression in prostate tumor and control tissues.
A. Representative images of IHC staining in disease-free normal prostate tissues, matched normal adjacent prostate tissues, and prostate tumor tissues. Images were acquired under identical settings. B. Elevated expression of LEDGF/p75 and ERp57 proteins in tumor tissues compared to pooled controls. Prostate tissue microarray slides were stained with specific antibodies against LEDGF/p75 and ERp57, and the individual tissue cores were scored blindly using the following scale: 0 = no staining, 1 = low staining, 2 = moderate staining, 3 = strong staining. Scored tissues were pooled into two groups: low staining (0–1, dark bars) and high staining (2–3, light bars). The percentage of specimens in the two categories was plotted for tumor tissues compared to control (combined disease-free normal and normal adjacent) tissues. C. Pie chart showing the percentage of tissue specimens with high or low expression levels of LEDGF/p75 and ERp57. *P<0.05. P values were determined using the Chi-square test.

Similar articles

Cited by

References

    1. Siegel RL, Miller KD, Jemal A. Cancer statistics. CA Cancer J Clin 2015; 65: 5–29. 10.3322/caac.21254 - DOI - PubMed
    1. DeMarzo AM, Platz EA, Sutcliffe S, Xu J, Grönberg H, Drake CG, et al. Inflammation in prostate carcinogenesis. Nat Rev Cancer 2007; 7: 256–269. - PMC - PubMed
    1. Khandrika L, Kumar B, Koul S, Maroni P, Koul H. Oxidative stress in prostate cancer. Cancer Lett. 2009; 282: 125–136. 10.1016/j.canlet.2008.12.011 - DOI - PMC - PubMed
    1. Shiota M, Yokomizo A, Naito S. Oxidative stress and androgen receptor signaling in the development and progression of castrate-resistant prostate cancer. Free Radic Biol Med 2011;51: 1320–1328. 10.1016/j.freeradbiomed.2011.07.011 - DOI - PubMed
    1. Zoubeidi A, Gleave M. Small heat shock proteins in cancer therapy and prognosis. Int J Biochem Cell Biol 2012; 44: 1646–1656. 10.1016/j.biocel.2012.04.010 - DOI - PubMed

Publication types

MeSH terms

Substances